Effect of Health and Fitness Applications usage on body mass index, meal timing and lifestyle among undergraduate medical students: A cross sectional study.
- Harshdeep Joshi , Professor and Head, Department of Community Medicine, MMMC&H Solan, Himachal Pradesh, India
- Rahul Gupta , Assistant Professor, Department of Community Medicine, MMMC&H Solan, Himachal Pradesh, India
- Sidra Nafiz , Junior Resident, Department of Community Medicine, MMMC&H Solan, Himachal Pradesh, India.
Article Information:
Abstract:
Background: The rapid rise of health and fitness applications has transformed personal health monitoring practices, particularly among young adults. Medical students, owing to their academic stress and sedentary schedules, represent a population that may benefit from such digital tools. However, evidence regarding their actual usage patterns and associations with BMI, meal timing, and lifestyle behaviors remains limited. Objectives: To assess the usage patterns of health and fitness applications among undergraduate medical students; to determine the association between app usage, BMI, and meal-timing behaviors; and to evaluate the effect of app usage on lifestyle factors such as sleep and physical activity. Methods: A cross-sectional analytical study was conducted over three months among undergraduate medical students from Phase I, II, and III. Data were collected using a validated, interviewer-assisted, semi-structured questionnaire. Statistical analysis was performed using SPSS 25. Variables were recoded for analysis, including sleep duration (<7 vs ≥7 hours), meal regularity (regular vs irregular), physical activity (inactive vs active), BMI category (overweight/obese vs normal/underweight), and frequency of app use (high vs low). Descriptive statistics, chi-square tests, t-tests, and multivariate logistic regression were used. A p-value <0.05 was considered significant. Results: Among the 364 participants, 44% reported using health and fitness applications. App users had a significantly higher mean BMI compared to non-users (23.80 ± 4.11 vs 22.19 ± 3.71; p <0.001). Breakfast regularity showed a significant association with app usage, with irregular breakfast habits more common among app users (p <0.001). Dinner regularity also varied notably between groups. No significant associations were observed between app usage and physical activity level or sleep duration. Multivariate analysis identified higher BMI and irregular breakfast timing as independent predictors of app usage. Conclusion: Health and fitness app usage is common among medical students; however, it does not consistently translate into healthier behavioral patterns. App users had higher BMI, and more irregular breakfast habits, suggesting that students may adopt apps reactively in response to existing lifestyle challenges rather than proactively for health enhancement. Tailored digital interventions that integrate behavioral support, rather than self-tracking alone, may be more effective in promoting healthy habits among medical students.
Keywords:
Article :
INTRODUCTION:
The integration of digital health technology, particularly health and fitness applications, has revolutionized personal health management and lifestyle choices globally.[1] By 2020, there were approximately 6.1 billion mobile phone users worldwide, and the majority of adolescents had access to a mobile device.[2] More than 15,000 mobile applications for health care were identified in a recent survey, highlighting the rapid expansion of this digital ecosystem.[3] As technology advances and the obesity epidemic continues to grow, the assessment of smartphone applications’ effectiveness in improving specific individual health outcomes is becoming an increasingly popular research focus.[3]
Earlier studies have documented the advantageous impact of consistent physical activity on numerous health measures, encompassing physical, physiological, and mental health domains.[4] Poor lifestyle increases the risk of noncommunicable diseases (NCDs), necessitating the need for accessible and efficient digital solutions.[4]
The proliferation of health apps underscores their potential impact on modifying health behavior, particularly among young adults entering the medical profession.[5] Studies have suggested that the use of such technologies can lead to improvements in BMI by promoting healthier dietary choices and regular physical activity.[5] Furthermore, the tracking features of these apps enable users to monitor meal timing, potentially optimizing metabolic health and energy balance.[6] Beyond individual health metrics, these applications may contribute to broader lifestyle modifications, fostering healthier routines and stress-management practices among medical students.[6]
Among the beneficiaries are medical students, a population known for its rigorous academic demands and stressful lifestyle. Health and fitness apps offer convenience in tracking various health metrics, promoting physical activity, and facilitating dietary management. Despite their promising benefits, the effectiveness of health and fitness apps in influencing BMI, meal timing, and overall lifestyle among medical students remains an area of active research. This study aims to assess current trends in health and fitness application usage, explore their documented effects on health parameters, and identify gaps in knowledge that merit further investigation.
MATERIALS AND METHODS:
This cross-sectional analytical study was conducted over a period of three months among undergraduate medical students enrolled in Phase I, Phase II, and Phase III at MM Medical College. A total of 450 students across these phases were approached, and all those who provided informed consent were included in the study, while those unwilling to participate were excluded. Data collection was carried out within the college premises using an interviewer-assisted, self-designed, semi-structured questionnaire. Before administering the questionnaire, the purpose of the study was explained to each participant, and confidentiality and anonymity were assured.
The questionnaire had been content-validated prior to field administration and captured sociodemographic details such as age, gender, year of study, and area of residence. It also included information related to smartphone ownership, installation of health and fitness applications, frequency and purpose of app usage, step-counting behavior, calorie-tracking practices, and reasons for using these apps. Lifestyle-related variables included breakfast, lunch, and dinner regularity; sleep duration and sleep quality; perceived fitness goals; adherence to a healthy meal plan; and the presence of lifestyle-related conditions such as PCOD, hypertension, obesity, and thyroid disorders. Physical activity levels were assessed using the International Physical Activity Questionnaire (IPAQ) short form, which categorizes individuals as inactive, minimally active, or active.
Ethical approval for the study was obtained from the Institutional Ethics Committee (IEC). Participation was voluntary, and no financial burden was imposed on participants. No laboratory investigations were included as part of the study protocol.
All collected data were entered into Microsoft Excel and analyzed using SPSS version 25. Data cleaning was performed prior to analysis, during which incomplete entries, missing values, and responses marked as “?”, blank, or “–” were removed or treated as missing. Several variables underwent coding to facilitate statistical testing and regression modeling. App usage was coded as a binary variable (user vs non-user). Frequency of app use was recoded into high frequency (daily or several times per week) and low frequency (once per week or rarely). Sleep duration, originally collected as <7 hours, 7–8 hours, and >8 hours, was recoded into <7 hours versus ≥7 hours. Sleep quality was categorized as sound versus disturbed sleep. Physical activity, as measured by IPAQ, was dichotomized as inactive versus active (minimally active and active combined). Meal timing patterns for breakfast, lunch, and dinner were recoded into regular (always or often) versus irregular (sometimes, rarely, or never). BMI was analyzed both as a continuous variable and as a categorical variable; for regression purposes, BMI categories were dichotomized into overweight/obese versus normal/underweight. Step-counting behavior was coded as yes or no.
Descriptive statistics were generated using frequencies and percentages for categorical variables, and mean and standard deviation for continuous variables. Univariate analysis was performed using the Chi-square test to assess associations between app usage and categorical independent variables such as BMI category, physical activity level, sleep duration, sleep quality, and meal-timing patterns. Mean BMI among app users and non-users was compared using the independent t-test. Variables found to be significant in univariate analysis were entered into a binary logistic regression model to identify independent predictors of app usage. Logistic regression results were presented as odds ratios (OR) with 95% confidence intervals (CI), and a p-value of <0.05 was considered statistically significant.
RESULTS:
The study included a total of 364 undergraduate medical students. A majority of the participants were females, accounting for 221 students (60.7%), while males comprised 143 students (39.3%). Most participants belonged to Phase 1 of the MBBS program (Batch 2023), representing 140 students (38.5%). This was followed by Phase 2 (Batch 2022) with 113 students (31.0%) and Phase 3 (Batch 2021) with 111 students (30.5%).
TABLE 1. Sociodemographic Profile of Participants (N = 364)
|
Variable |
Value |
|
Age (Mean ± SD) |
20.43 ± 1.29 years |
|
BMI (Mean ± SD) |
23.08 ± 4.11 kg/m² |
|
Gender: Female |
221 (60.7%) |
|
Gender: Male |
139 (38.2%) |
|
Batch: Phase 1 |
127 (34.9%) |
|
Batch: Phase 2 |
114 (31.3%) |
|
Batch: Phase 3 |
123 (33.8%) |
A total of 355 students (97.5%) reported owning a smartphone or smartwatch, while only 9 students (2.5%) did not own such a device. Among the total sample, 160 students (44.0%) reported using at least one health and fitness application, whereas 204 students (56.0%) did not use any health and fitness app.
TABLE 2. Smartphone Ownership and Use of Health & Fitness Applications
|
Variable |
Value |
|
Owns smartphone/smartwatch |
355 (97.5%) |
|
Do not own smartphone/smartwatch |
9 (2.5%) |
|
Uses any Health & Fitness App |
160 (44.0%) |
|
Do not use any Health & Fitness App |
204 (56.0%) |
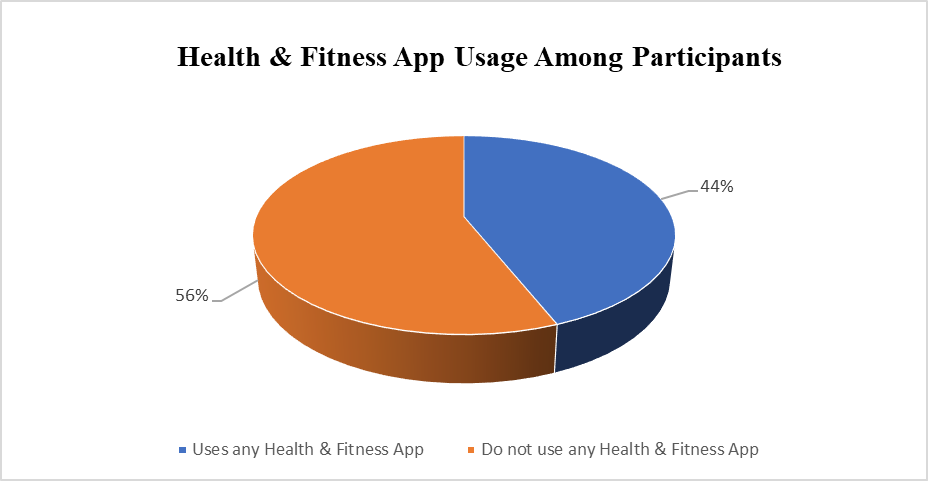
Figure 1: Health and Fitness application usage among the study participants
Among the 160 students who reported using health and fitness applications, the largest proportion used these applications several times a week, accounting for 63 students (39.4%). This was followed by 48 students (30.0%) who used the applications daily. A smaller proportion, 28 students (17.5%), reported using the applications rarely, while 19 students (11.9%) used them once a week.
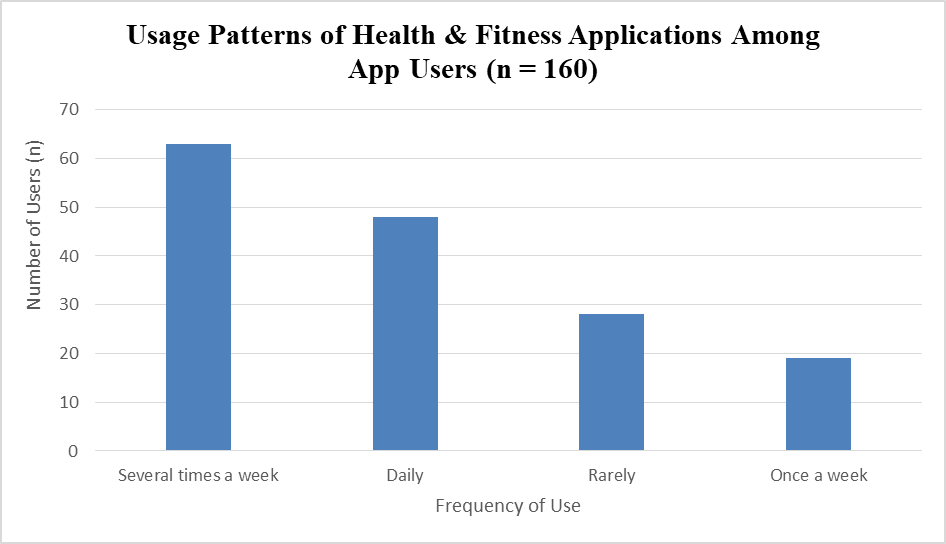
Figure 2: Usage patterns of health and fitness applications among users
The mean BMI of students who used health and fitness applications was 23.80 ± 4.11 kg/m², whereas the mean BMI among non-users was 22.19 ± 3.71 kg/m². The difference in mean BMI between the two groups was statistically significant (p <0.001).
TABLE 3. BMI Category by App Usage
|
BMI Category |
Non-Users (n, %) |
Users (n, %) |
P value |
|
Underweight |
19 (48.7%) |
20 (51.3%) |
|
|
Normal |
72 (48.6%) |
76 (51.4%) |
|
|
Overweight |
36 (58.1%) |
26 (41.9%) |
|
|
Obese |
72 (66.7%) |
36 (33.3%) |
|
|
Over BMI |
22.19 ± 3.71 |
23.80 ± 4.11 |
<0.001 |
N = 364
Meal regularity varied between app users and non-users. For breakfast, app users were more likely to report irregular consumption, with a higher proportion of users in the “sometimes” (53.6%), “rarely” (55.9%), and “never” (71.4%) categories, whereas non-users predominated among those who consumed breakfast “always” (58.1%) or “often” (72.0%).
In contrast, lunch regularity showed a similar distribution between users and non-users across all categories, with most participants reporting that they always consumed lunch (55.8%) whereas among non-users only 44.2% were consuming lunch. For dinner, non-users were more frequently represented among participants who consumed dinner regularly (“always” or “often”), while users constituted a greater proportion of those who reported consuming dinner only “sometimes” (55.6%) or never (100.0%).
Overall, irregular breakfast consumption appeared more common among app users, whereas lunch and dinner regularity showed less marked differences between the two groups.
TABLE 4. Breakfast, Lunch and Dinner Regularity by App Usage
|
Meal |
Regularity |
Non-Users (n, %) |
Users (n, %) |
|
Breakfast |
Always |
61 (58.1%) |
43 (41.0%) |
|
|
Often |
72 (72.0%) |
27 (27.0%) |
|
|
Sometimes |
32 (46.4%) |
37 (53.6%) |
|
|
Rarely |
30 (44.1%) |
38 (55.9%) |
|
|
Never |
6 (28.6%) |
15 (71.4%) |
|
Lunch |
Always |
153 (55.8%) |
121 (44.2%) |
|
|
Often |
31 (52.5%) |
28 (47.5%) |
|
|
Sometimes |
12 (63.2%) |
7 (36.8%) |
|
|
Rarely |
4 (66.7%) |
2 (33.3%) |
|
|
Never |
2 (50.0%) |
2 (50.0%) |
|
Dinner |
Always |
115 (59.3%) |
79 (40.7%) |
|
|
Often |
46 (59.0%) |
32 (41.0%) |
|
|
Sometimes |
32 (44.4%) |
40 (55.6%) |
|
|
Rarely |
9 (69.2%) |
4 (30.8%) |
|
|
Never |
0 (0.0%) |
3 (100.0%) |
N = 364
Among students classified as physically inactive, 69 were non-users (63.3%) and 40 were app users (36.7%). Among those who were physically active, 135 were non-users (52.9%) and 120 were app users (47.1%).
Whereas the participants reporting sound sleep, 139 were non-users (55.6%) and 111 were app users (44.4%). Among those reporting disturbed sleep, 65 were non-users (57.0%) and 49 were app users (43.0%).
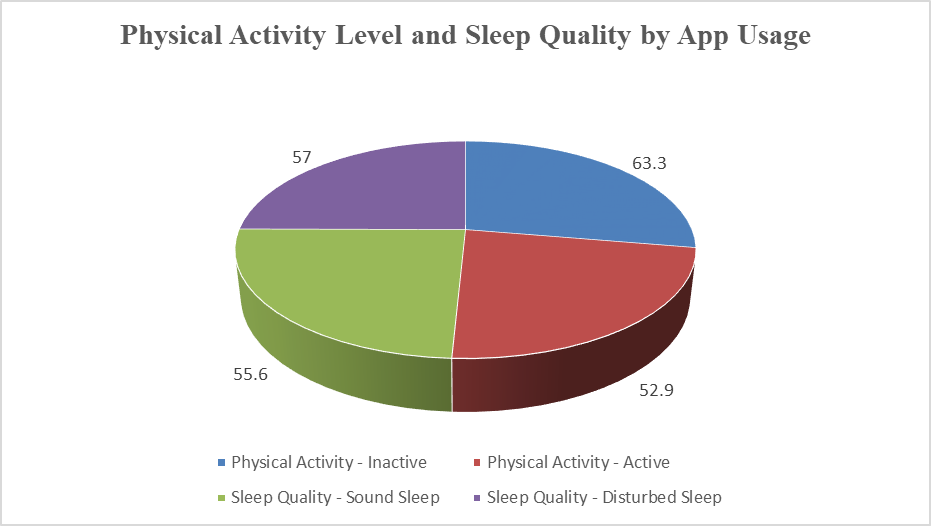
Figure 3: Physical Activity Level and Sleep Quality By App Usage
Among students who slept for less than seven hours, 109 were non-users (52.4%) and 99 were app users (47.6%).
TABLE 5. Sleep Duration by App Usage
|
Sleep Duration |
Non-Users (n, %) |
App Users (n, %) |
|
< 7 hours |
109 (52.4%) |
99 (47.6%) |
|
7–8 hours |
94 (61.4%) |
59 (38.6%) |
|
> 8 hours |
1 (33.3%) |
2 (66.7%) |
N = 364
In the crude analysis, female students showed higher odds of health and fitness app usage compared with males, although this association did not reach statistical significance (OR 1.52, 95% CI 0.99–2.35; p = 0.056). After adjustment, the association remained non-significant (AOR 1.54, 95% CI 0.85–2.80; p = 0.155). Students with BMI ≥23 kg/m² had significantly lower odds of app usage in both univariate (OR 0.54, 95% CI 0.36–0.83; p = 0.005) and multivariate analysis (AOR 0.35, 95% CI 0.19–0.63; p = 0.001), indicating that app users were more likely to belong to the lower-BMI group.
Breakfast regularity demonstrated a strong and consistent association with app usage. Participants who had breakfast regularly (always or often) had significantly lower odds of using fitness applications in both crude (OR 0.40, 95% CI 0.26–0.61; p < 0.001) and adjusted models (AOR 0.48, 95% CI 0.27–0.85; p = 0.012), suggesting that app users were more likely to have irregular breakfast patterns. Lunch regularity showed no association with app use in either univariate (OR 0.99, 95% CI 0.61–1.61; p = 0.979) or multivariate analysis (AOR 1.07, 95% CI 0.53–2.15; p = 0.852). Dinner regularity was associated with lower app usage in the crude model (OR 0.60, 95% CI 0.37–0.98; p = 0.039); however, this association lost significance after adjustment (AOR 0.58, 95% CI 0.28–1.21; p = 0.146).
Physical activity showed a positive but statistically non-significant association with app usage (crude OR 1.53, p = 0.069; adjusted OR 1.72, p = 0.107). Sleep quality (sound vs disturbed) demonstrated no meaningful association with app usage in either unadjusted (OR 0.94, 95% CI 0.60–1.47; p = 0.80) or adjusted analysis (AOR 0.91, 95% CI 0.63–1.44; p = 0.79). Sleep duration, however, showed an important finding: although the crude association was not statistically significant (OR 0.71, 95% CI 0.46–1.08; p = 0.107), students sleeping ≥7 hours per night had significantly lower odds of app usage in the adjusted model (AOR 0.55, 95% CI 0.31–0.99; p = 0.048), indicating that shorter sleep duration independently predicted app use.
Table 6. Univariate and Multivariate Analysis of Factors Associated with Use of Health and Fitness Applications
|
Variable |
Users n (%) |
Non-users n (%) |
Crude OR (95% CI) |
p-value |
Adjusted OR (95% CI) |
p-value |
|
Female gender |
107 (66.9%) |
114 (57.0%) |
1.52 (0.99–2.35) |
0.056 |
1.54 (0.85–2.80) |
0.155 |
|
BMI ≥23 kg/m² |
62 (39.2%) |
108 (54.3%) |
0.54 (0.36–0.83) |
0.005 |
0.35 (0.19–0.63) |
0.001 |
|
Regular breakfast (Always/Often) |
70 (43.8%) |
133 (66.2%) |
0.40 (0.26–0.61) |
<0.001 |
0.48 (0.27–0.85) |
0.012 |
|
Regular lunch (Always) |
121 (75.6%) |
153 (75.7%) |
0.99 (0.61–1.61) |
0.979 |
1.07 (0.53–2.15) |
0.852 |
|
Regular dinner (Always/Often) |
111 (70.3%) |
161 (79.7%) |
0.60 (0.37–0.98) |
0.039 |
0.58 (0.28–1.21) |
0.146 |
|
Physically active |
120 (75.0%) |
135 (66.2%) |
1.53 (0.97–2.43) |
0.069 |
1.72 (0.89–3.34) |
0.107 |
|
Sleep Quality (Sound) |
111 (44.4%) |
139 (55.6%) |
0.94 (0.60-1.47) |
0.80 |
0.91 (0.63-1.44) |
0.79 |
|
Sleep ≥7 hours |
61 (38.1%) |
95 (46.6%) |
0.71 (0.46–1.08) |
0.107 |
0.55 (0.31–0.99) |
0.048 |
DISCUSSION:
The present study examined the usage patterns of health and fitness applications and explored their association with BMI, meal timing, and lifestyle behaviors among undergraduate medical students. With the widespread availability of smartphones and increasing interest in digital self-monitoring tools, understanding how these applications influence health-related behaviors among medical students is an important area of inquiry.
Usage Pattern of Health and Fitness Applications
In the present study, 44% of medical students reported using health and fitness applications, indicating a moderate level of digital health adoption. This aligns with the findings of Rajan and Muthunarayanan (2024), who reported 14.8% usage of health-based applications in their community study, and Jabour et al. (2021), who documented substantial mobile health application adoption among university students in health-related fields.[7,8] These findings collectively indicate that while adoption levels vary by population, young adults in academic settings demonstrate consistent interest in health-related mobile technology.
A higher proportion of females observed in this study is consistent with previous evidence. Jabour et al. (2021) reported that female students were more likely to adopt mobile health applications for nutrition, fitness, and wellbeing, suggesting gender-based differences in health motivation and engagement.[8] Similarly, Banerjee et al. (2020) noted greater interest in calorie-counting and dietary-monitoring applications among young Indian women, driven by greater weight-awareness and self-monitoring behaviors.[9]
In the present study, nearly half of the medical students reported using health and fitness applications, reflecting a moderate but meaningful level of engagement with mobile health tools. Similar usage trends have been documented in other young adult and student populations. For instance, Jabour et al. (2021) reported widespread adoption of mobile health applications among university students in health-related programs, highlighting strong interest in digital tools for fitness, nutrition, and self-monitoring. Likewise, Rajan and Muthunarayanan (2024) observed that young adults commonly used health-based applications for lifestyle tracking, stress monitoring, and physical activity management. In the Indian context, Banerjee et al. (2020) found high levels of curiosity and engagement with calorie-counting and nutrition-monitoring apps, even though long-term adherence was limited. Collectively, these findings indicate that medical and university students are receptive to mobile health applications, particularly those offering self-monitoring features, user-friendly interfaces, and perceived support for weight management or lifestyle improvement. However, as seen in several studies, including Mateo-Orcajada et al. (2024), consistent long-term usage often depends on external reinforcement, structured guidance, and clear behavioral goals—factors that may influence the sustainability of app engagement among students.
Association Between App Usage, BMI, and Meal Timing
A key finding of the current study was that app users had a significantly higher mean BMI compared to non-users. Although many international reviews reported that mobile health apps can reduce weight and BMI in structured interventions, contrasting evidence is well documented.[13–15] Banerjee et al. (2020) showed that even regular use of calorie-counting apps did not lead to significant reductions in weight or BMI among young adults in an Indian population.[9] Similarly, Yien et al. (2021) found that mobile health technologies had no significant overall effect on BMI reduction in adolescents, with benefits restricted to specific subgroups.[16]
Closer to the Indian context, Setu et al. (2021) reported a high prevalence of overweight and obesity among medical students, driven by a combination of dietary, lifestyle, and sociodemographic factors.[15] Given these findings, the higher BMI observed among app users in this study likely reflects reverse causation, that is, students with elevated BMI may turn to digital tools as a corrective measure, rather than app use causing weight gain. This interpretation aligns with Das et al. (2024), who reported a significant association between higher BMI and smartphone overuse, indicating that students with weight concerns tend to adopt digital tools but may not use them effectively.[17]
Meal timing patterns in the present study showed that app users were more likely to skip or delay breakfast, which is consistent with established literature linking irregular meal timing with higher smartphone engagement and disordered lifestyle routines. Das et al. (2024) found that individuals with higher smartphone addiction scores exhibited more irregular meal habits, including skipped meals and late-night eating.[17] Although not directly evaluating meal timing, Banerjee et al. (2020) noted that many app users continued to maintain inconsistent dietary routines despite using calorie-counting apps, suggesting that app adoption does not automatically translate to healthier eating patterns.[9] Thus, the irregular meal timing observed among app users in the present study may again reflect reactive app engagement rather than app-induced improvements.
Effect of App Usage on Lifestyle Behaviors
Physical Activity
The present study found no significant difference in physical activity levels between app users and non-users. This contrasts with structured intervention trials such as Mateo et al. (2015) and Park et al. (2019), which showed modest improvements in physical activity with app use.[10,11]
However, these trials provided structured goals, reminders, and feedback mechanisms, unlike real-world settings. In naturalistic conditions, behavior change may require more sustained motivation.
This is supported by Mateo-Orcajada et al. (2024), who observed that although adolescents increased physical activity during a mandatory, promoted intervention phase, these improvements were not sustained when app use became voluntary.[12] Similarly, Banerjee et al. (2020) concluded that self-monitoring through apps alone did not significantly increase daily activity or produce meaningful changes in lifestyle behaviors.[9] Thus, the absence of physical activity differences in this study is consistent with literature indicating that self-directed app use is insufficient without structured behavioral reinforcement.
Sleep Duration and Sleep Quality
A notable observation in this study was that students with shorter sleep duration (<7 hours) were more likely to use health and fitness apps. This aligns with the findings of Das et al. (2024), who reported that smartphone-dependent young adults had reduced sleep duration and poorer sleep hygiene, often due to late-night device use.[17] Although our study did not examine smartphone addiction directly, the association between app use and shorter sleep duration suggests a similar pattern of digital engagement affecting sleep.
Despite this, sleep quality did not differ significantly between users and non-users in our analysis. This is consistent with the mixed findings reported in the literature. For instance, Yien et al. (2021) and Banerjee et al. (2020) found that although digital health interventions may influence behaviors related to sleep or wellbeing, subjective assessments (e.g., sleep quality) often remain unchanged even when objective parameters worsen.[9,16] This suggests that medical students may underrecognize the effects of digital engagement on their sleep, reporting adequate sleep quality despite reduced duration or delayed bedtimes.
Taken together, the lifestyle findings from this study suggest that health and fitness app usage among medical students may be more reactive than proactive. Students with shorter sleep duration and irregular breakfast timing were more likely to use these applications, possibly reflecting an attempt to compensate for existing lifestyle challenges rather than the presence of already healthy routines. Despite moderate levels of app adoption, substantial improvements in sleep patterns, meal regularity, or physical activity were not observed. This aligns with literature indicating that app usage alone is often insufficient to drive sustained behavior change unless accompanied by structured guidance, personalized feedback, or behavioral reinforcement strategies.[18–20]
This study is strengthened by its robust sample size, inclusion of students across all academic phases, and comprehensive assessment of anthropometric, dietary, sleep, and physical activity variables. It is also among the few studies to examine app usage alongside meal timing, a relatively underexplored dimension in digital health research among students.
The cross-sectional design limits causal inference. Self-reported measures may introduce recall bias. The single-center setting may reduce generalizability. Additionally, the study did not assess type, duration, or quality of app usage, which may influence outcomes.
Longitudinal research incorporating objective measures such as wearable trackers, automatic step counters, and app usage logs would provide deeper insights. Interventional studies could evaluate app-based modules that target meal timing, sleep hygiene, and structured physical activity programs specifically tailored for medical students.
CONCLUSION:
The study demonstrates that while the use of health and fitness applications is common among medical students, their association with lifestyle behaviors is not uniformly positive. App users were more likely to have irregular breakfast patterns and shorter sleep duration, indicating that students may adopt these applications in response to existing lifestyle challenges rather than as part of already healthy routines. Although app usage was not associated with physical activity levels or sleep quality, the findings emphasize that self-monitoring alone may be insufficient to achieve meaningful lifestyle modification. There is a clear need for more structured and behavior-focused digital interventions that move beyond tracking features and incorporate personalized guidance, goal-setting, and behavioral support to effectively promote sustained healthy habits among medical students.
REFERENCES:
1. Ericsson. Ericsson Mobility Report [Internet]. 2016.
2. Ofcom. Children and Parents: Media Use and Attitudes Report [Internet]. 2014.
3. Anthes E. Mental health: there’s an app for that. Nature. 2016;532:20–3.
4. Chekroud SR, Gueorguieva R, Zheutlin AB, others. Association between physical exercise and mental health in 1.2 million individuals in the USA: a cross-sectional study. Lancet Psychiatry. 2018;5:739–46.
5. Smith A, Chaparro B. App-based interventions for health behavior change: a systematic review. J Mob Technol Med. 2016;
6. Brown A, Sharp C, Tam R. The effect of meal timing on energy balance and metabolic health: a systematic review. Nutrients. 2020;12:1–8.
7. Rajan R, Muthunarayanan L. A Comparative Study on the Prevalence of Lifestyle Risk Factors Among Users and Non-users of Any Health-Based Mobile App Among University Students in Chennai. Cureus. 2024;16:56203.
8. Jabour AM, Rehman W, Idrees S, Thanganadar H, Hira K, Alarifi MA. The adoption of mobile health applications among university students in health colleges. J Multidiscip Healthc. 2021;14:1267–73.
9. Banerjee P, Mendu VVR, Korrapati D, Gavaravarapu SRM. Calorie counting smart phone apps: Effectiveness in nutritional awareness, lifestyle modification and weight management among young Indian adults. Health Informatics J. 2020;26:816–28.
10. Mateo GF, Granado-Font E, Ferré-Grau C, Montaña-Carreras X. Mobile phone apps to promote weight loss and increase physical activity: A systematic review and meta-analysis. J Med Internet Res. JMIR Publications Inc.; 2015.
11. Park SH, Hwang J, Choi YK. Effect of mobile health on obese adults: A systematic review and meta-analysis. Healthc Inform Res. 2019;25:12–26.
12. Mateo-Orcajada A, Vaquero-Cristóbal R, Mota J, Abenza-Cano L. Physical Activity, Body Composition, and Fitness Variables in Adolescents after Periods of Mandatory, Promoted or Nonmandatory, Nonpromoted Use of Step Tracker Mobile Apps: Randomized Controlled Trial. JMIR Mhealth Uhealth. 2024;12:e51206.
13. De Cock N, Vangeel J, Lachat C, Beullens K, Vervoort L, Goossens L, et al. Use of fitness and nutrition apps: Associations with body mass index, snacking, and drinking habits in adolescents. JMIR Mhealth Uhealth. 2017;5:1–17.
14. Zhang Q, Li Z, Jiang L, Gao Y, Gong T, Li J, et al. Effects of an Exercise Intervention Based on mHealth Technology on the Physical Health of Male University Students With Overweight and Obesity: Randomized Controlled Trial. J Med Internet Res. 2025;27.
15. Setu Y, Sulania A, Jha RP, Goel SK. Pattern and determinants of obesity among undergraduate medical students of Delhi. International Journal of Scientific Reports. 2020;7:56.
16. Yien JM, Wang HH, Wang RH, Chou FH, Chen KH, Tsai FS. Effect of Mobile Health Technology on Weight Control in Adolescents and Preteens: A Systematic Review and Meta-Analysis. Front Public Health. Frontiers Media S.A.; 2021. p. 1–8.
17. Das P, Saraswathy KN, Chaudhary V. Prevalence of Smartphone Addiction and its Relationship with Obesity among Young Adults: A Cross-sectional Study from Delhi, India. Indian Journal of Community Medicine. 2024;49:544–8.
18. Kim HN, Seo K. Smartphone-based health program for improving physical activity and tackling obesity for young adults: A systematic review and meta-analysis. Int J Environ Res Public Health. 2020;17:1–15.
19. Metzendorf MI, Wieland LS, Richter B. Mobile health (m-health) smartphone interventions for adolescents and adults with overweight or obesity. Cochrane Database of Systematic Reviews. 2024;2024:1–209.
20. Jain P, Gedam SR, Patil PS. Study of smartphone addiction: prevalence, pattern of use, and personality dimensions among medical students from rural region of central India. Open J Psychiatry Allied Sci. 2019;10:132.