STUDY OF SEVERITY INDEX OF DIABETIC FOOT BASED ON MAGNETIC RESONANCE IMAGING (MRI) FINDINGS
- Raja Brahma , PGT, MBBS, Department of General Surgery, Nilratan Sircar Medical College and Hospital, 138, A.J.C. Bose Road, Kolkata–700014
- Arijit Mukherjee , Associate Professor, MBBS (Cal), MS (Cal), MRCS (Eng), FIAGES, Department of General Surgery, Nilratan Sircar Medical College & Hospital, 138, A.J.C. Bose Road, Kolkata–700014
Article Information:
Abstract:
Introduction: Diabetic foot is a serious complication of diabetes mellitus that can lead to infection, tissue destruction, and amputation. Magnetic Resonance Imaging (MRI) plays a vital role in accurately assessing the extent and severity of diabetic foot involvement.Aims and Objectives: To study the severity index of diabetic foot based on Magnetic Resonance Imaging (MRI) findings and evaluate the spectrum of pathological changes associated with diabetic foot complications. Materials and Methods: This was a descriptive prospective study conducted over 18 months in the Department of General Surgery, NRS Medical College & Hospital. A total of 50 diabetic patients (18–75 years) with foot ulcers, infections, gangrene, or suspected osteomyelitis undergoing MRI were included and analyzed for clinical and imaging findings.Results: Clinical features like ulcer (75.0%, 86.4%, 87.5%; p = 0.5736), fever (35.0%, 45.5%, 62.5%; p = 0.4091), pus discharge (55.0%, 54.5%, 37.5%; p = 0.6693), and MRI findings such as neuropathy (45.0%, 36.4%, 50.0%; p = 0.7516) and vascular disease (45.0%, 59.1%, 75.0%; p = 0.3264) were also not significant. However, soft tissue edema (20.0%, 54.5%, 62.5%; p = 0.0338), MRI severity score (p = 0.0393), outcome (p = 0.0298), age (p = 0.0446), and ulcer duration (p = 0.049) showed significant association with severity.Conclusion: MRI is an effective tool for evaluating diabetic foot complications and determining disease severity. MRI-based severity assessment aids in early diagnosis, treatment planning, and reducing the risk of adverse outcomes, including limb loss.
Keywords:
Article :
INTRODUCTION:
Diabetic foot is a major complication of diabetes mellitus and is highly susceptible to ulceration due to peripheral neuropathy, microangiopathy, peripheral vascular disease, and altered foot biomechanics. Foot ulcers frequently become infected through direct spread of microorganisms from the skin surface, leading to involvement of deeper soft tissues, joints, and bones. The lifetime risk of developing a diabetic foot ulcer is estimated to be as high as 25%, making it a significant cause of morbidity, hospitalization, lower-limb amputation, and premature mortality. Consequently, early diagnosis and appropriate management are essential to reduce the burden of disease and improve patient outcomes [1].
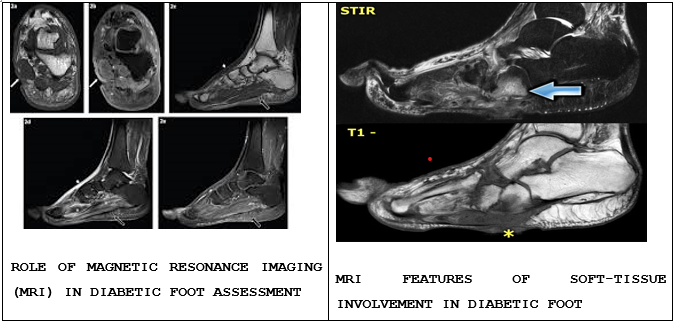
The primary objective of imaging in diabetic foot evaluation is the prompt detection of infection, identification of abscesses, and differentiation between soft tissue infection and osteomyelitis. Conventional imaging modalities such as plain radiography, although widely available and inexpensive, have limited sensitivity and specificity, particularly in the early stages of infection. Ultrasonography and computed tomography provide additional information but are less effective in evaluating early marrow and soft tissue changes. Nuclear medicine techniques, including radionuclide scans and labeled white blood cell imaging, may improve infection detection but are often limited by poor anatomical resolution and variable diagnostic accuracy [2–4]. Magnetic Resonance Imaging (MRI) has emerged as the imaging modality of choice for the assessment of diabetic foot complications due to its excellent soft tissue contrast, multiplanar imaging capability, and high diagnostic accuracy. MRI can detect early bone marrow edema, osteomyelitis, cellulitis, abscesses, sinus tracts, tenosynovitis, septic arthritis, and neuropathic arthropathy before these abnormalities become apparent on conventional imaging. Meta-analyses have demonstrated MRI sensitivity of approximately 90% and specificity of 83% in diagnosing diabetic foot osteomyelitis, making it the most reliable non-invasive imaging technique currently available [5–7].
Accurate assessment of disease severity remains challenging because diabetic foot infections often coexist with non-infectious conditions such as Charcot neuroarthropathy and chronic degenerative changes. MRI not only identifies the presence of pathology but also provides comprehensive information regarding the extent of soft tissue and bone involvement. This detailed evaluation facilitates treatment planning, including decisions regarding conservative therapy, surgical debridement, or amputation [8]. To improve clinical decision-making, several MRI-based grading systems and severity indices have been proposed. These scoring systems incorporate findings such as ulcer depth, abscess formation, osteomyelitis, joint involvement, and extent of soft tissue infection to provide an objective measure of disease severity. Such indices help predict prognosis, monitor disease progression, and guide therapeutic interventions [9]. Despite the recognized advantages of MRI, standardized application of MRI-based severity indices remains limited, particularly in resource-constrained healthcare settings. A structured evaluation of MRI findings may enhance early detection of severe disease, facilitate timely intervention, improve limb salvage rates, and reduce the incidence of major amputations. Therefore, studying the severity index of diabetic foot based on MRI findings is essential for optimizing patient management and improving clinical outcomes [10]. To study the severity index of diabetic foot based on Magnetic Resonance Imaging (MRI) findings and evaluate the spectrum of pathological changes associated with diabetic foot complications.
MATERIALS AND METHODS:
Study design
Descriptive Prospective study.
Study setting
Department of General Surgery at NRS Medical College & Hospital
Period of study
18 Months
Study population
Patients aged 18–75 years with diabetes mellitus presenting with diabetic foot ulcers, infections, gangrene, suspected osteomyelitis, or other diabetic foot complications undergoing MRI evaluation.
Sample size: 50
Inclusion criteria
• Patients those who are willing to participate the study
Exclusion criteria
• Patients who refuse to give informed written consent
Statistical analysis
All the data will be collected systematically, compiled using Microsoft Excel worksheet and is presented as tables and figures. Statistical analysis was carried out with help of statistical package for social sciences (SPSS).
RESULTS:
Table 01: Association between Age and Severity Category
|
|
Category |
Mild n (%) |
Moderate n (%) |
Severe n (%) |
P value |
|
Age group |
40–50 |
7 (35.0%) |
3 (13.6%) |
5 (62.5%) |
0.1974 |
|
51–60 |
5 (25.0%) |
4 (18.2%) |
1 (12.5%) |
||
|
60–70 |
6 (30.0%) |
11 (50.0%) |
1 (12.5%) |
||
|
>71 |
2 (10.0%) |
4 (18.2%) |
1 (12.5%) |
||
|
Diabetes type |
Type 1 |
3 (15.0%) |
1 (4.5%) |
0 (0.0%) |
0.3036 |
|
Type 2 |
17 (85.0%) |
21 (95.5%) |
8 (100.0%) |
Table 02: Association between Wagner Grade and Severity Category
|
|
Category |
Mild n (%) |
Moderate n (%) |
Severe n (%) |
P value |
|
Ulcer |
No |
5 (25.0%) |
3 (13.6%) |
1 (12.5%) |
0.5736 |
|
Yes |
15 (75.0%) |
19 (86.4%) |
7 (87.5%) |
||
|
Fever |
No |
13 (65.0%) |
12 (54.5%) |
3 (37.5%) |
0.4091 |
|
Yes |
7 (35.0%) |
10 (45.5%) |
5 (62.5%) |
||
|
Pus discharge |
No |
9 (45.0%) |
10 (45.5%) |
5 (62.5%) |
0.6693 |
|
Yes |
11 (55.0%) |
12 (54.5%) |
3 (37.5%) |
Table 03: Association between Soft Tissue Edema (MRI Finding) and Severity Category
|
|
Category |
Mild n (%) |
Moderate n (%) |
Severe n (%) |
Total n (%) |
P value |
|
Peripheral neuropathy |
No |
11 (55.0%) |
14 (63.6%) |
4 (50.0%) |
29 (58.0%) |
0.7516 |
|
Yes |
9 (45.0%) |
8 (36.4%) |
4 (50.0%) |
21 (42.0%) |
||
|
Peripheral vascular disease |
No |
11 (55.0%) |
9 (40.9%) |
2 (25.0%) |
22 (44.0%) |
0.3264 |
|
Yes |
9 (45.0%) |
13 (59.1%) |
6 (75.0%) |
28 (56.0%) |
Table 04: Association between MRI Severity Score and Severity Category
|
|
Category |
Mild n (%) |
Moderate n (%) |
Severe n (%) |
P value |
|
Soft tissue edema |
No |
16 (80.0%) |
10 (45.5%) |
3 (37.5%) |
0.0338 |
|
Yes |
4 (20.0%) |
12 (54.5%) |
5 (62.5%) |
||
|
Abscess |
No |
6 (30.0%) |
13 (59.1%) |
5 (62.5%) |
0.1134 |
|
Yes |
14 (70.0%) |
9 (40.9%) |
3 (37.5%) |
||
|
Sinus tract |
No |
13 (65.0%) |
15 (68.2%) |
4 (50.0%) |
0.6517 |
|
Yes |
7 (35.0%) |
7 (31.8%) |
4 (50.0%) |
Table 05: Association between Outcome and Severity Category
|
|
Category |
Mild n (%) |
Moderate n (%) |
Severe n (%) |
P value |
|
Osteomyelitis |
No |
10 (50.0%) |
10 (45.5%) |
4 (50.0%) |
0.9503 |
|
Yes |
10 (50.0%) |
12 (54.5%) |
4 (50.0%) |
||
|
Septic arthritis |
No |
9 (45.0%) |
12 (54.5%) |
4 (50.0%) |
0.8262 |
|
Yes |
11 (55.0%) |
10 (45.5%) |
4 (50.0%) |
||
|
Tenosynovitis |
No |
6 (30.0%) |
13 (59.1%) |
4 (50.0%) |
0.1628 |
|
Yes |
14 (70.0%) |
9 (40.9%) |
4 (50.0%) |
Table 06: Distribution of Important Continuous Variables According to Severity Category
|
|
Category |
Mild n (%) / Mean±SD |
Moderate |
Severe |
P value |
|
MRI severity score |
1–9 distribution |
— |
— |
— |
0.0393 |
|
Outcome |
Amputation |
10 (50.0%) |
2 (9.1%) |
3 (37.5%) |
0.0298 |
|
Healed |
3 (15.0%) |
10 (45.5%) |
1 (12.5%) |
||
|
Improved |
7 (35.0%) |
10 (45.5%) |
4 (50.0%) |
||
|
Age (years) |
Mean±SD |
56.85±10.97 |
62.18±8.88 |
52.25±10.40 |
0.0446 |
|
Ulcer duration |
Mean±SD |
28.10±12.65 |
32.23±15.19 |
42.75±12.35 |
0.049 |
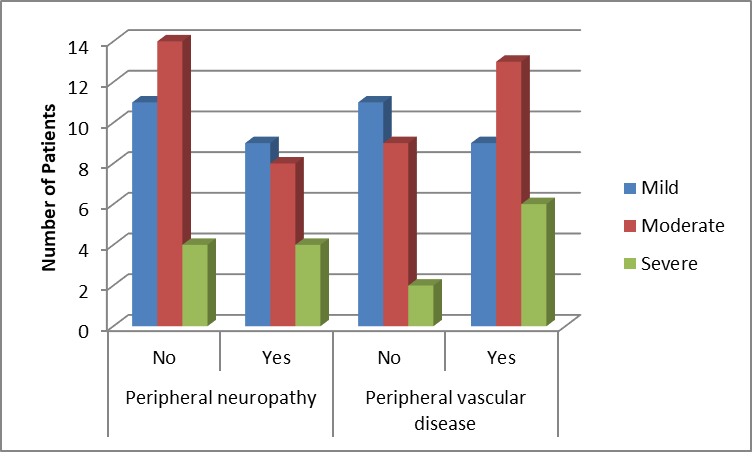
Figure 1: Association between Soft Tissue Edema (MRI Finding) and Severity Category
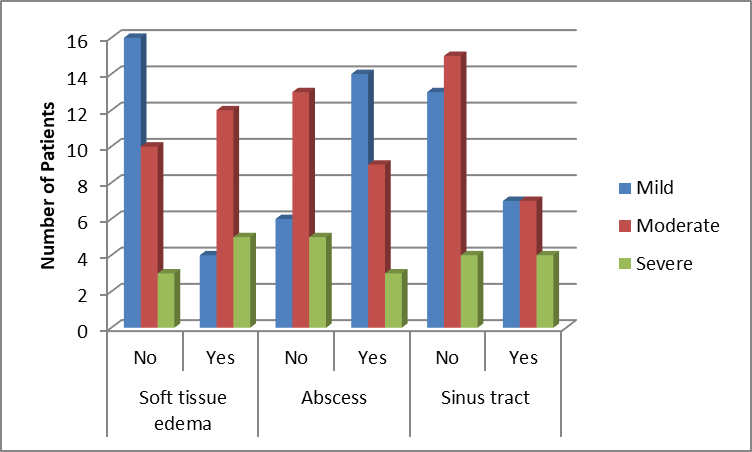
Figure 2: Association between MRI Severity Score and Severity Category
Association between Age, Diabetes Type and Severity Category
Result
There was no statistically significant association between age group and severity category (p = 0.1974). Although the 40–50 years age group had a higher proportion of severe cases (62.5%), other age groups such as 51–60 years (12.5%), 60–70 years (12.5%), and >71 years (12.5%) showed no consistent trend with severity. Diabetes type was also not significantly associated with severity (p = 0.3036), with Type 2 diabetes being predominant across all categories (mild: 85.0%, moderate: 95.5%, severe: 100.0%).
Interpretation
Age (p = 0.1974) and diabetes type (p = 0.3036) were not statistically significant predictors of severity, indicating that disease severity was independent of these demographic variables in the present study.
Association between Clinical Features and Severity Category
Result
Ulcer presence was not significantly associated with severity (p = 0.5736), with occurrence rates of 75.0% in mild, 86.4% in moderate, and 87.5% in severe cases. Fever also showed no significant association (p = 0.4091), although it increased with severity (35.0% in mild, 45.5% in moderate, and 62.5% in severe cases). Pus discharge was similarly not significant (p = 0.6693), with relatively uniform distribution across groups (55.0%, 54.5%, and 37.5% respectively).
Interpretation
Clinical features such as ulcer (p = 0.5736), fever (p = 0.4091), and pus discharge (p = 0.6693) were not significantly associated with severity, although a rising trend of inflammatory signs was observed in severe cases.
Association between MRI Findings and Severity Category
Result
Peripheral neuropathy was not significantly associated with severity (p = 0.7516), with similar proportions across mild (45.0%), moderate (36.4%), and severe (50.0%) groups. Peripheral vascular disease also showed no significant association (p = 0.3264), though higher prevalence was observed in severe cases (75.0%) compared to mild (45.0%) and moderate (59.1%) cases.
Interpretation
Neither peripheral neuropathy (p = 0.7516) nor peripheral vascular disease (p = 0.3264) showed statistical significance, although vascular disease demonstrated a trend toward increased severity.
Association between MRI Severity Features and Severity Category
Result
Soft tissue edema showed a statistically significant association with severity (p = 0.0338), being present in 20.0% of mild, 54.5% of moderate, and 62.5% of severe cases. Abscess formation was not significant (p = 0.1134), with distribution of 70.0% in mild, 40.9% in moderate, and 37.5% in severe cases. Sinus tract formation was also not significant (p = 0.6517), with occurrence rates of 35.0%, 31.8%, and 50.0% respectively.
Interpretation
Soft tissue edema (p = 0.0338) was significantly associated with increasing severity, indicating its importance as an imaging marker, while abscess (p = 0.1134) and sinus tract (p = 0.6517) were not significant predictors.
Association between Outcome Variables and Severity Category
Result
Osteomyelitis was not significantly associated with severity (p = 0.9503), with similar distribution across mild (50.0%), moderate (54.5%), and severe (50.0%) cases. Septic arthritis was also not significant (p = 0.8262), with occurrence rates of 55.0%, 45.5%, and 50.0% respectively. Tenosynovitis showed no significant association (p = 0.1628), although it was more frequent in mild cases (70.0%).
Interpretation
Osteomyelitis (p = 0.9503), septic arthritis (p = 0.8262), and tenosynovitis (p = 0.1628) were not significantly associated with severity, suggesting that complications were independent of severity category.
Distribution of Continuous Variables According to Severity Category
Result
MRI severity score showed a statistically significant association with severity category (p = 0.0393). Outcome distribution (amputation, healing, improvement) was also significant (p = 0.0298), with amputation observed in 50.0% of mild, 9.1% of moderate, and 37.5% of severe cases. Mean age differed significantly across groups (p = 0.0446), being highest in the moderate group (62.18 ± 8.88 years) compared to mild (56.85 ± 10.97) and severe (52.25 ± 10.40). Ulcer duration was also significantly associated with severity (p = 0.049), being highest in severe cases (42.75 ± 12.35 days).
Interpretatio
MRI severity score (p = 0.0393), outcome pattern (p = 0.0298), age (p = 0.0446), and ulcer duration (p = 0.049) were significantly associated with severity, indicating that imaging severity, chronicity, and clinical outcomes are important determinants of disease severity.
DISCUSSION:
The present study evaluated the association of demographic, clinical, and MRI-based parameters with severity category and clinical outcomes in the study population. Age and diabetes type were not significantly associated with severity (p = 0.1974 and p = 0.3036, respectively), suggesting that disease severity in the present cohort is not strongly influenced by basic demographic variables. Although older age and long-standing diabetes are traditionally considered risk factors for worse outcomes, several studies have demonstrated that severity of disease is more closely related to local tissue factors, infection extent, and vascular status rather than age or diabetes subtype alone [1].
Similar observations have been reported in diabetic foot literature where systemic variables show weak predictive value compared to local disease characteristics. Clinical features such as ulcer presence, fever, and pus discharge were not significantly associated with severity in this study. Although these features increased in frequency with worsening severity, they did not reach statistical significance. This finding suggests that clinical signs alone may not accurately reflect the true extent of underlying tissue involvement. Previous studies have highlighted that clinical examination often underestimates disease severity, particularly in chronic infections where deep tissue involvement may exist without prominent surface findings [2]. The progressive increase in inflammatory symptoms with severity observed in this study is consistent with the known pathophysiology of advancing infection, although variability limits their diagnostic precision [3,4].
Peripheral neuropathy and peripheral vascular disease did not show statistically significant association with severity category, although vascular disease demonstrated a rising trend with increasing severity. This aligns with existing evidence that neuropathy and vascular disease are important predisposing factors rather than direct determinants of severity grading once infection is established [5]. Peripheral arterial disease is widely recognized as a key contributor to poor healing and amputation risk, but its effect is often modulated by infection severity and tissue involvement rather than acting as an independent severity marker. MRI findings in the present study demonstrated that soft tissue edema was significantly associated with severity (p = 0.0338), whereas abscess formation and sinus tract formation were not. This highlights the importance of early MRI changes in reflecting disease progression. Soft tissue edema is considered one of the earliest and most sensitive imaging indicators of infection spread, often preceding abscess formation and cortical involvement [6].
In contrast, abscesses and sinus tracts generally represent more localized or chronic stages of disease and may not correlate linearly with severity classification systems. The findings reinforce the role of MRI as a superior modality for delineating early tissue involvement and guiding management decisions. Outcome variables such as osteomyelitis, septic arthritis, and tenosynovitis were not significantly associated with severity category in this study. This may reflect the overlapping nature of infectious complications across severity stages, where multiple structures may be involved irrespective of initial grading. Literature suggests that once deep infection is established, progression to bone and joint involvement is influenced more by duration of disease and host immunity rather than baseline severity category alone [7].
Hence, these complications may be better considered as outcome endpoints rather than stratifying variables [8]. Among continuous variables, MRI severity score showed a significant association with severity (p = 0.0393), supporting its role as a quantitative imaging marker of disease burden. Additionally, outcome distribution was significantly associated with severity (p = 0.0298), indicating that increasing severity is linked with poorer clinical outcomes, including higher amputation rates. Similar findings have been reported where higher imaging scores correlate strongly with adverse outcomes such as delayed healing and limb loss [9].
Mean age was significantly different across severity groups (p = 0.0446), with the highest mean observed in the moderate group. Although age alone was not a significant categorical predictor, its variation across groups may suggest an indirect influence on disease progression and recovery potential. Ulcer duration was also significantly associated with severity (p = 0.049), with longer duration observed in severe cases. This finding is consistent with established evidence that prolonged ulcer duration is a strong predictor of infection severity, delayed healing, and increased risk of complications, including amputation. Chronic ulcers provide a sustained inflammatory environment that facilitates deeper tissue invasion and microbial persistence [10].
Overall, the present study demonstrates that MRI-based parameters and disease chronicity are stronger determinants of severity and outcomes compared to demographic and basic clinical variables. These findings reinforce the growing evidence supporting the integration of imaging-based scoring systems into clinical decision-making frameworks for better risk stratification and management planning
CONCLUSION:
The present study demonstrates that disease severity is not significantly influenced by demographic factors such as age and diabetes type, nor by most clinical features including ulcer presence, fever, and pus discharge. However, MRI-based parameters, particularly soft tissue edema and overall MRI severity score, showed a significant association with disease severity, highlighting the superior role of imaging in accurate disease stratification. Additionally, longer ulcer duration and adverse outcome patterns such as amputation were significantly associated with higher severity, indicating that chronicity and imaging findings are important predictors of prognosis. Overall, the study concludes that MRI-based assessment combined with evaluation of disease duration provides a more reliable indicator of severity and clinical outcome compared to clinical and demographic variables alone, thereby supporting the integration of imaging-based scoring systems in routine evaluation and management planning.
REFERENCES:
1. Boulton AJ, Vileikyte L, Ragnarson-Tennvall G, Apelqvist J. The global burden of diabetic foot disease. The Lancet. 2005 Nov 12;366(9498):1719-24.
2. Llewellyn A, Kraft J, Holton C, Harden M, Simmonds M. Imaging for detection of osteomyelitis in people with diabetic foot ulcers: A systematic review and meta-analysis. European journal of radiology. 2020 Oct 1;131:109215.
3. Lipsky BA, Berendt AR, Deery HG, et al. Infectious Diseases Society of America Diagnosis and treatment of diabetic foot infections. Plast Reconstr Surg 2006;117(Suppl.):212S–238S
4. Schweitzer ME, Daffner RH, Weissman BN, et al. ACR Appropriateness Criteria on suspected osteomyelitis in patients with diabetes mellitus. J Am Coll Radiol 2008;5:881–886
5. Devillers A, Moisan A, Hennion F, Garin E, Poirier JY, Bourguet P. Contribution of technetium-99m hexamethylpropylene amine oxime labelled leucocyte scintigraphy to the diagnosis of diabetic foot infection. Eur J Nucl Med 1998;25:132–138
6. Palestro CJ, Torres MA. Radionuclide imaging in orthopedic infections. Semin Nucl Med 1997;27:334–345
7. Termaat MF, Raijmakers PG, Scholten HJ, Bakker FC, Patka P, Haarman HJ. The accuracy of diagnostic imaging for the assessment of chronic osteomyelitis: a systematic review and meta-analysis. J Bone Joint Surg Am 2005;87:2464–2471
8. Erdman WA, Tamburro F, Jayson HT, Weatherall PT, Ferry KB, Peshock RM. Osteomyelitis: characteristics and pitfalls of diagnosis with MR imaging. Radiology 1991;180:533–539
9. Heiba SI, Kolker D, Mocherla B, et al. The optimized evaluation of diabetic foot infection by dual isotope SPECT/CT imaging protocol. J Foot Ankle Surg 2010;49:529–536
10. Filippi L, Schillaci O. Usefulness of hybrid SPECT/CT in 99mTc-HMPAO-labeled leukocyte scintigraphy for bone and joint infections. J Nucl Med 2006;47:1908–1913
11. Armstrong DG, Boulton AJM, Bus SA. Diabetic foot ulcers and their recurrence. N Engl J Med. 2017;376(24):2367–2375.
12. Peterson N, Widnall J, Evans P, Jackson G, Platt S. Diagnostic imaging of diabetic foot disorders. Foot & Ankle International. 2017 Jan;38(1):86-95.
13. Hingorani A, et al. The management of diabetic foot: a clinical practice guideline. J Vasc Surg. 2016;63(2 Suppl):3S–21S.
14. Fridman R, Bar-David T, Kamen S, Staron RB, Leung DK, Rasiej MJ. Imaging of diabetic foot infections. Clinics in Podiatric Medicine and Surgery. 2014 Jan 1;31(1):43-56.
15. Lipsky BA. Diabetic foot infections: current treatment and delaying the ‘post‐antibiotic era’. Diabetes/metabolism research and reviews. 2016 Jan;32:246-53.
16. Van Netten JJ, Apelqvist J, Bus SA, Hinchliffe RJ, Lipsky BA, Schaper NC. New IWGDF Guidelines on Prevention and Management of Diabetic Foot Disease released. The Diabetic Foot Journal. 2020 Jan 1;23(1):6-9.
17. Omo-Okhuasuyi AE. Identification of Risk Factors Linked to Diabetic Foot Ulcers From Multimodal Datasets Using Machine Learning (Doctoral dissertation, The University of Texas at San Antonio).(2024).
18. Schaper NC, van Netten JJ, Apelqvist J, Bus SA, Hinchliffe RJ, Lipsky BA, IWGDF Editorial Board. Practical guidelines on the prevention and management of diabetic foot disease (IWGDF 2019 update). Diabetes/metabolism research and reviews. 2020 Mar;36:e3266.
19. Pauliukienė R, Šutienė K, Čemerkaitė A, Čeponis J. Predictors of Unfavorable Outcomes in Diabetic Foot Ulcers. Diagnostics. 2025 Dec 2;15(23):3070.
20. Lobmann R, Grünerbel A, Lawall H, Lüdemann C, Morbach S, Tigges W, Völkel L, Rychlik RP. Impact of wound duration on diabetic foot ulcer healing: evaluation of a new sucrose octasulfate wound dressing. Journal of Wound Care. 2020 Oct 2;29(10):543-51.