A STUDY ON PLATELET INDICES AND ITS PROGNOSTIC SIGNIFICANCE IN CRITICALLY ILL PATIENTS IN A TERTIARY CARE CENTRE
- Chandana Kaspa , Assistant Professor, Dept. of General Medicine, Nizam Institute of Medical Sciences, Punjagutta, Hyderabad, Telangana, India
- Shashidhar Yerraguntla , Assistant Professor, Dept. of General Medicine, Nizam Institute of Medical Sciences, Punjagutta, Hyderabad, Telangana, India.
- Chandra Naval , Professor, Dept. of General Medicine, Nizam Institute of Medical Sciences, Punjagutta, Hyderabad, Telangana, India
- Spoorthi Vanteru , Junior Resident, Dept. of General Medicine, Nizam Institute of Medical Sciences, Punjagutta, Hyderabad, Telangana, India.
Article Information:
Abstract:
Background: Platelets are involved in several important biological processes beyond hemostasis, including inflammation, endothelial function, thrombosis, and immune response. Platelet indices such as platelet count, mean platelet volume (MPV), platelet distribution width (PDW), and plateletcrit (PCT) are routinely reported as part of a complete blood count and can be obtained without additional cost. In critically ill patients, changes in these indices may reflect disease severity and clinical outcome. This study was undertaken to evaluate the prognostic relevance of platelet indices in relation to ICU outcome and APACHE II score. Methods: This cross-sectional study included 120 critically ill adult patients admitted to the Medical Intensive Care Unit of Nizam’s Institute of Medical Sciences, Hyderabad, over a 12-month period from June 2023 to May 2024. Patients aged above 18 years admitted with medical illnesses were included. Patients with active hemorrhage, known hematological disorders, recent chemotherapy or radiotherapy, bone marrow transplantation within the previous month, and pregnancy were excluded. Platelet count, MPV, PDW, PCT, and APACHE II scores were recorded for all enrolled patients. Data were analyzed using Pearson correlation, receiver operating characteristic curve analysis, and Mann–Whitney U test, as applicable. A p-value of less than 0.05 was considered statistically significant. Results: Among the 120 patients studied, 78 survived and 42 expired, giving an overall mortality rate of 35%. The mean age was lower among survivors than non-survivors, 56.09 years versus 61.2 years, respectively, and this difference was statistically significant (p < 0.05). Dyspnea was the most frequent presenting symptom (34.2%), followed by fever (26.7%) and altered sensorium (22.5%). Hypertension (36.7%) and diabetes mellitus (23.3%) were the commonest comorbidities. Sepsis was the leading cause of ICU admission (20%), followed by bronchopneumonia (15.8%). Non-survivors had a significantly lower median platelet count than survivors, 141,000/µL versus 257,500/µL (p < 0.005). PCT was also lower among non-survivors, 0.14% versus 0.21% (p = 0.001). In contrast, MPV and PDW were significantly higher in non-survivors compared with survivors, with MPV values of 9.22 fL versus 8.3 fL and PDW values of 18.05% versus 17.19%, respectively (p = 0.001 for both). ROC analysis showed good discriminatory ability for mortality prediction, with MPV showing the highest AUC of 0.801, followed by PDW at 0.783, platelet count at 0.768, and PCT at 0.728. The mean APACHE II score was also significantly higher in non-survivors than survivors, 20.62 versus 12.54 (p = 0.01). Conclusion: Platelet indices showed meaningful association with severity and outcome among critically ill patients. Lower platelet count and PCT, along with higher MPV and PDW, were observed among non-survivors. Among the studied parameters, MPV and PDW demonstrated good prognostic performance and may serve as useful supportive markers for early risk assessment in the ICU. Since these indices are simple, inexpensive, and routinely available, they may complement established severity scoring systems such as APACHE II in the evaluation of critically ill patients.
Keywords:
Article :
INTRODUCTION:
Platelets are small but functionally important blood elements that participate in several biological processes. Although their classical role is in hemostasis and coagulation, they are also actively involved in thrombosis, inflammation, endothelial protection, immune responses, and vascular homeostasis [1]. In routine hematology reports, platelet-related parameters such as platelet count, mean platelet volume (MPV), platelet distribution width (PDW), and plateletcrit (PCT) are readily available. These indices provide useful information about platelet number, size, volume distribution, and overall platelet mass. MPV represents the average size of circulating platelets and is expressed in femtoliters. It is influenced by platelet production and activation and is derived in relation to plateletcrit and platelet count [2]. PDW reflects the variation in platelet size, indicating anisocytosis among platelets, while PCT denotes the total platelet mass as a percentage of blood volume and is calculated using platelet count and MPV. In critically ill patients, platelet morphology and function may change considerably as part of systemic inflammation, endothelial injury, coagulation activation, and multiorgan dysfunction. Erez et al. reported that increased thrombin activity during critical illness can alter platelet shape, causing platelets to become larger, more spherical, and to develop pseudopodia [3]. These changes may increase variation in platelet size and lead to measurable alterations in platelet indices. Greater heterogeneity of platelet size has also been associated with hypercoagulable states and increased platelet activation [4]. Therefore, platelet indices may indirectly reflect the intensity of inflammatory and thrombotic processes occurring in critically ill patients.
Critical illness is usually characterized by severe physiological instability and a high risk of short-term mortality. Patients admitted to the intensive care unit often require continuous monitoring of cardiovascular, respiratory, renal, neurological, and hematological functions. In this setting, simple laboratory markers that can help in early assessment of disease severity are clinically valuable. Thrombocytopenia has already been recognized as an independent predictor of poor outcome in ICU patients [5]. Similarly, the Acute Physiology and Chronic Health Evaluation II (APACHE II) score considers abnormalities in physiological and laboratory parameters for estimating severity and mortality risk, and platelet-related changes have been shown to carry prognostic relevance in critically ill populations [6]. Alterations in platelet indices have been described in several clinical conditions, including colorectal carcinoma, spontaneous bacterial peritonitis in patients with ascites, and neonatal sepsis [5–8]. These observations suggest that platelet parameters may act as accessible markers of disease activity, systemic inflammation, and prognosis across diverse clinical settings [9]. In intensive care practice, where repeated assessment is often required, such routinely available parameters may be useful as supportive indicators along with clinical evaluation and established scoring systems.
Several critical care scoring systems, including the Sequential Organ Failure Assessment (SOFA) score and the Multiple Organ Dysfunction Score (MODS), incorporate hematological variables such as platelet count, leukocyte count, and hematocrit. However, platelet indices such as MPV, PDW, and PCT are not always given equal attention in routine prognostic assessment. Recent studies have suggested that these indices may reflect platelet activation and may be associated with disease severity and outcome in critically ill patients [10,11]. Increased MPV, in particular, is considered a marker of larger and more reactive platelets, which may indicate enhanced thrombotic tendency and inflammatory activation. Higher MPV and PDW values have been linked with adverse outcomes in various ICU populations. In countries with limited healthcare resources, including India, platelet indices may have practical importance because they are inexpensive, rapidly available, and generated automatically as part of a complete blood count [11]. Unlike advanced biomarkers, they do not require additional equipment, special assays, or extra financial burden for the patient. This makes them suitable for repeated monitoring in critically ill patients, especially in busy tertiary care settings. Considering these factors, the present study was undertaken to evaluate platelet indices, namely platelet count, MPV, PDW, and PCT, as potential prognostic markers among critically ill patients admitted to a tertiary care ICU. The study also aimed to assess the relationship between these indices and patient outcome and to correlate them with the APACHE II score. By doing so, the study explores whether platelet indices can serve as simple, accessible, and supportive markers for severity assessment and early risk stratification in critically ill patients.
METHODOLOGY:
Study Design
This was a cross-sectional observational study conducted among critically ill patients admitted to the Medical Intensive Care Unit. The study was planned to assess platelet indices at the time of ICU admission and to examine their relationship with disease severity and prognosis using the APACHE II score.
Sampling Method
A purposive sampling method was followed for the selection of study participants. Patients who fulfilled the eligibility criteria during the study period were included after obtaining informed consent. Data were collected through direct clinical observation, review of clinical records, physical examination, and relevant laboratory investigations.
Study Duration and Setting
The study was conducted over a period of 12 months, from June 2023 to May 2024. It was carried out in the Medical Intensive Care Unit of Nizam’s Institute of Medical Sciences, Hyderabad, India. The study population included adult patients admitted to the MICU with various medical illnesses requiring intensive care management.
Sample Size
The sample size was calculated based on earlier published literature, particularly the study by Samuel T. et al. [12], which reported a correlation coefficient of r = –0.265 between platelet count and APACHE II score. Considering this effect size, with 90% power, 5% type I error, and 95% confidence interval, the required sample size was estimated using an online sample size calculator for correlation studies. Based on this calculation, 120 patients were required for the study. Accordingly, a total of 120 eligible patients admitted to the MICU were enrolled.
Inclusion and Exclusion Criteria
Patients were included in the study if they were above 18 years of age and admitted to the ICU with any medical illness. Patients were excluded if they had active hemorrhage at the time of presentation, known hematological disorders, or a history of radiotherapy, chemotherapy, or bone marrow transplantation within one month prior to admission. Pregnant women were also excluded from the study to avoid physiological variations in platelet parameters and disease severity assessment.
Ethical Considerations
All eligible patients or their legally acceptable representatives were informed about the purpose, procedures, and nature of the study before enrollment. Written informed consent was obtained prior to inclusion. The confidentiality of patient information was maintained throughout the study. Each participant underwent detailed clinical history taking, physical examination, and necessary laboratory evaluation as part of routine ICU assessment and study documentation.
Data Collection and Coding
Clinical and laboratory data were collected systematically for all enrolled patients. Platelet indices, including platelet count, mean platelet volume, platelet distribution width, and plateletcrit, were recorded along with the APACHE II score. The collected raw data were entered into Microsoft Excel and coded appropriately for tabulation and statistical analysis. Variables were categorized using suitable codes and symbols to allow easy identification, comparison, and processing during analysis.
Statistical Analysis
The APACHE II score was calculated using MDCalc. The collected data were analyzed using IBM SPSS Statistics software version 20.0. Qualitative variables were expressed as frequencies and percentages, while quantitative variables were summarized using mean, standard deviation, median, and range, as appropriate. Pearson correlation was used to assess the relationship between platelet indices and APACHE II score. For variables that did not follow a normal distribution and were expressed as median with interquartile range, comparison between groups was performed using the Mann–Whitney U test. A p-value of less than 0.05 was considered statistically significant.
RESULTS:
Study Population and Overall Outcome
A total of 120 critically ill patients admitted to the intensive care unit were included in the final analysis. Among them, 78 patients survived and 42 patients expired during the course of ICU management. Thus, the overall survival rate was 65%, while the mortality rate was 35% (Table 1). This indicates that nearly one-third of the study population had an unfavorable outcome, reflecting the severity of illness among the patients admitted to the ICU.
Table 1: Demographic and Outcome Profile of the Study Population
|
Variable |
Total patients, n (%) |
Survivors, n (%) |
Non-survivors, n (%) |
Statistical value |
p-value |
|
Total patients |
120 (100.0) |
78 (65.0) |
42 (35.0) |
- |
- |
|
Mean age, years |
57.88 |
56.09 |
61.20 |
- |
<0.05 |
|
Male |
80 (66.67) |
48 (60.0) |
32 (40.0) |
χ² = 2.637 |
>0.05 |
|
Female |
40 (33.33) |
30 (75.0) |
10 (25.0) |
χ² = 2.637 |
>0.05 |
|
Age group 20–40 years |
22 (18.33) |
19 (86.36) |
3 (13.64) |
- |
- |
|
Age group 61–80 years |
44 (36.67) |
26 (59.09) |
18 (40.91) |
- |
- |
Percentages for sex-specific survival are calculated within each sex category
Age Distribution and Survival Pattern
The mean age of the overall study population was 57.88 years. When patients were analyzed according to outcome, survivors had a lower mean age of 56.09 years, whereas non-survivors had a higher mean age of 61.2 years. This difference was statistically significant (p < 0.05), suggesting that increasing age was associated with a poorer outcome in critically ill patients.
Age-wise survival analysis showed that patients in the younger age group had better outcomes. The highest survival rate was observed among patients aged 20–40 years, where 86.36% survived. In contrast, the lowest survival rate was noted in the 61–80 year age group, where only 59.09% survived. These findings suggest that elderly patients admitted to the ICU had a relatively higher risk of mortality compared with younger patients.
Gender Distribution and Outcome
Male patients were more commonly represented in the study population as well as in both outcome groups. Although male predominance was observed, females had a better survival proportion compared with males. The survival rate among females was 75.0%, while it was 60.0% among males. However, this difference was not statistically significant (χ² = 2.637, p > 0.05). Therefore, gender did not appear to have a significant influence on survival in the present study.
Presenting Symptoms
Dyspnea was the most frequent presenting complaint, observed in 34.17% of patients. Fever was the second most common symptom, reported in 26.67% of cases, followed by altered sensorium in 22.50%. These findings indicate that respiratory distress, systemic infection or inflammation, and neurological impairment were common reasons for ICU admission.
Other presenting symptoms included vomiting in 11.67%, cough in 10.83%, and abdominal pain in 8.33% of patients. Poisoning and hemiparesis were each seen in 7.50% of cases. Swelling of lower limbs and decreased urine output were each reported in 6.67% of patients, while jaundice was present in 5.0%. Less frequent symptoms included chest pain, seizures, and burning micturition, each accounting for 2.5% of cases (Table 2; Figure 2). Since some patients had more than one symptom at admission, the symptom profile reflects the mixed medical nature of ICU admissions.
Table 2: Presenting Symptoms Among Critically Ill Patients
|
Presenting symptom |
Number of patients |
Percentage (%) |
|
Dyspnea |
41 |
34.17 |
|
Fever |
32 |
26.67 |
|
Altered sensorium |
27 |
22.50 |
|
Vomiting |
14 |
11.67 |
|
Cough |
13 |
10.83 |
|
Abdominal pain |
10 |
8.33 |
|
Poisoning |
9 |
7.50 |
|
Hemiparesis |
9 |
7.50 |
|
Swelling of lower limbs |
8 |
6.67 |
|
Decreased urine output |
8 |
6.67 |
|
Jaundice |
6 |
5.00 |
|
Chest pain |
3 |
2.50 |
|
Seizures |
3 |
2.50 |
|
Burning micturition |
3 |
2.50 |
Multiple symptoms were present in some patients; therefore, the total percentage exceeds 100%
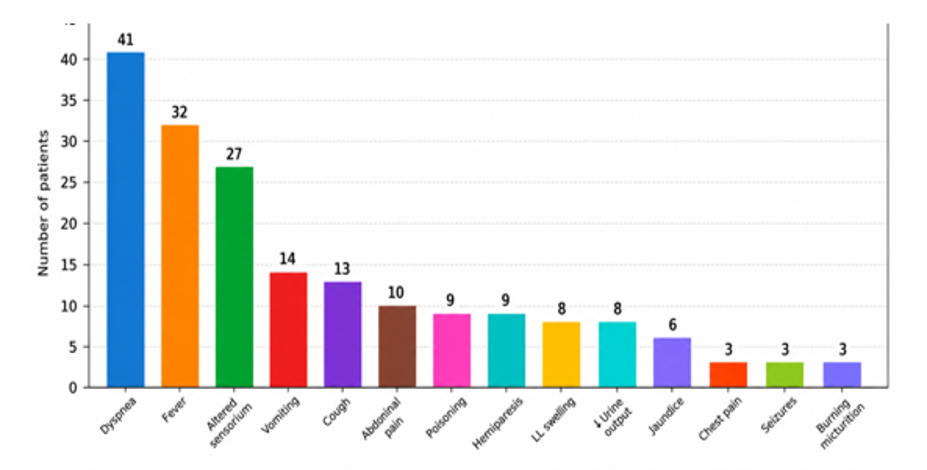
Figure 1: Presenting symptoms among the patients
Comorbid Illnesses
Hypertension was the most common comorbidity in the study population and was present in 36.66% of patients. Its distribution was almost similar among survivors and non-survivors, suggesting that hypertension alone did not show a clear association with mortality in this cohort (Table 3).
Diabetes mellitus was the second most common comorbidity, observed in 23.33% of patients. It was slightly more frequent among non-survivors, indicating a possible contribution of diabetes-related metabolic instability, infection risk, and vascular complications to poor outcomes. Coronary artery disease was present in 8.33% of patients, while cerebrovascular accidents were documented in 7.5%. Although these conditions were less frequent, they were relatively more common among non-survivors, suggesting that pre-existing cardiovascular and neurological disease may adversely affect ICU prognosis.
Table 3: Distribution of Comorbidities
|
Comorbidity |
Number of patients |
Percentage (%) |
Observation |
|
Hypertension |
44 |
36.66 |
Most common comorbidity; similar distribution among survivors and non-survivors |
|
Diabetes mellitus |
28 |
23.33 |
Slightly more frequent among non-survivors |
|
Coronary artery disease |
10 |
8.33 |
More frequent among non-survivors |
|
Cerebrovascular accident |
9 |
7.50 |
More frequent among non-survivors |
Primary Diagnosis at ICU Admission
Sepsis was the leading cause of ICU admission and accounted for 20% of cases. Bronchopneumonia was the next most common diagnosis, seen in 15.83% of patients. Cerebrovascular accidents accounted for 15.0%, while acute heart failure was present in 13.33% of cases. These four conditions formed the major diagnostic burden in the study population.
Encephalopathy, pancreatitis, and poisoning were each seen in 7.5% of patients. Chronic liver disease and pyelonephritis were less frequent, each accounting for 4.17% of cases. Acute kidney injury was present in 2.5%, acute liver failure in 1.67%, and meningitis in 0.83% of patients (Table 4) . Overall, infectious, respiratory, cardiovascular, neurological, and metabolic conditions were the major contributors to ICU admission.
Table 4: Primary Diagnosis at ICU Admission
|
Diagnosis |
Number of patients |
Percentage (%) |
|
Sepsis |
24 |
20.00 |
|
Bronchopneumonia |
19 |
15.83 |
|
Cerebrovascular accident |
18 |
15.00 |
|
Acute heart failure |
16 |
13.33 |
|
Encephalopathy |
9 |
7.50 |
|
Pancreatitis |
9 |
7.50 |
|
Poisoning |
9 |
7.50 |
|
Chronic liver disease |
5 |
4.17 |
|
Pyelonephritis |
5 |
4.17 |
|
Acute kidney injury |
3 |
2.50 |
|
Acute liver failure |
2 |
1.67 |
|
Meningitis |
1 |
0.83 |
ICU Stay and Neurological Status
The duration of ICU stay differed significantly between survivors and non-survivors. Survivors had a longer mean ICU stay of 13.73 ± 5.37 days, whereas non-survivors had a shorter mean stay of 11.14 ± 4.27 days. This difference was statistically significant (p = 0.008). The shorter ICU stay among non-survivors may reflect more severe illness and rapid clinical deterioration, while the longer stay among survivors may indicate the time required for stabilization and recovery.
Figure 2 shows the overall outcome distribution of the critically ill patients admitted to the ICU. Out of 120 patients included in the study, 78 patients survived, accounting for 65.0% of the study population, while 42 patients expired, corresponding to a mortality rate of 35.0%. The figure highlights that nearly one-third of the ICU patients had an unfavorable outcome, reflecting the severity of illness in the study cohort.
Neurological status, assessed using the Glasgow Coma Scale, also showed a significant difference between the two groups. Survivors had a higher mean GCS score of 13.68 ± 2.42, while non-survivors had a lower mean score of 9.86 ± 4.72. This difference was statistically significant (p = 0.001). The finding suggests that reduced consciousness or impaired neurological status at presentation was associated with higher mortality.
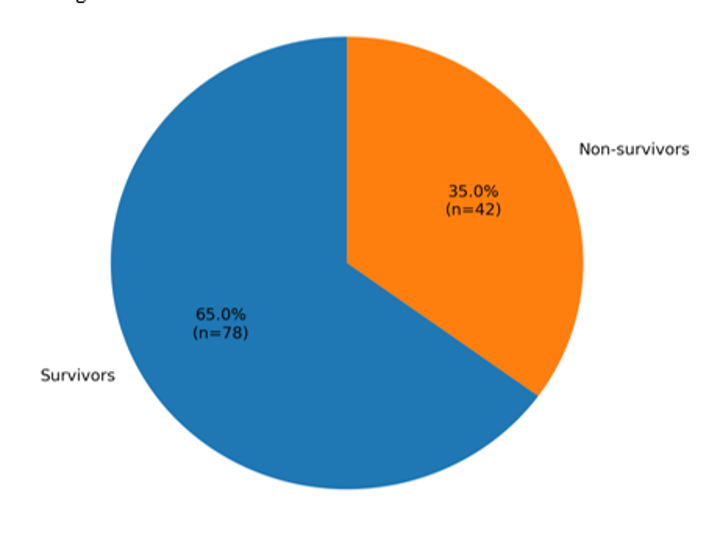
Figure 2: ICU outcome distribution
Renal Function Parameters
Renal function markers were significantly worse among non-survivors. Median blood urea was 88.0 mg/dL among non-survivors, with an interquartile range of 39.0–125.25 mg/dL. In comparison, survivors had a lower median blood urea level of 46.0 mg/dL, with an interquartile range of 25.0–85.5 mg/dL. This difference was statistically significant (p = 0.002).
Serum creatinine was also higher among non-survivors. The median serum creatinine level was 2.05 mg/dL in non-survivors, compared with 1.28 mg/dL in survivors. The corresponding interquartile ranges were 1.20–3.73 mg/dL and 0.78–3.10 mg/dL, respectively. This difference was statistically significant (p = 0.039). These findings indicate that renal dysfunction was more common or more severe among patients who did not survive.
Liver Function Parameters
Among the liver function parameters, AST showed a significant association with outcome. Non-survivors had a higher median AST level of 60.0 U/L, with an interquartile range of 33.75–91.25 U/L. Survivors had a lower median AST value of 39.0 U/L, with an interquartile range of 23.5–69.25 U/L. The difference was statistically significant (p = 0.031) (Table 5).
Other liver function parameters, including ALT, ALP, total bilirubin, and conjugated bilirubin, were also higher among non-survivors. However, these differences did not reach statistical significance. This suggests that while liver involvement was more prominent among non-survivors, AST was the only liver-related parameter that showed a statistically significant difference in the present analysis.
Table 5: Clinical and Laboratory Parameters According to Outcome
|
Parameter |
Survivors |
Non-survivors |
p-value |
|
ICU stay, days |
13.73 ± 5.37 |
11.14 ± 4.27 |
0.008 |
|
GCS score |
13.68 ± 2.42 |
9.86 ± 4.72 |
0.001 |
|
Blood urea, mg/dL |
46.0 (25.0–85.5) |
88.0 (39.0–125.25) |
0.002 |
|
Serum creatinine, mg/dL |
1.28 (0.78–3.10) |
2.05 (1.20–3.73) |
0.039 |
|
AST, U/L |
39.0 (23.5–69.25) |
60.0 (33.75–91.25) |
0.031 |
|
ALT, U/L |
Higher in non-survivors |
Higher in non-survivors |
>0.05 |
|
ALP, U/L |
Higher in non-survivors |
Higher in non-survivors |
>0.05 |
|
Total bilirubin |
Higher in non-survivors |
Higher in non-survivors |
>0.05 |
|
Conjugated bilirubin |
Higher in non-survivors |
Higher in non-survivors |
>0.05 |
Values are expressed as mean ± SD or median with interquartile range, as appropriate. GCS: Glasgow Coma Scale; AST: aspartate aminotransferase; ALT: alanine aminotransferase; ALP: alkaline phosphatase.
Platelet Count and Platelet Indices
Platelet count showed a significant difference between survivors and non-survivors. Survivors had a higher median platelet count of 257,500/µL, with an interquartile range of 178,250–334,250/µL. In contrast, non-survivors had a much lower median platelet count of 141,000/µL, with an interquartile range of 77,500–197,750/µL. This difference was statistically significant (p < 0.005). The finding indicates that thrombocytopenia or reduced platelet count was associated with poor outcome in critically ill patients (Table 6; Figure 3).
Mean platelet volume was higher among non-survivors compared with survivors. Non-survivors had a mean MPV of 9.22 ± 0.21 fL, whereas survivors had a mean MPV of 8.3 ± 0.85 fL. The difference was statistically significant (p = 0.001). Similarly, PDW was higher in non-survivors, with a mean value of 18.05 ± 0.98%, compared with 17.19 ± 2.61% among survivors (p = 0.001). These findings suggest increased platelet activation and greater variation in platelet size among patients with poor outcomes.
Table 6: Platelet Parameters According to Outcome
|
Platelet parameter |
Survivors |
Non-survivors |
p-value |
|
Platelet count, /µL |
257,500 (178,250–334,250) |
141,000 (77,500–197,750) |
<0.005 |
|
Mean platelet volume, fL |
8.30 ± 0.85 |
9.22 ± 0.21 |
0.001 |
|
Platelet distribution width, % |
17.19 ± 2.61 |
18.05 ± 0.98 |
0.001 |
|
Plateletcrit, % |
0.21 ± 0.09 |
0.14 ± 0.09 |
0.001 |
Values are expressed as mean ± SD or median with interquartile range, as appropriate. MPV and PDW were significantly higher among non-survivors, whereas platelet count and plateletcrit were significantly lower.
Plateletcrit showed an opposite pattern. It was lower among non-survivors, with a mean value of 0.14 ± 0.09%, compared with 0.21 ± 0.09% among survivors. This difference was also statistically significant (p = 0.001). Overall, non-survivors showed lower platelet count and plateletcrit, along with higher MPV and PDW.
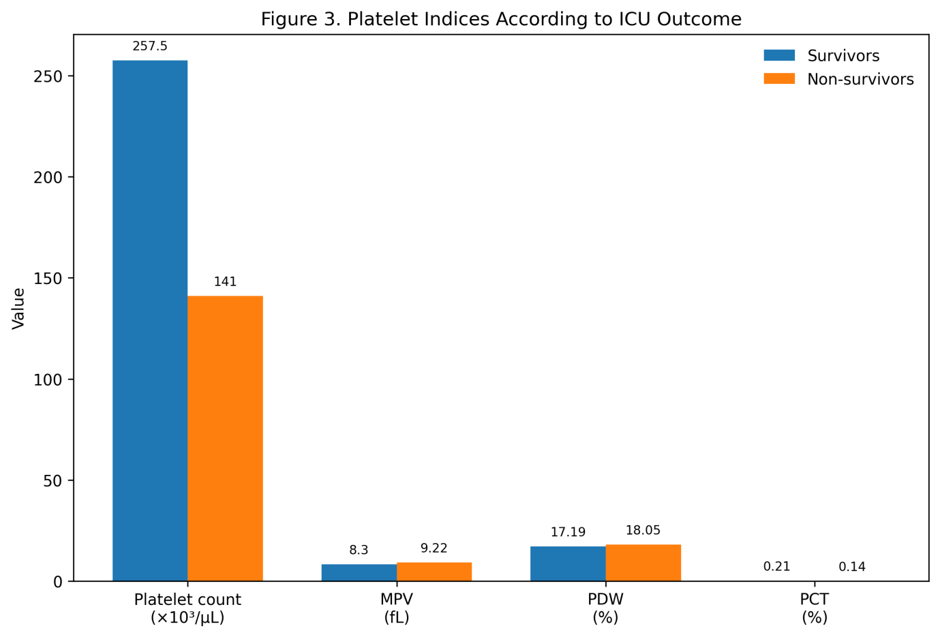
Figure 3: Platelet Indices according to ICU outcome.
ROC Analysis of Platelet Indices
Receiver operating characteristic curve analysis was performed to assess the ability of platelet indices to predict mortality. Platelet count showed good discriminatory ability, with a cut-off value of ≤180,000/µL. At this threshold, the area under the curve was 0.768, with sensitivity of 71.4% and specificity of 74.4% (p < 0.0001) (Table 7).
MPV showed the highest predictive performance among the platelet indices. An MPV cut-off of >8.7 fL yielded an AUC of 0.801, with sensitivity of 73.8% and specificity of 73.1% (p < 0.0001). PDW also showed good predictive value, with a cut-off of >17.5%. The AUC for PDW was 0.783, with sensitivity of 73.8% and specificity of 71.8% (p < 0.0001).
Table 7: ROC Analysis of Platelet Indices for Mortality Prediction
|
Parameter |
Cut-off value |
AUC |
Sensitivity (%) |
Specificity (%) |
p-value |
|
Platelet count |
≤180,000/µL |
0.768 |
71.4 |
74.4 |
<0.0001 |
|
MPV |
>8.7 fL |
0.801 |
73.8 |
73.1 |
<0.0001 |
|
PDW |
>17.5% |
0.783 |
73.8 |
71.8 |
<0.0001 |
|
Plateletcrit |
≤0.17% |
0.728 |
76.2 |
69.2 |
<0.0001 |
AUC: area under the receiver operating characteristic curve; MPV: mean platelet volume; PDW: platelet distribution width Plateletcrit showed moderate discriminatory ability. A cut-off value of ≤0.17% produced an AUC of 0.728, with sensitivity of 76.2% and specificity of 69.2% (p < 0.0001). Among all platelet indices, MPV demonstrated the best overall predictive accuracy, followed by PDW, platelet count, and plateletcrit (Figure 4).
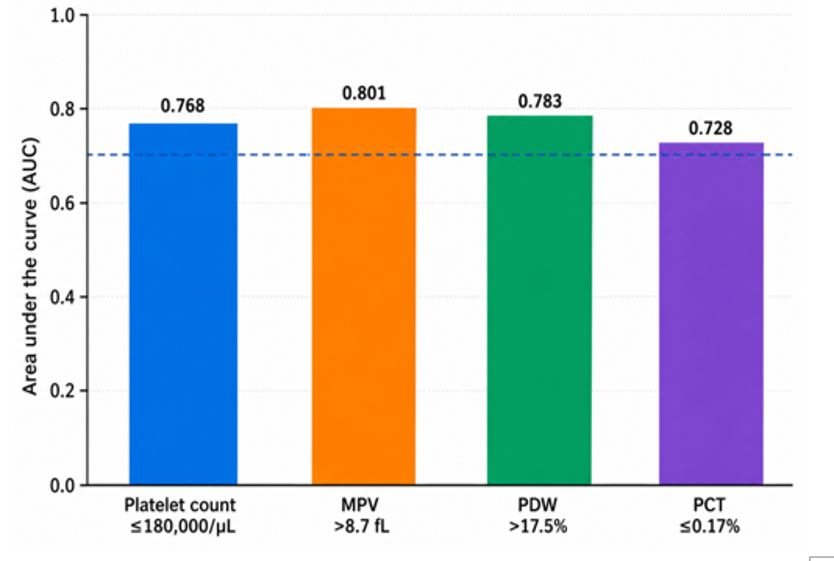
Figure 4: ROC performance of platelet indices for mortality prediction
APACHE II Score and Outcome
The APACHE II score was significantly higher among non-survivors than survivors. Non-survivors had a mean APACHE II score of 20.62 ± 6.47, whereas survivors had a lower mean score of 12.54 ± 5.75. The difference was statistically significant (p = 0.01) (Figure 5). This confirms that patients with higher physiological severity scores had a greater risk of mortality.
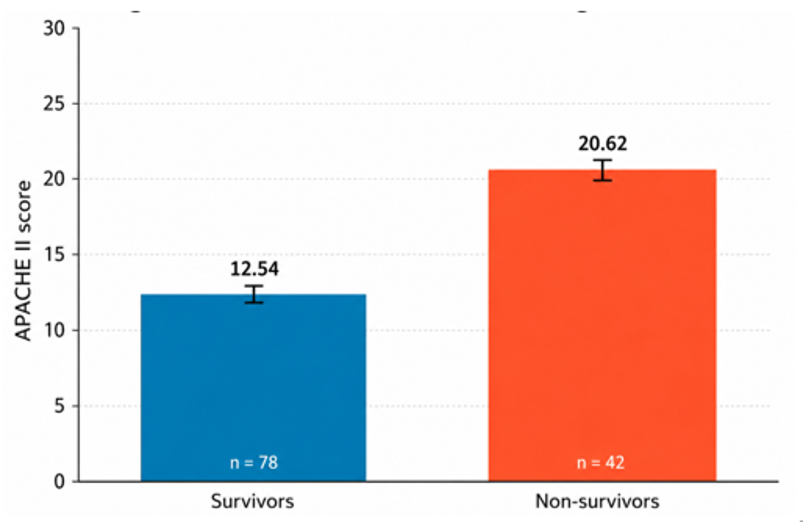
Figure 5: APACHE II Score according to outcome
Correlation of Platelet Indices with APACHE II Score
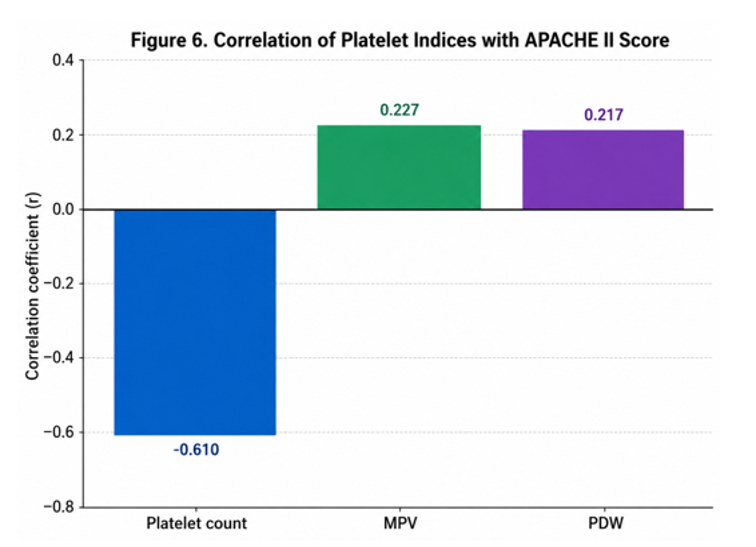
Correlation analysis was performed to assess the relationship between platelet indices and APACHE II score. Platelet count showed a moderate negative correlation with APACHE II score (r = –0.61), indicating that platelet count tended to decrease as disease severity increased. However, this correlation was not statistically significant (p > 0.05) (Table 8; Figure 6).
MPV showed a significant positive correlation with APACHE II score (r = 0.227, p < 0.05), suggesting that higher MPV values were associated with greater disease severity. PDW also showed a significant positive correlation with APACHE II score (r = 0.217, p < 0.05). Plateletcrit did not show a significant correlation with APACHE II score. These findings suggest that MPV and PDW may be more useful than plateletcrit for reflecting severity of illness in critically ill patients.
Table 8: Correlation of Platelet Indices with APACHE II Score
|
Parameter |
Correlation coefficient, r |
Direction of correlation |
p-value |
Interpretation |
|
Platelet count |
–0.61 |
Negative |
>0.05 |
Moderate negative correlation, statistically not significant |
|
MPV |
0.227 |
Positive |
<0.05 |
Significant positive correlation |
|
PDW |
0.217 |
Positive |
<0.05 |
Significant positive correlation |
|
Plateletcrit |
Not significant |
No clear correlation |
>0.05 |
No significant association |
APACHE II: Acute Physiology and Chronic Health Evaluation II
DISCUSSION:
The present study evaluated the prognostic significance of platelet indices in critically ill patients admitted to a tertiary care intensive care unit. Platelet count, mean platelet volume (MPV), platelet distribution width (PDW), and plateletcrit were assessed in relation to patient outcome and APACHE II score. Since platelets are closely involved in inflammation, endothelial injury, thrombosis, immune response, and microvascular dysfunction, changes in platelet indices may reflect the biological severity of critical illness.
In this study, 120 critically ill patients were analyzed, of whom 78 survived and 42 expired, giving an overall mortality rate of 35%. Age showed a clear association with outcome. Patients in the 20–40 year age group had the highest survival rate of 86.36%, whereas those aged 61–80 years had the lowest survival rate of 59.09%. The mean age of survivors was 56.09 years, while non-survivors had a higher mean age of 61.2 years, and this difference was statistically significant. This finding supports the view that advancing age is an important determinant of mortality in ICU patients. Similar observations were reported by Salluh et al. [13], who found that mortality increases with age among critically ill patients admitted to intensive care units.
Although males were more commonly represented in both survivor and non-survivor groups, females showed a relatively higher survival rate than males, 75.0% versus 60.0%. However, this difference was not statistically significant. This indicates that sex alone may not be an independent predictor of ICU outcome in the present cohort. The overall prognosis in critically ill patients appears to be influenced more by age, disease severity, organ dysfunction, and comorbid illness than by gender alone.
Dyspnea was the most common presenting symptom in this study, seen in 34.2% of patients, followed by fever in 26.7% and altered sensorium in 22.5%. These symptoms are commonly encountered in critically ill patients and often indicate respiratory compromise, systemic infection, metabolic derangement, or neurological involvement. Xu et al. [14] also reported respiratory distress as an important predictor of mortality in critically ill patients, particularly among those with underlying pulmonary disease. Fever was another frequent complaint and was often suggestive of infection or systemic inflammation. Vincent et al. [15] emphasized that fever and sepsis-related inflammatory responses require early recognition and appropriate management to improve outcomes. Altered sensorium was also an important clinical feature in the present study. It may occur due to sepsis, hypoxia, metabolic abnormalities, stroke, or drug-related causes. Pandharipande et al. [16] showed that delirium and prolonged changes in mental status in ICU patients are associated with adverse outcomes, including increased mortality and long-term cognitive impairment.
Comorbidities are important contributors to prognosis in critically ill patients. In the present study, hypertension was the most common comorbidity, seen in 36.66% of patients, followed by diabetes mellitus in 23.33%. Hypertension was distributed almost equally among survivors and non-survivors, although its complications may contribute to poor outcomes in certain patients [17]. Diabetes mellitus was slightly more frequent among non-survivors. Diabetes is known to increase susceptibility to infection, impair wound healing, aggravate metabolic instability, and contribute to vascular complications, all of which can worsen the course of critical illness [18]. Coronary artery disease and cerebrovascular accidents were less common overall, but they were more frequently observed among non-survivors. Gupta et al. [19] reported that critically ill patients with coronary artery disease have a higher risk of mortality. Similarly, patients with previous or acute cerebrovascular events often have poorer outcomes because of associated neurological impairment and coexisting conditions such as diabetes and hypertension [20].
The mean ICU stay was significantly longer among survivors than non-survivors. Survivors stayed in the ICU for a mean duration of 13.73 ± 5.37 days, compared with 11.14 ± 4.27 days among non-survivors. Although longer ICU stay may appear to indicate greater morbidity, in this context it may also reflect survival long enough to receive sustained intensive care and gradual clinical recovery. Similar findings were observed among trauma patients in Northwestern Tanzania, where survivors had longer ICU stay compared with non-survivors [21]. Studies involving critically ill COVID-19 patients have also shown that shorter ICU stay among non-survivors often reflects rapid deterioration and early death [22].
Neurological status was another important prognostic factor in the present study. Survivors had a significantly higher mean Glasgow Coma Scale score of 13.68 compared with 9.86 among non-survivors. Lower GCS scores suggest impaired consciousness and may reflect severe systemic illness, hypoxia, sepsis-associated encephalopathy, metabolic disturbances, or structural neurological disease. Rahimi et al. [23] also reported that reduced GCS is strongly associated with poor outcome in critically ill patients. These findings highlight the need for close neurological monitoring in ICU patients, particularly those presenting with altered sensorium.
Renal function parameters were significantly deranged among non-survivors. Median blood urea was 88.0 mg/dL in non-survivors compared with 46.0 mg/dL in survivors. Similarly, serum creatinine was higher among non-survivors, with a median value of 2.05 mg/dL compared with 1.28 mg/dL among survivors. These findings indicate that renal dysfunction or acute kidney injury may contribute substantially to ICU mortality. Rahimi et al. [23] similarly reported elevated urea and creatinine levels as important predictors of mortality in critically ill patients. In addition, AST was significantly higher among non-survivors, suggesting that hepatic injury or systemic hypoperfusion may also be linked with poor prognosis.
Platelet count showed a strong association with mortality in the present study. Survivors had a significantly higher median platelet count of 257,500/µL compared with 141,000/µL among non-survivors. A platelet count cut-off of ≤180,000/µL predicted mortality with a sensitivity of 71.4% and specificity of 74.4%. This finding supports the role of thrombocytopenia as a marker of poor prognosis in critically ill patients. Zhang et al. [24] reported that a platelet count below 169,000/µL was associated with mortality, with a sensitivity of 60.1% and specificity of 91.2%. Choi et al. [25] observed that thrombocytopenia predicted mortality in pediatric septic shock. Patki et al. [26] found that a fall in platelet count of more than 30% was associated with higher mortality risk in critically ill children. Burunsuzoglu et al. [27] also reported increased mortality among septic shock patients with platelet counts below 150,000/µL. These studies support the present finding that platelet depletion may reflect severe inflammation, sepsis, disseminated coagulation activation, marrow suppression, or increased peripheral consumption.
MPV was significantly higher among non-survivors compared with survivors. The mean MPV was 9.22 ± 0.82 fL in non-survivors and 8.3 ± 0.85 fL in survivors. ROC analysis showed that MPV had the highest predictive accuracy among the platelet indices, with an AUC of 0.801. A cut-off value of >8.7 fL predicted mortality with 73.8% sensitivity and 73.1% specificity. Elevated MPV reflects the presence of larger and more reactive platelets, which are metabolically and enzymatically more active. Such platelets may indicate accelerated platelet turnover, inflammation, and thrombotic tendency. Zampieri et al. [28] observed that rising MPV during the first 24 hours of ICU admission independently predicted mortality. Zhang et al. [24] also found MPV to be useful in predicting mortality, while Gao et al. [29] reported that higher MPV was associated with mortality in septic shock. Chan et al. [30] further demonstrated that an increase in MPV over 72 hours independently predicted 28-day mortality in severe sepsis and septic shock. These findings are consistent with the present study and suggest that MPV is a useful prognostic marker in critical illness.
PDW was also significantly higher among non-survivors. The mean PDW was 18.05 ± 0.98% in non-survivors compared with 17.19 ± 2.61% among survivors. A PDW cut-off of >17.5% predicted mortality with 73.8% sensitivity and 71.8% specificity. Increased PDW indicates greater variation in platelet size and may reflect platelet activation, anisocytosis, and inflammatory stress. Guclu et al. [31] reported that PDW >17.9% predicted mortality in patients with severe sepsis. Zhang et al. [24] also found higher PDW among non-survivors, with a cut-off of >16.1% showing prognostic significance. The present findings agree with these reports and suggest that PDW may be useful in identifying patients with greater disease severity.
Plateletcrit was significantly lower among non-survivors than survivors. Non-survivors had a mean plateletcrit of 0.14 ± 0.09%, whereas survivors had a value of 0.21 ± 0.09%. A plateletcrit value of ≤0.17% predicted mortality with 76.2% sensitivity and 69.2% specificity. Plateletcrit reflects total platelet mass in circulation and is influenced by both platelet count and platelet size. A low plateletcrit in critically ill patients may indicate reduced platelet production, increased platelet consumption, or both. Zhang et al. [24] reported that plateletcrit below 0.18% was associated with mortality. Golwala et al. [32] also observed lower plateletcrit values among non-survivors in pediatric ICU patients. These findings suggest that plateletcrit may provide additional prognostic information, although it may be less robust than MPV and PDW.
ROC analysis in the present study confirmed the prognostic utility of platelet indices. MPV showed the highest AUC of 0.801, followed by PDW at 0.783, platelet count at 0.768, and plateletcrit at 0.728. All four parameters showed statistically significant discriminatory ability for mortality prediction. These findings indicate that platelet indices, especially MPV and PDW, may help in early risk assessment among ICU patients. Similar conclusions were reported by Zhang et al. [33], who found elevated MPV to be a strong predictor of mortality. Wang et al. [34] also demonstrated the prognostic value of PDW, while Vanderschueren et al. [35] highlighted the association between thrombocytopenia and increased mortality in critically ill patients.
The mean APACHE II score was significantly higher in non-survivors than survivors, 20.62 ± 6.47 versus 12.54 ± 5.75. This confirms the well-established role of APACHE II as a severity assessment tool in ICU practice. Kalichsztein et al. [36] reported a strong association between higher APACHE II scores and mortality, with excellent predictive accuracy. In the present study, MPV and PDW showed significant positive correlations with APACHE II score. MPV correlated positively with APACHE II score with an r value of 0.227, while PDW showed a positive correlation with an r value of 0.217. This indicates that increasing MPV and PDW values may parallel increasing physiological severity.
Platelet count showed a moderate negative correlation with APACHE II score, although it was not statistically significant. Plateletcrit also did not show a meaningful correlation with APACHE II. Samuel et al. [37] reported comparable findings using APACHE IV, where MPV and PDW correlated positively with severity, while platelet count and plateletcrit showed negative correlations. Zhang et al. [24] also reported that higher APACHE II scores were associated with higher MPV and PDW and lower platelet count and plateletcrit. The present findings therefore support the role of MPV and PDW as markers of disease severity. The lack of significant correlation for platelet count and plateletcrit in this study may be due to differences in patient characteristics, timing of sample collection, underlying diagnosis, treatment received before ICU admission, and heterogeneity in mechanisms of platelet consumption or production.
Overall, this study shows that platelet indices are clinically useful, inexpensive, and easily available markers that can support prognostic assessment in critically ill patients. MPV and PDW appear to be more consistently associated with severity and mortality than platelet count and plateletcrit. However, these indices should not be interpreted in isolation. Their value is likely greatest when used along with clinical examination, organ dysfunction markers, and validated severity scores such as APACHE II. Larger prospective multicenter studies may help define stronger cut-off values and clarify whether serial changes in platelet indices improve prognostic accuracy.
CONCLUSION:
The present study showed that platelet indices have useful prognostic value in critically ill patients admitted to the intensive care unit. Among 120 patients, the overall mortality rate was 35%. Non-survivors were older and had significantly higher APACHE II scores, lower GCS scores, and greater biochemical evidence of organ dysfunction, including elevated blood urea, serum creatinine, and AST levels.
Platelet indices differed significantly between survivors and non-survivors. Non-survivors had lower platelet count and plateletcrit, along with higher MPV and PDW. These changes suggest increased platelet activation, altered platelet morphology, and platelet consumption in severe critical illness. ROC analysis showed that MPV, PDW, platelet count, and plateletcrit had good discriminatory ability for mortality prediction, with MPV showing the highest predictive performance.
MPV and PDW also showed significant positive correlation with APACHE II score, indicating that these indices may reflect increasing disease severity. Since platelet indices are inexpensive, routinely available, and rapidly generated as part of a complete blood count, they can serve as practical supportive markers in ICU risk stratification. When used along with established severity scores and clinical judgment, they may help in identifying high-risk patients early and guiding closer monitoring and timely intervention.
REFERENCES:
1. Golebiewska EM, Poole AW. Platelet secretion: from haemostasis to wound healing and beyond. Blood Rev. 2015;29:153-162.
2. Zhang Z, Ni H, Deng H. Platelet indices are novel predictors of hospital mortality in intensive care unit patients. J Crit Care. 2014;29:85-88.
3. Erez O, Romero R, Hoppensteadt D, et al. Premature labor: a state of platelet activation? J Perinat Med 2008;36(5):377–387.
4. Ulucan Ş, Keser A, Kaya Z, et al. Association between PDW and long term major adverse cardiac events in patients with acute coronary syndrome. Heart Lung Circ 2016;25(1):29-34.
5. Catal F, Tayman C, Tonbul A, et al. Mean platelet volume (MPV) may simply predict the severity of sepsis in preterm infants. Clin Lab. 2014;60:1193-1200.
6. Akavipat PTJ, Thikhamrop B, Sriraj W. Acute physiology and chronic health evaluation (APACHE) Il score - the clinical predictor in neurosurgical intensive care unit. Acta Clin Croat. 2019;58:50-55.
7. Li XT, Yan Z, Wang RT, Yu KJ. Preoperative mean platelet volume and platelet distribution width predict postoperative sepsis in patients with colorectal cancer. Biomed Res Int. 2019;2019:17-32.
8. Abdel-Razik A, Eldars W, Rizk E. Platelet indices and inflammatory markers as diagnostic predictors for ascitic fluid infection. Eur J Gastroenterol Hepatol. 2014;26:1342-1347.
9. Budak YU, Polat M, Huysal K. The use of platelet indices, plateletcrit, mean platelet volume and platelet distribution width in emergency non-traumatic abdominal surgery: a systematic review. Biochem Med. 2016;26:178-193.
10. Yoo H, Ku SK, Kim SW, Bae JS. Early diagnosis of sepsis using serum hemoglobin subunit Beta. Inflammation 2015;38:394-9.
11. Demirin H, Ozhan H, Ucgun T, Celer A, Bulur S, Cil H, et al. Normal range of mean platelet volume in healthy subjects: insight from a large epidemiologic study. Thromb Res. 2011;128:358–60. 10.1016/j.thromres.2011.05.007.
12. Samuel D, Bhat AN, Prabhu VM. Platelet Indices as Predictive Markers of Prognosis in Critically Ill Patients: A Prospective Study. Indian J Crit Care Med 2020;24(9):817–822.
13. Al Saleh K, AlQahtani RM. Platelet count patterns and patient outcomes in sepsis at a tertiary care center. Medicine (Baltimore) 2021;100(18):e25013.
14. Xu J, Chen C, Yang T, et al. Association of sex with clinical outcome in critically ill sepsis patients: a retrospective analysis of the large clinical database MIMIC-III. Shock. 2019.
15. Vincent JL, Marshall JC, Namendys-Silva SA, et al. Frequency and mortality of septic shock in Europe and North America: a systematic review and meta-analysis. Crit Care. 2019.
16. Pandharipande PP, Girard TD, Jackson JC, Morandi A, Thompson JL, Pun BT, et al. Long-term cognitive impairment after critical illness. N Engl J Med 2013;369(14):1306–16.
17. Critical Care Medicine, 2021. Hypertension in the ICU: Implications and Management.
18. Diabetes Care, 2021. Diabetes Mellitus and ICU Outcomes: A Comprehensive Review.
19. Gupta S, Hayek SS, Wang W, et al. Factors Associated With Death in Critically Ill Patients With Coronavirus Disease 2019 in the US. JAMA Intern Med. 2020;180(11):1436–1447.
20. Zampieri FG, Colombari F. The impact of performance status and comorbidities on the short-term prognosis of very elderly patients admitted to the ICU. BMC anesthesiology. 2014 Jul 22;14(1):59.
21. Chalya PL, Gilyoma JM, Dass RM, Mchembe MD, Matasha M, Mabula JB, Mbelenge N, Mahalu W. Trauma admissions to the intensive care unit at a reference hospital in Northwestern Tanzania. Scandinavian journal of trauma, resuscitation and emergency medicine. 2011 Oct 24;19(1):61.
22. Hazard D, Kaier K, von Cube M, Grodd M, Bugiera L, Lambert J, et al. Joint analysis of duration of ventilation, length of intensive care, and mortality of COVID-19 patients: a multistate approach. BMC Med Res Methodol 2020;20(1):206.
23. Rahimi S, Ahmadinejad M, Mohammadi S, et al. Clinical and laboratory parameters as predictors of mortality in patients with chronic liver disease presenting to emergency department. Int J Emerg Med. 2023.
24. Zhang S, Cui YL, Diao MY, Chen DC, Lin ZF. Use of Platelet Indices for Determining Illness Severity and Predicting Prognosis in Critically Ill Patients.Chin Med J 2015;128:2012-18.
25. Choi S J, Ha E, Jhang W K, Jong Park S. Platelet Indices as Predictive Markers of Prognosis in Pediatric Septic Shock Patients.Inn J Pediatr.2017;27(3):e7212.https://doi.org/10.5812/ijp.7212.
26. Patki VK, Birru FV, Patki VV. Decline in platelet count as a prognostic marker in critically ill children. Journal of Pediatric Critical Care. 1. 13-21. 10.
27. Burunsuzoglu B, Salturk C, Karakurt Z, Ongel EA, Takır HB, Kargın F et al. A Risk Factor of Mortality for Patients with Sepsis in the Intensive Care Unit. Turk Thorac J. 2015;17(1):7-14.
28. Zampieri FG, Ranzani OT, Sabatoski V, de Souza HP, Barbeiro H, da Neto LMC, et al. An increase in mean platelet volume after admission is associated with higher mortality in critically ill patients. Ann Intensive Care 2014;4:20.
29. Gao L, Zhang H, Zhang B, Zhang L, Wang C: Prognostic value of combination of preoperative platelet count and mean platelet volume in patients with resectable non-small cell lung cancer. Oncotarget 2017; 8: 15632-15641.
30. Chan Ho Kim, Seung Jun Kim, Mi Jung Lee, Young Eun Kwon, Yung Ly Kim, Kyoung Sook Park, et al. An increase in mean platelet volume from baseline is associated with mortality in patients with severe sepsis or septic shock. 2015 .PloS one.e0119437.
31. Guclu E, Durmaz Y, Karabay O. Effect of severe sepsis on platelet count and their indices. Afr Health Sci. 2013;13:333-338.
32. Golwala ZM, Shah H, Gupta N, Sreenivas V, PuliyelJM. Mean Platelet Volume (MPV), Platelet Distribution Width (PDW), Platelet count and Plateletcrit (PCT) as predictors of in hospital paediatric mortality: A Case –Control Study.Afri Health Sci 2016;16(2): 356-362.
33. Zhang, Z., Xu, X., Ni, H., & Deng, H. (2014). “The predictive value of mean platelet volume on mortality in critically ill patients: a systematic review and meta-analysis.” Critical Care, 18(6), 1-8.
34. Wang, Y., Zhang, S., Li, L., & Xie, J. (2017). “The prognostic value of platelet distribution width in critically ill patients: a systematic review and meta-analysis.” Journal of Critical Care, 37, 21-26.
35. Vanderschueren, S., De Weerdt, A., Malbrain, M., Vankersschaever, D., Frans, E., Wilmer, A., & Bobbaers, H. (2000). “Thrombocytopenia and prognosis in intensive care.” Critical Care Medicine, 28(6), 1871-1876.
36. Kalichsztein M, Nobre G, Kezen J, Braga F, Kurtz P, Penna G, et al. Using outcome prediction tools in the ICU: performance of APACHE II and SAPS 2 scores in clinical patients. Crit Care 2006;10(1):P407.
37. Samuel D, Bhat AN, Prabhu VM. Platelet Indices as Predictive Markers of Prognosis in Critically Ill Patients: A Prospective Study. Indian J Crit Care Med 2020;24(9):817–822.