ASSOCIATION BETWEEN ABDOMINAL OBESITY INDICES (VISCERAL ADIPOSITY AND NECK CIRCUMFERENCE) AND DIABETIC COMPLICATIONS
- Anchin Kalia , Professor & Unit Head, Department of General Medicine, Mahatma Gandhi Medical College and Hospital, Jaipur (Raj.)
- Devendrasinh Chorya , Junior Resident, Department of General Medicine, Mahatma Gandhi Medical College and Hospital, Jaipur (Raj.)
- Dr. Puneet Rijhwani , Professor & Head, Department of General Medicine, Mahatma Gandhi Medical College and Hospital, Jaipur (Raj.)
- Deepak Gupta , Professor & Unit Head, Department of General Medicine, Mahatma Gandhi Medical College and Hospital, Jaipur (Raj.)
- Pradeep Agarwal , Professor & Unit Head, Department of General Medicine, Mahatma Gandhi Medical College and Hospital, Jaipur (Raj.)
- Abhinav Mahindru , Junior Resident, Department of General Medicine, Mahatma Gandhi Medical College and Hospital, Jaipur (Raj)
Article Information:
Abstract:
Background: Obesity has emerged as one of the most significant and rapidly growing public health challenges globally with profound implications for the development and progression of type 2 diabetes mellitus (T2DM) and its associated chronic complications. AIM: To determine the Association between abdominal obesity indices and diabetic complications by visceral adiposity index and neck circumference. METHODOLOGY: This is a hospital based Observational study conducted at Department of General Medicine, Mahatma Gandhi Medical College & Hospital, Jaipur from April 2024 to September 2025 for a duration of 18 months .RESULT: The present study demonstrated a high prevalence of abdominal obesity and diabetic complications among patients with type 2 diabetes mellitus, with coronary artery disease and peripheral artery disease being the most common complications. Neck circumference and visceral adiposity index showed significant associations with several microvascular and macrovascular complication. CONCLUSION: Assessment of abdominal obesity indices aid in early identification and risk stratification of patients prone to microvascular and macrovascular complications
Keywords:
Article :
INTRODUCTION:
Obesity is a rapidly growing public health challenge globally which leads to the development and progression of type 2 diabetes mellitus (T2DM) and its associated chronic complications.1 The prevalence of both obesity and diabetes represent economic and clinical burdens on healthcare systems worldwide. The conventional anthropometric measures such as body mass index(BMI) have traditionally been used as the primary indicators of obesity-related health risks . But now due to its strategic location in the abdominal cavity adjacent to vital organs including the liver, pancreas and intestines, VAI plays an active role in systemic metabolism and inflammation. The heightened metabolic activity of VAT, combined with its anatomical placement to major metabolic organs, makes it a potent contributor to the pathogenesis of insulin resistance, which serves as the fundamental underlying mechanism linking abdominal obesity to the development and progression of type 2 diabetes mellitus. Due to inadequacy of BMI as a comprehensive indicator of metabolic risk 2,3, the velocity index (VAI) has gained considerable importance as a non-invasive, easily practical marker of visceral adipose tissue dysfunction and metabolic derangement. Despite the simplicity and ease of measurement requiring only a flexible tape measure and less than one minute of clinical time - neck circumference has demonstrated significant predictive value for insulin resistance, metabolic syndrome and various components of cardio metabolic dysfunction4. Recent evidence suggests that neck circumference may reflect not only localized upper-body fat accumulation but also serve as an indicator of systemic visceral adiposity, making it a practical screening tool particularly suitable for use in primary healthcare settings and population-based epidemiological studies.Multiple population-based cohort studies and cross-sectional investigations have demonstrated that individuals with larger neck circumference exhibit substantially elevated risk of developing insulin resistance, metabolic syndrome, gestational diabetes mellitus and type 2 diabetes mellitus compared to those with normal neck circumference values.The association between abdominal obesity indices, mainly VAI and NC and the development of diabetic complications has emerged as a critical area of clinical investigation.5,6 Furthermore, evidence suggests that both VAI and NC are associated with increased risk of diabetic retinopathy.The clinical significance of incorporating abdominal obesity indices into the comprehensive metabolic assessment and risk stratification of diabetic patients lies in their potential to identify high-risk individuals early in the disease course, before the manifestation of over clinical complications, thereby enabling targeted preventive interventions7. Given that VAI and NC can be determined rapidly, inexpensive and non-invasively in routine clinical practice, integration of these indices into diabetes screening protocols and therapeutic monitoring strategies represents a practical and evidence-based approach to enhancing the precision of risk assessment .Understanding the complex relationship between abdominal adiposity indices and diabetic complications is therefore essential for clinical practice, which enables clinicians to identify vulnerable patients and implement timely, targeted interventions aimed at preventing or delaying the onset of serious diabetic complications and improving long-term health outcomes in the expanding global diabetic population.
AIM
To determine the Association between abdominal obesity indices and diabetic complications by visceral adiposity index and neck circumference.
METHODOLOGY :
This is a hospital based Observational study conducted at Department of General Medicine, Mahatma Gandhi Medical College & Hospital, Jaipur from April 2024 to September 2025 for a duration of 18 months . 110 patients will be enrolled who are eligible in inclusion criteria. Obese (BMI > 25 kg/m2) men and women from 18 to 65 years of age,With T2DM diagnosed and being treated at MGMC included in the study.Exclusion done any Patients with other chronic diseases like malignancy and severe infection (including type 1 diabetes) and Users of drugs that directly modify body composition like steroids or taking hormonal or nutritional supplementation Patients with low weight (BMI < 18 kg/m2), patients.
RESULTS:
Table 1: Demographic distribution
|
Age Group |
No. |
Percentage |
|
31-40 |
13 |
11.82% |
|
41-50 |
25 |
22.73% |
|
51-60 |
39 |
35.45% |
|
>60 |
33 |
30.00% |
|
Male |
61 |
55.5% |
|
Female |
49 |
44.5% |
The age-wise distribution of study participants shows that the majority of patients were concentrated in the middle-aged group. The highest proportion of subjects belonged to the 51-60 years age group (35.45%), followed by the >60 years group (30%), 41-50 years age group (22.73%). A smaller proportion was observed in patients 31-40 years (11.82%). Out of the total 110 patients, 61 (55.5%) were males, while 49 (44.5%) were females. This shows that males constituted a higher proportion compared to females in the study population.
Table 2: Mean Anthropometric Parameters
|
Anthropometric Parameters |
N |
Mean ± SD |
Median (IQR) |
Min-Max |
|
Height (cm) |
110 |
163.37±8.42 |
162.38 (156.78- 169.38) |
148.34- 187.47 |
|
Weight (kg) |
110 |
86.25±11.81 |
84.41 (77.64-95.53) |
60.00- 120.32 |
|
BMI (kg/m²) |
110 |
32.50±4.98 |
31.76 (28.68-35.60) |
25.00-49.11 |
|
Waist circumference (cm) |
110 |
93.20±10.90 |
93.4 (84.2-100.3) |
70.0-119.7 |
|
Hip circumference (cm) |
110 |
106.40±9.80 |
106.1 (100.2-112.7) |
85.0-130.0 |
|
Waist-hip ratio (WHR) |
110 |
0.89±0.14 |
0.87 (0.79-0.98) |
0.58-1.24 |
|
Neck circumference (cm) |
110 |
36.00±3.70 |
35.9 (33.7-38.3) |
28.0-46.1 |
The analysis of anthropometric parameters in the study population reveals a predominance of overweight and obese individuals. The mean height of participants was 163.37 ± 8.42 cm, while the mean body weight was 86.25 ± 11.81 kg, indicating relatively high body mass among the subjects. The mean Body Mass Index (BMI) was 32.50 ± 4.98 kg/m², which falls in the obese category, highlighting a significant burden of obesity in the study group. Waist circumference and hip circumference had mean values of 93.20 ± 10.90 cm and 106.40 ± 9.80 cm respectively, suggesting central obesity. The mean waist-hip ratio (WHR) of 0.89 ± 0.14 further supports the presence of abdominal fat distribution. Neck circumference averaged 36.00 ± 3.70 cm, indicating increased upper body adiposity.
Table 3: Prevalence of Type-2 diabetes-related complications (N=110)
|
Diabetic Complications |
No. (n=110) |
Percentage |
|
Diabetic Nephropathy |
40 |
36.4% |
|
Diabetic Neuropathy |
41 |
37.3% |
|
Coronary Artery Disease |
67 |
60.9% |
|
Cerebrovascular Disease |
46 |
41.8% |
|
Diabetic Foot Ulcer |
30 |
27.3% |
|
Peripheral Artery Disease |
63 |
57.3% |
The distribution of diabetic complications among the study population demonstrates a high burden of both microvascular and macrovascular complications. Coronary artery disease was the most prevalent complication, affecting 60.9% of patients, followed by peripheral artery disease in 57.3% of cases, indicating a significant burden of macrovascular involvement. Cerebrovascular disease was present in 41.8%, reflecting substantial neurological and vascular complications. Diabetic neuropathy and nephropathy were also common, affecting 37.3% and 36.4% of patients respectively. Diabetic foot ulcer was the least common complication, seen in 27.3% of cases.
Table 4a: VIA and NC of all Male participants by diabetic complications (DN, D. Neuropathy, CAD)
|
|
DN |
D Neuropathy |
CAD |
||||||
|
|
Absent |
Present |
P value |
Absent |
Present |
P value |
Absent |
Present |
P value |
|
VAI |
2.96±1.50 |
2.48±1.44 |
0.246 |
2.37±1.30 |
3.58±1.53 |
<0.001 |
3.09±1.67 |
2.51±1.29 |
<0.001 |
|
NC |
37.59±2.77 |
38.73±3.66 |
<0.001
|
38.27± 3.08 |
37.63±3.44 |
<0.001 |
37.08± 2.86 |
38.84±3.25 |
0.012 |
Table 4a shows the comparison of general characteristics among male participants with and without diabetic complications, namely diabetic nephropathy (DN), diabetic neuropathy and coronary artery disease (CAD). The sample included 36 DN− and 25 DN+ participants, 41 without and 20 with diabetic neuropathy and 27 CAD− and 34 CAD+ individuals. Neck circumference was significantly higher in DN+ and CAD+ participants. VAI was significantly elevated in neuropathy+ individuals, suggesting increased metabolic risk.
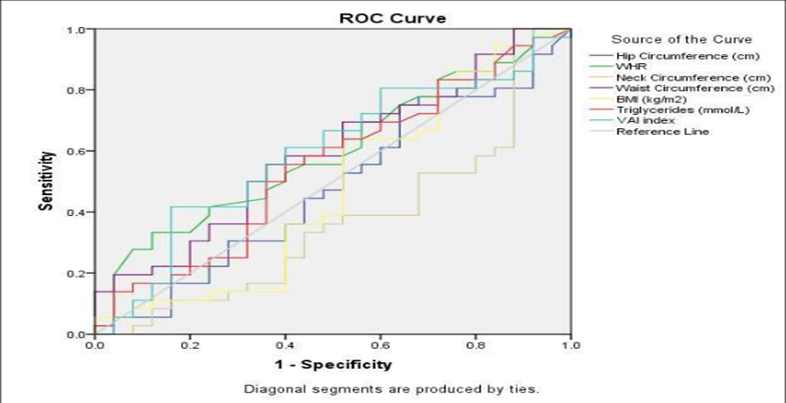
Visceral obesity indices for Diabetic Nephropathy in Male
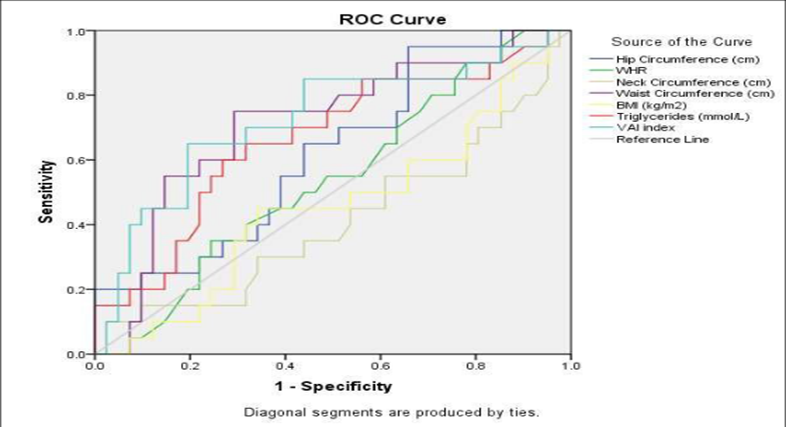
Visceral obesity indices for Diabetic Neuropathy in Male
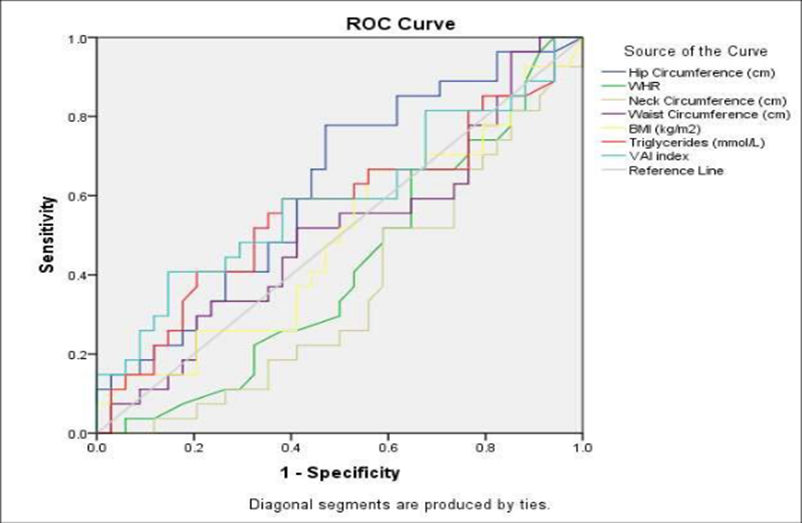
Visceral obesity indices for CAD in Male
Table 4b: VIA and NC of all Male participants by diabetic complications (CVD, DFU, PAD)
|
|
CVD |
DFU |
PAD |
||||||
|
|
Absent |
Present |
P value |
Absent |
Present |
P value |
Absent |
Present |
P value |
|
VAI |
2.97±1.53 |
2.45±1.38 |
0.024 |
2.65± 1.47 |
3.06±1.50 |
<0.001 |
2.55± 1.36 |
2.99± 1.59 |
0.031 |
|
NC |
37.71±3.36 |
38.60±2.87 |
0.016 |
38.31±3.11 |
37.40±3.37 |
<0.001
|
38.69±3.27 |
37.40±3.01 |
<0.001 |
Table 4b presents the comparison of general characteristics among male participants with and without cardiovascular disease (CVD), diabetic foot ulcer (DFU) and peripheral artery disease (PAD). The study included 37 CVD− and 24 CVD+ participants, 44 DFU− and 17 DFU+ individuals and 31 PAD− and 30 PAD+ cases. Neck circumference was significantly higher in CVD+ individuals but lower in DFU+ and PAD+ groups. VAI was significantly lower in CVD+ but higher in DFU+ and PAD+ groups, indicating differential metabolic risk patterns.
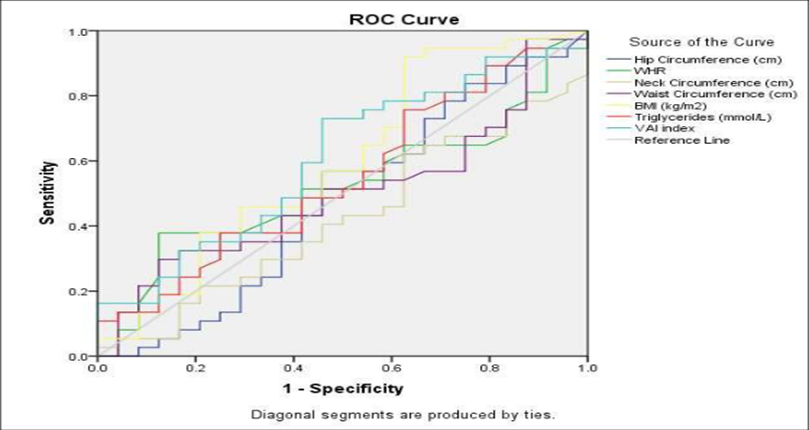 Visceral obesity indices for CVD in Male
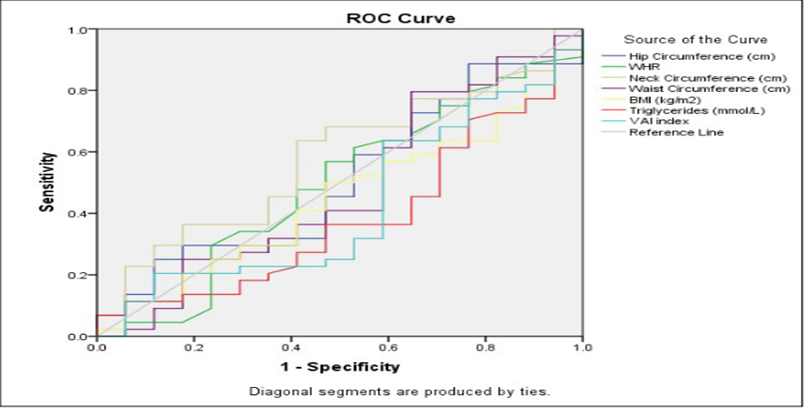
Visceral obesity indices for Diabetic Foot Ulcer in Male
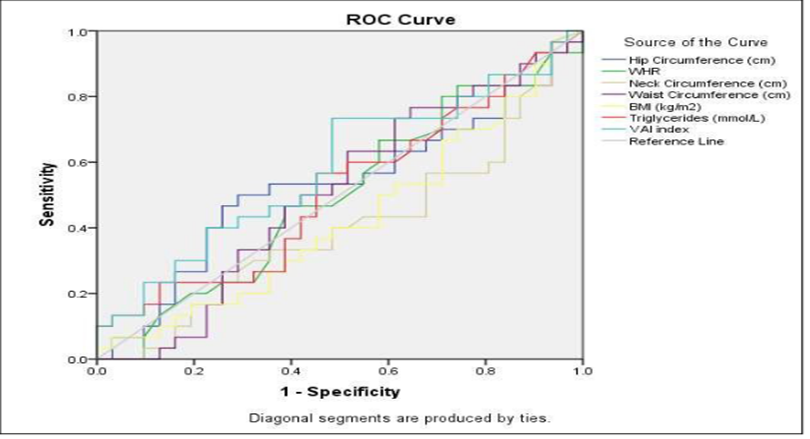
Visceral obesity indices for Peripheral Artery Disease in Male DIABETIC
Table 5b: VIA and NC of all Female participants by diabetic complications (CVD, DFU, PAD)
|
|
CVD |
DFU |
PAD |
||||||
|
|
Absent |
Present |
P value |
Absent |
Present |
P value |
Absent |
Present |
P value |
|
VAI |
3.51±2.48 |
4.00±2.89 |
<0.001 |
3.99 ± 2.92 |
3.01 ± 1.61 |
0.091 |
3.75 ± 2.50 |
3.72 ± 2.76 |
0.098 |
|
NC |
32.85±1.98 |
33.97±2.85 |
<0.001 |
33.51 ± 2.63 |
32.91 ± 1.88 |
<0.001
|
33.01 ± 2.36 |
33.51 ± 2.52 |
0.092 |
Table 5b compares the general characteristics of female participants with and without cardiovascular disease (CVD), diabetic foot ulcer (DFU) and peripheral artery disease (PAD). The number of participants was comparable across groups with slightly higher PAD+ cases.Neck circumference was significantly higher in CVD+ but lower in DFU+ participants, while showing minimal variation in PAD groups. VAI was increased in CVD+ but showed no consistent significant variation in DFU and PAD group.
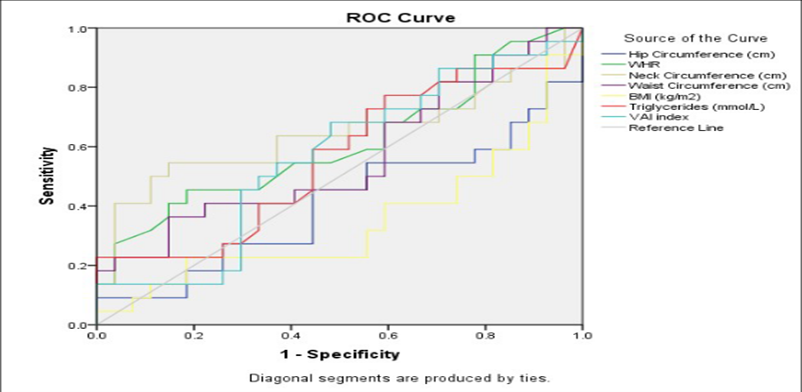
Visceral obesity indices for CVD in Female
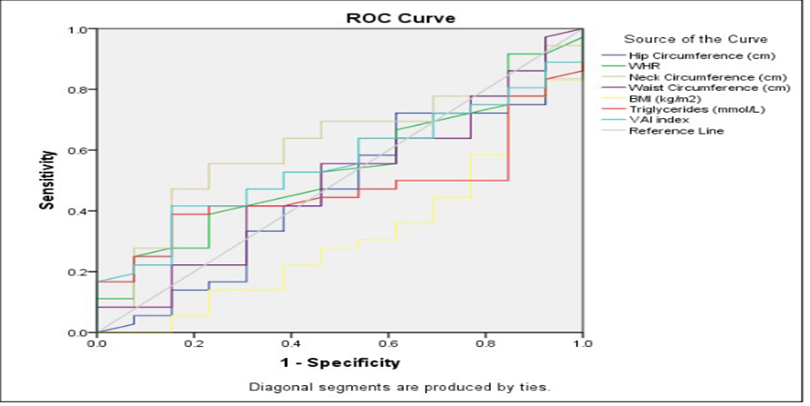
Visceral obesity indices for Diabetic Foot Ulcer in Female
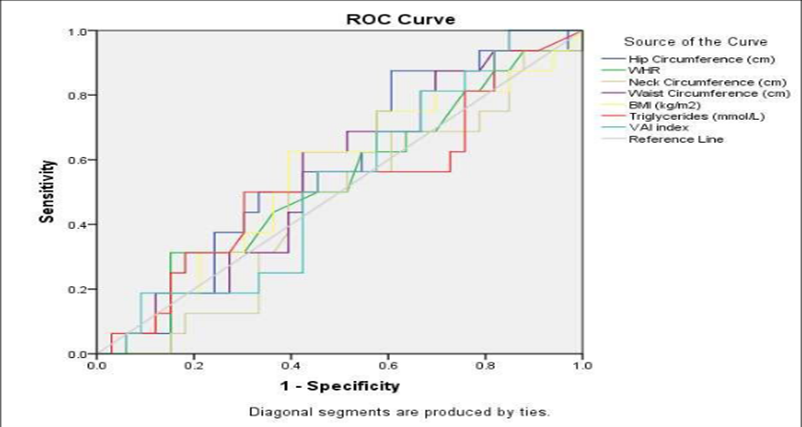
Visceral obesity indices for Peripheral Artery Disease in Female
DISCUSSION:
In the present study, the mean age of the study population was 51.19 ± 10.171 years with the largest proportion of patients belonging to the 51-60 years age group (25.45%), followed by the 31-40 years age group (23.64%). This findings is consistent with Wan et al. (2020)8, in a large community-based Chinese diabetic cohort of 4658 participants, reported a markedly older diabetic population with a mean age of 67.4 ± 8.64 years in men and 66.9 ± 8.58 years in women.
In the present study, males constituted a slightly higher proportion of the study population (55.5%) compared to females (44.5%), indicating a mild male predominance among patients with type 2 diabetes and associated abdominal obesity indices. When compared with studies, similar trends of male predominance are observed in several large-scale cohorts. Wan et al. (2020)8 reported a higher proportion of male participants in their study population indicating that abdominal obesity indices and diabetic complications are frequently studied in male-dominant cohorts.
The anthropometric profile clearly demonstrates a high burden of generalized as well as central obesity. The mean BMI was 32.50 ± 4.98 kg/m², indicating that most patients were in the obese category. Similarly, the mean waist circumference (93.20 ± 10.90 cm) and waist-hip ratio (0.89 ± 0.14) reflect significant central adiposity. Neck circumference was also elevated (36.00 ± 3.70 cm), suggesting increased upper body fat distribution. The mean Visceral Adiposity Index (VAI) was 9.40 ± 5.76, which is considerably high and indicative of marked visceral fat accumulation. These values confirm that the study population had substantial metabolic risk due to obesity, particularly abdominal obesity. These findings are consistent with Marcadenti et al. (2017)9 reported a mean BMI of 30.1 ± 6.0 kg/m², which is lower than the present study (32.50 kg/m²), indicating comparatively higher obesity levels in the present population.
In the present study, there was a high overall burden of diabetic complications. Among the study population, coronary artery disease (60.9%) and peripheral artery disease (57.3%) were the most common complications, indicating a predominance of macrovascular involvement. This was followed by cerebrovascular disease (41.8%), diabetic neuropathy (37.3%) and diabetic nephropathy (36.4%), reflecting a substantial prevalence of microvascular complications as well. Diabetic foot ulcer (27.3%) was the least common but still clinically significant. Similarly, Wu et al. (2022)10 reported that during follow-up, 467 participants developed diabetic nephropathy and 90 developed diabetic retinopathy, indicating that nephropathy is generally more common than retinopathy in longitudinal cohorts.
In the present study, when analyzed together for male participants, a consistent pattern emerges showing that both microvascular and macrovascular complications are associated with adverse anthropometric, metabolic parameters, though the degree of involvement varies.Neck circumference was significantly higher in DN+ and CAD+ participants. VAI were significantly elevated in neuropathy+ individuals, suggesting increased metabolic risk. Wan et al. (2020)8 reported significantly higher NC in males with DKD (equivalent to DN+) NC 40.57 vs. 39.58 cm, p<0.001 directly consistent with our finding of higher NC in DN+ males. They also confirmed NC was higher in CVD/CAD+ males (40.12 vs. 39.65 cm, p<0.001). .
Neck circumference was significantly higher in CVD+ individuals but lower in DFU+ and PAD+ groups. VAI was significantly lower in CVD+ but higher in DFU+ and PAD+ groups, indicating differential metabolic risk patterns. Wan et al. (2020)8 confirmed NC and CVAI were both significantly higher in CVD+ males (NC: 40.12 vs. 39.65 cm, p<0.001; CVAI: 141.57 vs. 129.72, p<0.001), supporting our NC finding in CVD+ males. However, the lower VAI in CVD+ males in our study is a divergent finding. Wan et al. (2020)8 found VAI was not significantly different in CVD in men (p=0.470), suggesting that CVAI may capture CVD risk better than VAI alone.
In the present study, when analyzed together for female participants, a consistent pattern emerges showing that both microvascular and macrovascular complications are associated with adverse parameters, though the degree of involvement varies. Neck circumference did not differ significantly. VAI was elevated in DN+ but reduced in neuropathy+ and CAD+ groups, indicating differing metabolic risk patterns. Hulkoti et al. (2022)11 found VAI positively associated with microvascular complications in females across quartiles (VAI increased from 0.75 to 4.06 across quartiles, p<0.0001). The reduced VAI in Neuropathy+ and CAD+ females in our study contrasts with this and may suggest that in females, other adiposity mechanisms dominate in these complications. Neck circumference was significantly higher in CVD+ but lower in DFU+ participants, while showing minimal variation in PAD groups. VAI was increased in CVD+ but showed no consistent significant variation in DFU and PAD groups. Hulkoti et al. (2022)11 reported TG as a strong independent predictor of microvascular complications (OR=15.79, p<0.0001), supporting our finding of elevated TG in CVD+ and DFU+ females
CONCLUSION:
The present study highlights that patients with type 2 diabetes mellitus in this cohort were predominantly higher-aged and exhibited a high prevalence of both generalized and central obesity, as reflected by neck circumference and visceral adiposity index. A significant finding of the study was the high burden of diabetic complications, particularly macrovascular complications such as coronary artery disease and peripheral artery disease, followed by microvascular complications including retinopathy, neuropathy and nephropathy. Moreover, the majority of patients had multiple coexisting complications, emphasizing that type 2 diabetes is a multi-system disease with progressive accumulation of complications over time.
In male diabetic patients, the presence of microvascular complications including Diabetic Nephropathy and Diabetic Neuropathy was significantly associated with altered visceral adiposity indices showing statistically significant differences between complication-positive and complication-negative groups. In female diabetic participants, a similar pattern of metabolic dysregulation was observed across all six complication types with diabetic foot ulcer and PAD groups .
Overall, this study demonstrates that diabetic complications of both microvascular and macrovascular are strongly associated with VAI and NC in both males and females, emphasizing the need for comprehensive, multi-parameter monitoring and early targeted intervention in diabetic patients to prevent or delay the onset of serious complications.
REFERENCES:
1. International Diabetes Federation. (2021). IDF Diabetes Atlas (10th ed.). Brussels: International Diabetes Federation.
2. Kahn SE, Hull RL, Utzschneider KM. Mechanisms linking obesity to insulinresistance and type 2 diabetes. Nature. 2006 Dec 14;444(7121):840-6.
3. Echouffo-Tcheugui JB, Sarzynski MA. The effect of exercise training on fatdistribution and metabolic profile in humans. Am J Clin Nutr. 2011;89(4):92130.
4. Primeau V, Coderre L, Karelis AD, Brochu M, Lavoie ME, Messier V, SladekR, Rabasa-Lhoret R. Characterizing the profile of obese patients who are metabolically healthy. International journal of obesity. 2011 Jul;35(7):971-81.
5. Ouchi N, Parker JL, Lugus JJ, Walsh K. Adipokines in inflammation andmetabolic disease. Nature reviews immunology. 2011 Feb;11(2):85-97.
6. Gustafson B, Gogg S, Hedjazifar S, Jenndahl L, Hammarstedt A, Smith U.Inflammation and impaired adipogenesis in hypertrophic obesity in man. American Journal of Physiology-Endocrinology and Metabolism. 2009 Nov;297(5):E999-1003.
7. Carey DG, Jenkins AB, Campbell LV, Freund J, Chisholm DJ. Abdominal fatand insulin resistance in normal and overweight women: direct measurements reveal a strong relationship in subjects at both low and high risk of NIDDM.Diabetes. 1996 May 1;45(5):633-8.
8. Wan H, Wang Y, Xiang Q, Fang S, Chen Y, Chen C, Zhang W, Zhang H, Xia F, Wang N, Lu Y. Associations between abdominal obesity indices and diabetic complications: Chinese visceral adiposity index and neck circumference.
9. Cardiovascular diabetology. 2020 Jul 31;19(1):118.
10. Marcadenti A, Fuchs FD, Moreira LB, Gus M, Fuchs SC. Adiposity phenotypes are associated with type-2 diabetes: LAP index, body adiposity index and neck circumference. Atherosclerosis. 2017 Nov 1;266:145-50.
11. Wu Z, Yu S, Kang X, Liu Y, Xu Z, Li Z, Wang J, Miao X, Liu X, Li X, Zhang J. Association of visceral adiposity index with incident nephropathy and retinopathy: a cohort study in the diabetic population. Cardiovascular diabetology. 2022 Feb 24;21(1):32.
Hulkoti V, Acharya S, Shukla S, Kumar S, Kabra R, Dubey A, Lahane V, Giri A, Hulkoti III V. Visceral adiposity index in type 2 diabetes mellitus (DM) and its correlation with microvascular complications. Cureus. 2022 Nov 9;14(11).