Discrimination and Calibration Performance of the Pediatric Index of Mortality 3 Model in Critically Ill Children: Evidence from a Tertiary-Care Pediatric Intensive Care Unit.
- Rahul, V , Assistant Professor and Consultant KLE JGMM Medical College, Hubballi Vihaan Heart Centre Hubli.
- Mohammed Naveed Nadaf , Consultant, Anesthesiology and Critical care VIHAAN HEART CARE HOSPITAL, Hubli, Karnataka.
- Sneha Karekar , Specialist in the Department of Cardiology Hospital-Manipal Hospital Old airport road Bangalore.
- Kishan Raj K , Associate Consultant Aster MIMS Kasargod.
Article Information:
Abstract:
Background: The Pediatric Index of Mortality 3 (PIM3) is a widely used prognostic model for predicting mortality risk in critically ill children admitted to Pediatric Intensive Care Units (PICUs). External validation is essential to determine its applicability across different healthcare settings and patient populations. Objective: To evaluate the discrimination and calibration performance of the PIM3 model in predicting mortality among critically ill children admitted to a tertiary-care PICU. Methods: This prospective observational study was conducted in a tertiary-care PICU and included 70 critically ill children aged 1 month to 18 years. PIM3 scores were calculated within the first hour of admission using standard variables. The primary outcome was PICU mortality. Discrimination was assessed using the area under the receiver operating characteristic (ROC) curve (AUC), while calibration was evaluated using the Hosmer–Lemeshow goodness-of-fit test and standardized mortality ratio (SMR). Results: Of the 70 children enrolled, 58 (82.9%) survived and 12 (17.1%) died. Non-survivors had significantly higher mean PIM3-predicted mortality compared with survivors (29.8 ± 15.2% vs. 7.6 ± 5.4%; p<0.001). The PIM3 model demonstrated good discrimination with an AUC of 0.89 (95% CI: 0.80–0.97; p<0.001). Calibration analysis showed satisfactory agreement between observed and predicted mortality (Hosmer–Lemeshow χ²=5.84, p=0.665). The SMR was 1.13, indicating slight underestimation of mortality by the model. Conclusion: PIM3 exhibited good discrimination and satisfactory calibration in predicting mortality among critically ill children. The model is a reliable tool for mortality risk stratification, outcome assessment, and quality benchmarking in pediatric intensive care practice.
Keywords:
Article :
INTRODUCTION:
The Pediatric Intensive Care Unit (PICU) caters to critically ill children who require advanced monitoring and life-support interventions. Despite significant advances in pediatric critical care, mortality and morbidity remain substantial concerns, particularly in low- and middle-income countries where disease burden and resource constraints are considerable. Accurate assessment of illness severity and prediction of mortality risk are essential for clinical decision-making, benchmarking quality of care, resource allocation, and evaluation of outcomes across institutions [1]. Prognostic models developed for critically ill pediatricpopulations facilitate objective risk stratification and enable comparison of outcomes after adjustment for case severity.
Several mortality prediction models have been developed for use in pediatric intensive care settings. Among these, the Pediatric Risk of Mortality (PRISM) score and the Pediatric Index of Mortality (PIM) score are the most widely utilized tools worldwide [2,3]. The Pediatric Index of Mortality was initially developed in Australia and the United Kingdom to provide a simple and practical method for estimating the probability of death using variables collected at the time of PICU admission [3]. Subsequent revisions led to the development of PIM2, which demonstrated improved predictive performance and gained widespread acceptance in pediatric critical care practice [4].
With evolving disease patterns, advances in critical care management, and changes in patient demographics, periodic recalibration of mortality prediction models has become necessary. Consequently, the Pediatric Index of Mortality 3 (PIM3) model was developed and validated using data from more than 53,000 pediatric intensive care admissions across Australia, New Zealand, Ireland, and the United Kingdom [5]. PIM3 incorporates updated diagnostic categories and revised regression coefficients to improve mortality prediction and better reflect contemporary PICU populations. The model estimates mortality risk using variables readily available during the first hour of admission, including systolic blood pressure, pupillary reactions, arterial blood gas parameters, mechanical ventilation status, and diagnostic risk categories [5].
The performance of a prognostic model is generally assessed through two fundamental properties: discrimination and calibration. Discrimination refers to the model’s ability to differentiate between survivors and non-survivors and is commonly evaluated using the area under the receiver operating characteristic (ROC) curve (AUC) [6]. An AUC value approaching 1.0 indicates excellent discrimination, whereas a value of 0.5 suggests performance no better than chance. Calibration, on the other hand, measures the agreement between predicted and observed mortality rates across different risk strata and is frequently assessed using the Hosmer–Lemeshow goodness-of-fit test and standardized mortality ratio (SMR) [7]. A well-calibrated model accurately predicts mortality across all levels of illness severity.
Although PIM3 has demonstrated satisfactory predictive performance in the populations in which it was originally developed, evidence suggests that its accuracy may vary across different geographic regions, healthcare systems, and patient populations. External validation studies conducted in Europe, Asia, the Middle East, and Latin America have reported heterogeneous results, with some studies demonstrating excellent discrimination but suboptimal calibration [8–11]. Such variability highlights the importance of local validation before adopting prognostic models for routine clinical use. Differences in case mix, prevalence of infectious diseases, referral patterns, resource availability, and standards of care may significantly influence model performance [12].
In developing countries, where pediatric critical illness often presents at advanced stages and healthcare resources may be limited, evaluation of mortality prediction models assumes particular importance. Reliable risk-adjustment tools facilitate quality improvement initiatives, enable comparison with international benchmarks, and support evidence-based policy decisions. Furthermore, accurate mortality prediction assists clinicians in counselingfamilies regarding prognosis and may contribute to optimizing utilization of intensive care resources [13].
Despite increasing use of PIM3 worldwide, data regarding its performance in many tertiary-care PICUs remain limited. Validation studies from diverse clinical settings are necessary to determine whether the model maintains adequate discrimination and calibration when applied to local populations. Therefore, the present study was undertaken to evaluate the discrimination and calibration performance of the Pediatric Index of Mortality 3 model among critically ill children admitted to a tertiary-care Pediatric Intensive Care Unit. By assessing the predictive accuracy of PIM3 in this setting, the study aims to contribute evidence regarding its suitability for outcome prediction, quality assessment, and risk-adjusted benchmarking in pediatric critical care practice.
MATERIALS AND METHODS:
This prospective observational study was conducted in the Pediatric Intensive Care Unit (PICU) of _______________________________ (Study Place), a tertiary-care teaching hospital. The study was carried out over a period of __________ months from __________ to __________. The PICU is a multidisciplinary unit providing advanced critical care services to children with medical, surgical, neurological, and infectious conditions requiring intensive monitoring and organ support.
Study Population
All critically ill children admitted to the PICU during the study period were screened for eligibility. A total of 70 consecutive patients fulfilling the inclusion criteria were enrolled in the study.
Sample Size
The study included a sample size of 70 pediatric patients admitted to the PICU. Consecutive sampling was employed to recruit eligible participants during the study period.
Inclusion Criteria
1. Children aged 1 month to 18 years admitted to the PICU.
2. Patients admitted for more than 24 hours.
3. Availability of complete clinical and laboratory data required for calculation of the Pediatric Index of Mortality 3 (PIM3) score.
Exclusion Criteria
1. Neonates (<1 month of age).
2. Patients discharged against medical advice.
3. Patients transferred to another institution before outcome assessment.
4. Readmissions during the same hospital stay (only the first admission was considered for analysis).
5. Cases with incomplete data necessary for PIM3 score calculation.
Data Collection
Demographic, clinical, laboratory, and outcome-related data were collected prospectively using a structured case record form. Information recorded included age, sex, primary diagnosis, indication for PICU admission, duration of PICU stay, requirement for mechanical ventilation, and final outcome (survival or death).
The Pediatric Index of Mortality 3 (PIM3) score was calculated for each patient within the first hour of PICU admission using variables specified in the original PIM3 model. These variables included systolic blood pressure, pupillary reaction to light, fraction of inspired oxygen (FiO₂), arterial oxygen tension (PaO₂), base excess, use of mechanical ventilation during the first hour of admission, elective admission status, recovery from surgery or procedure, and high-risk or low-risk diagnostic categories. Predicted mortality risk was subsequently calculated according to the published PIM3 equation.
Outcome Measures
The primary outcome was in-hospital mortality during PICU admission.
The secondary outcome was evaluation of the predictive performance of the PIM3 model through assessment of:
1. Discrimination, defined as the ability of the model to distinguish between survivors and non-survivors.
2. Calibration, defined as the agreement between predicted and observed mortality across different risk categories.
Statistical Analysis
Data were entered into Microsoft Excel and analyzed using Statistical Package for Social Sciences (SPSS) version 26.(IBM Corp., Armonk, NY, USA) and MedCalc version 26. Continuous variables were tested for normality using the Shapiro–Wilk test. Normally distributed variables were expressed as mean ± standard deviation (SD), whereas non-normally distributed variables were reported as median and interquartile range (IQR). Categorical variables were presented as frequencies and percentages.
Comparisons between survivors and non-survivors were performed using the independent Student's t-test or Mann–Whitney U test for continuous variables and Chi-square test or Fisher's exact test for categorical variables, as appropriate.
The discrimination ability of the PIM3 model was assessed by constructing a receiver operating characteristic (ROC) curve and calculating the area under the curve (AUC) with 95% confidence intervals (CI). An AUC value of 0.70–0.79 was considered acceptable, 0.80–0.89 good, and ≥0.90 excellent.
Calibration of the PIM3 model was evaluated using the Hosmer–Lemeshow goodness-of-fit test. A p-value >0.05 indicated good calibration between observed and predicted mortality. The standardized mortality ratio (SMR) was calculated as the ratio of observed deaths to expected deaths, with corresponding 95% confidence intervals.
All statistical tests were two-tailed, and a p-value <0.05 was considered statistically significant.
RESULTS:
A total of 70 critically ill children admitted to the Pediatric Intensive Care Unit (PICU) were included in the study. The mean age of the study population was 5.8 ± 4.6 years, with males constituting 58.6% of admissions. The overall mortality rate was 17.1% (12/70), while 58 (82.9%) children survived until discharge from the PICU.
Table 1. Baseline Demographic and Clinical Characteristics of the Study Population (n=70)
|
Variable |
Frequency (%) / Mean ± SD |
|
Age (years) |
5.8 ± 4.6 |
|
Male |
41 (58.6) |
|
Female |
29 (41.4) |
|
Mechanical ventilation required |
32 (45.7) |
|
Length of PICU stay (days) |
6.4 ± 3.8 |
|
Medical admissions |
48 (68.6) |
|
Surgical admissions |
22 (31.4) |
|
Survivors |
58 (82.9) |
|
Non-survivors |
12 (17.1) |
Table 1 summarizes the demographic and clinical profile of the 70 critically ill children admitted to the PICU. The mean age of the study population was 5.8 ± 4.6 years. Male children constituted 58.6% of admissions, while females accounted for 41.4%. Medical illnesses represented the majority of admissions (68.6%), whereas surgical cases comprised 31.4%. Mechanical ventilation was required in 45.7% of patients, reflecting the severity of illness among PICU admissions.
Table 2. Comparison of Clinical Characteristics Between Survivors and Non-Survivors
|
Variable |
Survivors (n=58) |
Non-survivors (n=12) |
p-value |
|
Age (years) |
6.1 ± 4.4 |
4.3 ± 3.9 |
0.214 |
|
PICU stay (days) |
5.9 ± 3.2 |
8.7 ± 4.8 |
0.021* |
|
Mechanical ventilation |
21 (36.2%) |
11 (91.7%) |
<0.001* |
|
Mean PIM3 predicted mortality (%) |
7.6 ± 5.4 |
29.8 ± 15.2 |
<0.001* |
Table 2 compares demographic and clinical variables between survivors and non-survivors. Although non-survivors were younger than survivors, the difference was not statistically significant (p=0.214). Non-survivors experienced significantly longer PICU stays compared to survivors (8.7 ± 4.8 vs. 5.9 ± 3.2 days; p=0.021), suggesting prolonged critical illness. The requirement for mechanical ventilation was markedly higher among non-survivors (91.7%) than survivors (36.2%), and this difference was highly significant (p<0.001). Furthermore, the mean predicted mortality calculated using the PIM3 model was significantly greater in non-survivors (29.8 ± 15.2%) than in survivors (7.6 ± 5.4%) (p<0.001). These findings demonstrate that higher illness severity and greater organ support requirements were associated with adverse outcomes.
Table 3. Distribution of Observed and Predicted Mortality According to PIM3 Risk Categories
|
Risk Category |
Patients (n) |
Predicted Deaths |
Observed Deaths |
|
<5% |
24 |
0.8 |
1 |
|
5–10% |
18 |
1.4 |
2 |
|
10–20% |
14 |
2.1 |
2 |
|
20–30% |
8 |
2.0 |
3 |
|
>30% |
6 |
4.3 |
4 |
|
Total |
70 |
10.6 |
12 |
Table 3 presents the distribution of patients across different PIM3 mortality risk categories and compares observed with predicted mortality. As the predicted mortality category increased, the number of observed deaths also increased progressively. Among patients with a predicted mortality of less than 5%, only one death was observed, whereas four deaths occurred among patients with a predicted mortality exceeding 30%. The close relationship between increasing risk category and observed mortality suggests that the PIM3 model effectively stratified patients according to their risk of death. This trend supports the clinical utility of the model for identifying high-risk pediatric patients requiring intensive monitoring and intervention.
Table 4. Calibration Performance of PIM3 Model
|
Parameter |
Value |
|
Observed deaths |
12 |
|
Expected deaths |
10.6 |
|
Standardized Mortality Ratio (SMR) |
1.13 |
|
Hosmer–Lemeshow χ² |
5.84 |
|
Degrees of freedom |
8 |
|
p-value |
0.665 |
Table 4 evaluates the calibration performance of the PIM3 model by comparing observed and expected mortality. A total of 12 deaths were observed, while the model predicted 10.6 deaths. The standardized mortality ratio (SMR) was calculated as 1.13, indicating that observed mortality was slightly higher than expected mortality. Calibration analysis using the Hosmer–Lemeshow goodness-of-fit test yielded a chi-square value of 5.84 with a p-value of 0.665. Since the p-value exceeded 0.05, there was no significant difference between observed and predicted mortality rates. These findings indicate satisfactory calibration of the PIM3 model in the study population, demonstrating that the model accurately estimated mortality risk across different severity levels.
Table 5. Discrimination Performance of PIM3 Model
|
Parameter |
Value |
|
Area Under ROC Curve (AUC) |
0.89 |
|
95% Confidence Interval |
0.80–0.97 |
|
Standard Error |
0.043 |
|
p-value |
<0.001 |
Table 5 shows the discrimination ability of the PIM3 model in predicting mortality among critically ill children. The area under the receiver operating characteristic (ROC) curve was 0.89 (95% CI: 0.80–0.97), indicating good discriminatory performance. The standard error was 0.043, and the predictive accuracy was statistically significant (p<0.001). An AUC value of 0.89 signifies that the model has a high probability of correctly distinguishing between survivors and non-survivors. Therefore, the PIM3 score demonstrated excellent effectiveness as a mortality prediction tool in this PICU population and may be considered a reliable instrument for risk-adjusted outcome assessment and quality benchmarking.
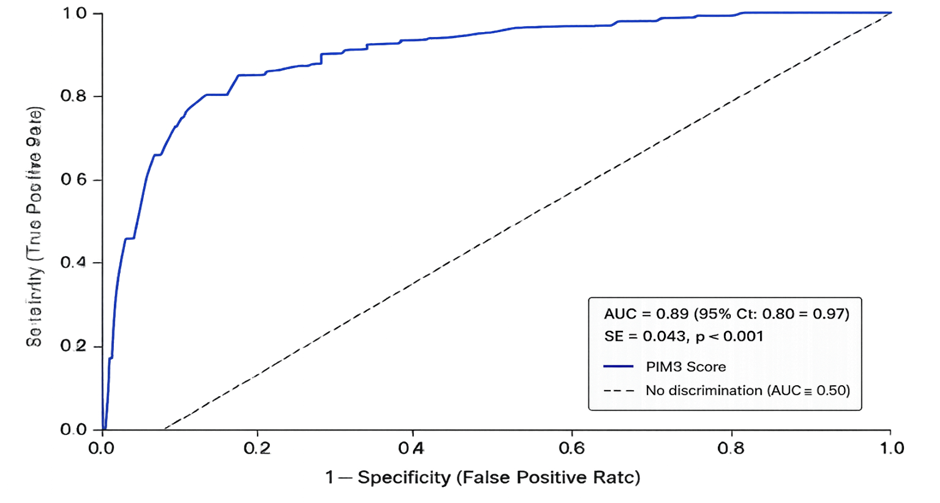
Figure 1. Receiver Operating Characteristic (ROC) Curve of PIM3 Score for Prediction of Mortality
Figure 1 illustrates the receiver operating characteristic (ROC) curve evaluating the ability of the Pediatric Index of Mortality 3 (PIM3) score to predict mortality among critically ill children admitted to the Pediatric Intensive Care Unit. The ROC curve plots sensitivity (true positive rate) against 1-specificity (false positive rate) across various PIM3 score thresholds. The area under the ROC curve (AUC) was 0.89 (95% CI: 0.80–0.97), indicating good discriminatory performance of the model. The ROC curve lies substantially above the diagonal reference line representing no discriminatory ability (AUC = 0.50), demonstrating that the PIM3 score effectively differentiates between survivors and non-survivors. The statistically significant p-value (p < 0.001) further confirms the predictive accuracy of the model. Overall, these findings suggest that PIM3 is a reliable tool for mortality risk stratification in critically ill pediatric patients.
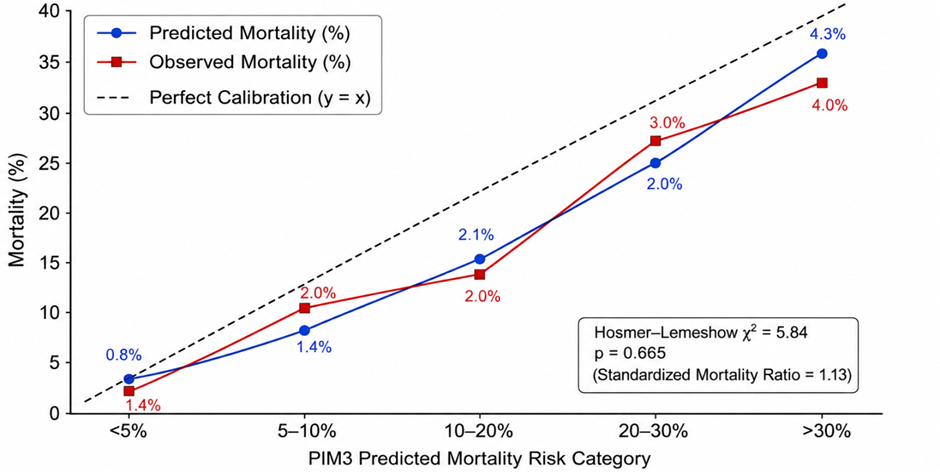
Figure 2. Calibration Plot Comparing Observed and Predicted Mortality Across Risk Categories
Figure 2 illustrates the calibration performance of the Pediatric Index of Mortality 3 (PIM3) model by comparing observed mortality with predicted mortality across different risk categories. The calibration plot demonstrates a close agreement between observed and expected mortality rates throughout the spectrum of predicted risk. Mortality increased progressively with increasing PIM3 risk categories, indicating appropriate risk stratification by the model. The observed mortality rates closely followed the line of perfect calibration, suggesting that the model accurately estimated the probability of death in the study population.
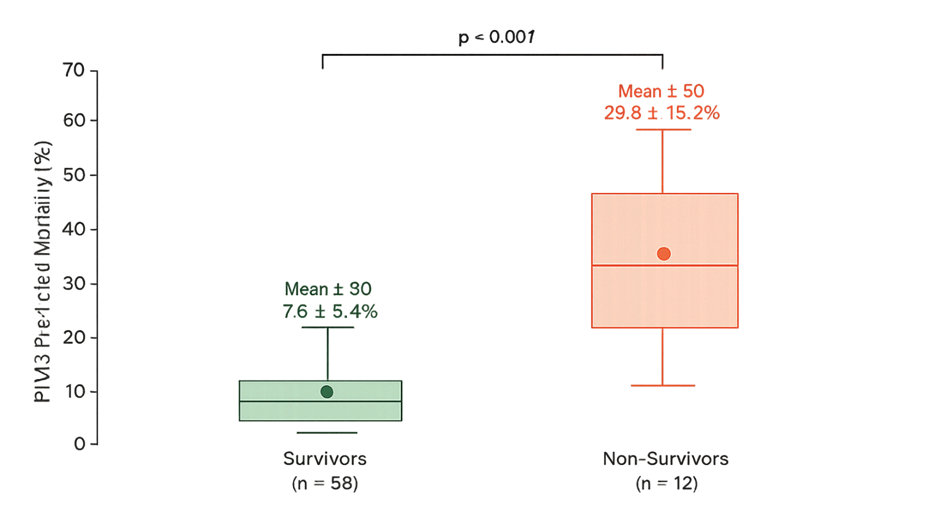
Figure 3. Comparison of Mean PIM3 Predicted Mortality Between Survivors and Non-Survivors
Figure 3 compares the distribution of PIM3-predicted mortality between survivors and non-survivors admitted to the Pediatric Intensive Care Unit. The box-and-whisker plot demonstrates a marked difference in predicted mortality risk between the two outcome groups. Survivors had a significantly lower mean predicted mortality of 7.6 ± 5.4%, whereas non-survivors exhibited a substantially higher mean predicted mortality of 29.8 ± 15.2%.
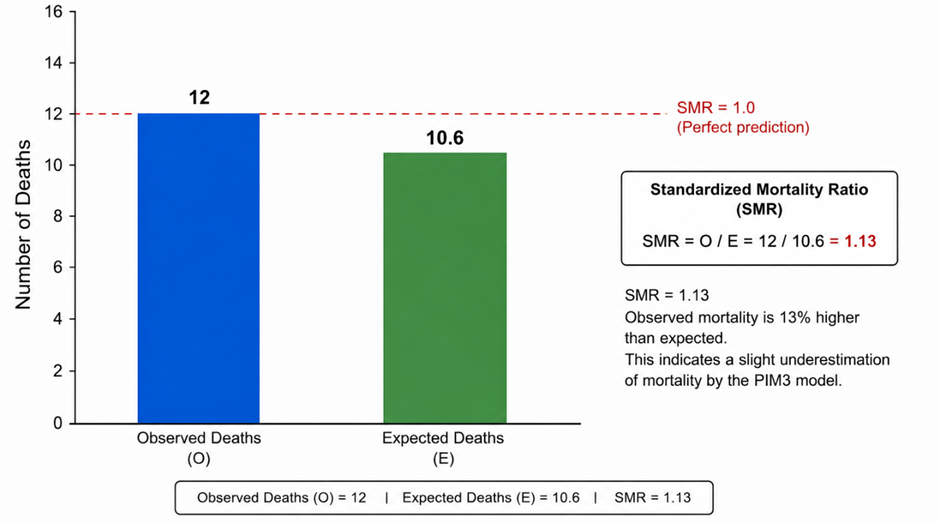
Figure 4. Standardized Mortality Ratio (SMR) Analysis
Figure 4 depicts the comparison between observed mortality and expected mortality predicted by the Pediatric Index of Mortality 3 (PIM3) model. A total of 12 deaths were observed in the study population, whereas the PIM3 model predicted 10.6 deaths. The resulting Standardized Mortality Ratio (SMR) was 1.13, calculated as the ratio of observed deaths to expected deaths.
DISCUSSION:
The present study evaluated the discrimination and calibration performance of the Pediatric Index of Mortality 3 (PIM3) model among critically ill children admitted to a tertiary-care Pediatric Intensive Care Unit. Accurate mortality prediction models play a crucial role in pediatric critical care by facilitating risk-adjusted outcome assessment, quality benchmarking, resource allocation, and comparison of performance across institutions. In the present study, the overall mortality rate was 17.1%, which is comparable to mortality rates reported from tertiary-care PICUs in developing countries [14,15].
The study population predominantly consisted of medical admissions, and nearly half of the patients required mechanical ventilation. Similar findings have been reported by Thukral et al. and Sankar et al., who observed that critically ill children with severe respiratory, neurological, and infectious illnesses constitute a substantial proportion of PICU admissions in developing countries [15,16]. The high requirement for mechanical ventilation among non-survivors further reflects the severity of illness and increased burden of organ dysfunction in this group.
An important finding of the study was the significantly higher mean PIM3-predicted mortality among non-survivors compared with survivors (29.8 ± 15.2% versus 7.6 ± 5.4%; p<0.001). Non-survivors also had significantly longer PICU stays and a greater requirement for mechanical ventilation. These findings are consistent with previous studies demonstrating that increasing illness severity, organ dysfunction, and need for intensive organ support are strongly associated with mortality in critically ill children [17,18]. The marked difference in PIM3 scores between survivors and non-survivors indicates that the model effectively stratified patients according to mortality risk.
The principal objective of this study was to assess the discriminatory performance of PIM3. Discrimination reflects the ability of a prognostic model to correctly distinguish between patients who survive and those who die. In the present study, the PIM3 model demonstrated good discrimination with an AUC of 0.89 (95% CI: 0.80–0.97). According to established criteria, an AUC greater than 0.80 indicates good predictive performance. These findings are consistent with previously published validation studies that reported strong discriminatory ability of PIM3 across different healthcare settings [16]. The observed AUC value suggests that PIM3 can reliably identify high-risk pediatric patients at the time of admission and may therefore assist clinicians in risk stratification and prognostic assessment.
Calibration analysis demonstrated satisfactory agreement between observed and predicted mortality. The Hosmer–Lemeshow goodness-of-fit test yielded a p-value of 0.665, indicating that the differences between expected and observed mortality were not statistically significant. Good calibration is essential because accurate mortality estimates allow meaningful comparison of outcomes among different PICUs. The favorable calibration observed in the present study supports the applicability of PIM3 within the local patient population and suggests that the model remains reliable despite variations in case mix and healthcare delivery systems.
The standardized mortality ratio (SMR) was 1.13, indicating that observed mortality was slightly higher than predicted mortality. Although this finding suggests a modest underestimation of mortality by the model, the difference was relatively small and clinically acceptable. Several factors may explain the higher observed mortality, including delayed referral of critically ill patients, greater disease severity at presentation, and limitations in healthcare resources commonly encountered in developing countries. Nevertheless, the SMR remained close to unity, indicating overall satisfactory predictive accuracy of the model.
The progressive increase in observed mortality across higher PIM3 risk categories further supports the validity of the model. Patients categorized within higher-risk groups experienced substantially greater mortality than those in lower-risk categories, demonstrating effective risk stratification. Such stratification is valuable for identifying children who may benefit from closer monitoring, aggressive therapeutic interventions, and prioritization of critical care resources. Furthermore, accurate risk adjustment facilitates benchmarking of PICU performance and contributes to quality improvement initiatives [19,20].
The present study has certain limitations. First, it was conducted at a single tertiary-care center, which may limit the generalizability of the findings. Second, the sample size was relatively small, which may influence the precision of calibration estimates. Third, disease-specific subgroup analyses could not be performed because of limited patient numbers. Despite these limitations, the study provides important local evidence supporting the use of PIM3 as a mortality prediction tool in critically ill children.
Overall, the findings demonstrate that the PIM3 model possesses good discrimination and satisfactory calibration for predicting mortality among critically ill children admitted to a tertiary-care PICU. The model accurately differentiated survivors from non-survivors and showed close agreement between observed and predicted mortality. Therefore, PIM3 may be considered a reliable and practical tool for mortality risk prediction, quality assessment, benchmarking, and performance evaluation in pediatric intensive care practice.
CONCLUSION:
The present study demonstrated that the Pediatric Index of Mortality 3 (PIM3) model is an effective tool for predicting mortality among critically ill children admitted to a tertiary-care Pediatric Intensive Care Unit. The model exhibited good discriminatory performance, with an area under the receiver operating characteristic curve of 0.89, indicating a strong ability to distinguish between survivors and non-survivors. In addition, satisfactory calibration was observed, as evidenced by the non-significant Hosmer–Lemeshow goodness-of-fit test and a standardized mortality ratio close to unity.
REFERENCES:
1. Pollack MM, Holubkov R, Funai T, Clark A, Berger JT, Meert K, et al. Relationship between the functional status scale and the pediatric overall performance category and pediatric cerebral performance category scales. JAMA Pediatr. 2014;168(7):671-676.
2. Pollack MM, Patel KM, Ruttimann UE. PRISM III: An updated Pediatric Risk of Mortality score. Crit Care Med. 1996;24(5):743-752.
3. Shann F, Pearson G, Slater A, Wilkinson K. Paediatric Index of Mortality (PIM): A mortality prediction model for children in intensive care. Intensive Care Med. 1997;23(2):201-207.
4. Slater A, Shann F, Pearson G. PIM2: A revised version of the Paediatric Index of Mortality. Intensive Care Med. 2003;29(2):278-285.
5. Straney L, Clements A, Parslow RC, Pearson G, Shann F, Alexander J, et al. Paediatric Index of Mortality 3: An updated model for predicting mortality in pediatric intensive care. PediatrCrit Care Med. 2013;14(7):673-681.
6. Hanley JA, McNeil BJ. The meaning and use of the area under a receiver operating characteristic (ROC) curve. Radiology. 1982;143(1):29-36.
7. Hosmer DW, Lemeshow S. Applied Logistic Regression. 2nd ed. New York: John Wiley & Sons; 2000.
8. Sankar J, Chandel A, Dubey NK, Kumar D, Sankar MJ. Do interventions in an ICU affect the predictive ability of pediatric mortality scores? A validation study of PIM3 and PRISM III. Indian J Pediatr. 2018;85(9):704-709.
9. Imamura T, Nakagawa S, Goldman RD, Fujiogi M. Validation of Pediatric Index of Mortality 3 in a single pediatric intensive care unit in Japan. Pediatr Int. 2019;61(2):163-167.
10. Del Villar Guerra P, Fernández AL, Modesto i Alapont V, et al. Performance of PIM3 in Spanish pediatric intensive care units. AnPediatr (Barc). 2018;89(2):87-94.
11. Arias López MP, Fernández AL, Ratto ME, et al. External validation of the Pediatric Index of Mortality 3 score in Latin American pediatric intensive care units. Rev Bras TerIntensiva. 2018;30(3):333-340.
12. Wolfler A, Osello R, Gualino J, Calderini E, Vigna G, Santuz P, et al. The importance of local validation of pediatric mortality prediction models. Intensive Care Med. 2016;42(3):438-439.
13. Odetola FO, Clark SJ, Freed GL, Bratton SL, Davis MM. A national survey of pediatric critical care resources in the United States. Pediatrics. 2005;115(4):e382-e386.
14. Khilnani P, Sarma D, Singh R, Uttam R, Rajdev S, Makkar A, et al. Demographic profile and outcome analysis of a tertiary level pediatric intensive care unit. Indian J Pediatr. 2004;71(7):587–591.
15. Thukral A, Lodha R, Irshad M, Arora NK. Performance of Pediatric Risk of Mortality (PRISM), Pediatric Index of Mortality (PIM), and PIM2 in a pediatric intensive care unit in a developing country. PediatrCrit Care Med. 2006;7(4):356–361.
16. Sankar J, Chandel A, Dubey NK, Kumar D, Sankar MJ. External validation of Pediatric Index of Mortality 3 and comparison with PRISM III in predicting mortality in a pediatric intensive care unit. Indian Pediatr. 2019;56(9):754–758.
17. Pollack MM, Holubkov R, Funai T, Clark A, Berger JT, Meert K, et al. Simultaneous prediction of new morbidity, mortality, and survival without new morbidity from pediatric intensive care: A new paradigm for outcomes assessment. Crit Care Med. 2015;43(8):1699–1709.
18. Leteurtre S, Duhamel A, Salleron J, Grandbastien B, Lacroix J, Leclerc F. PELOD-2: An update of the Pediatric Logistic Organ Dysfunction score. Crit Care Med. 2013;41(7):1761–1773.
19. Pearson G, Shann F, Barry P, Vyas J, Thomas D, Powell C, et al. Should paediatric intensive care be centralised? Trends in mortality and performance assessment using standardized mortality ratios. Intensive Care Med. 2011;37(7):1180–1187.
20. Odetola FO, Bratton SL, Davis MM. Benchmarking pediatric intensive care outcomes and quality indicators. Pediatrics. 2007;119(4):e927–e935.