Role of Diffusion-Weighted Magnetic Resonance Imaging in the Evaluation of Prostate Lesions and Its Histopathological Correlation: A Retrospective Study from a Tertiary Care Center in Eastern India.
- Santosh Kumar Padhy , Associate Professor, Department of Radiology IMS & SUM Hospital, Bhubaneswar, Odisha.
- Debabrata Sahani , Assistant Professor, Department of Radio-diagnosis, IMS & SUM Hospital, Bhubaneswar, Odisha.
- Kiran Tripathy , Assistant Professor, Department of Pathology IMS & SUM - II, Phulnakhara, Bhubaneswar, Odisha.
- Maheswar Chaudhury , Associate professor Dept -Radio diagnosis IMS & SUM Hospital, Bhubaneswar, Odisha.
Article Information:
Abstract:
Background and Objectives: Multiparametric magnetic resonance imaging (mpMRI) has revolutionized the clinical pathway for prostate cancer diagnosis. Among its sequences, diffusion-weighted imaging (DWI) paired with Apparent Diffusion Coefficient (ADC) maps offers crucial functional information regarding cellular density. This study aimed to evaluate the diagnostic efficacy of quantitative DWI on a 1.5 Tesla scanner in differentiating benign from malignant prostate lesions, using histopathological diagnosis as the reference standard. Methods: A retrospective study was conducted on 75 male patients who underwent 1.5T mpMRI of the prostate for suspected prostatic disease (elevated prostate-specific antigen [PSA] levels or abnormal digital rectal examination) followed by histopathological verification at the Institute of Medical Sciences and SUM Hospital, Bhubaneswar, between January 2022 and December 2025. Mean ADC values (expressed in units of 10^-3 mm^2/s) were measured within defined regions of interest (ROIs) on the ADC map and compared between benign and malignant lesions using an independent t-test. Receiver Operating Characteristic (ROC) curve analysis was used to determine the optimal ADC cutoff value for cancer detection. Proportions of malignancy across Prostate Imaging Reporting and Data System (PI-RADS) v2.1 categories were analyzed using the Chi-square test. Results: Of the 75 patients, histopathology confirmed 40 cases (53.3%) as benign (28 benign prostatic hyperplasia [BPH], 12 chronic prostatitis) and 35 cases (46.7%) as malignant (prostate adenocarcinoma). The mean age was 63.4 years (plus or minus 7.2 years) for benign cases and 67.8 years (plus or minus 6.5 years) for malignant cases. Malignant lesions demonstrated a statistically significant reduction in mean ADC values compared to benign lesions (0.74 plus or minus 0.12 x 10^-3 mm^2/s versus 1.34 plus or minus 0.18 x 10^-3 mm^2/s; p-value less than 0.001). ROC curve analysis yielded an optimal ADC cutoff value of 0.88 x 10^-3 mm^2/s, providing a sensitivity of 91.4% and a specificity of 87.5%, with an Area Under the Curve (AUC) of 0.942 (95% confidence interval: 0.891 to 0.993). A significant association was observed between higher PI-RADS v2.1 categories and histopathological malignancy (Chi-square = 32.41, degrees of freedom = 3, p-value less than 0.001). Conclusion: Quantitative ADC analysis on a 1.5T MRI platform serves as a highly accurate, non-invasive biomarker for differentiating malignant prostate cancer from benign mimickers. Integration of standardized quantitative ADC thresholds can significantly enhance the diagnostic specificity of routine prostate MRI examinations in resource-constrained clinical settings.
Keywords:
Article :
INTRODUCTION:
Prostate cancer stands as one of the most frequently diagnosed malignancies and a major cause of cancer-related mortality among aging males globally [1]. In India, epidemiological shifts driven by urbanization, changing lifestyles, and increased diagnostic awareness have led to a steady increase in the incidence of prostate cancer, particularly in urban and semi-urban populations of Eastern India [2]. Traditional screening relies heavily on digital rectal examinations (DRE) and serum prostate-specific antigen (PSA) levels. However, PSA testing has long been plagued by low specificity. Elevated PSA levels in the "grey zone" of 4.0 to 10.0 ng/mL are frequently associated with non-malignant conditions, such as benign prostatic hyperplasia (BPH) and acute or chronic prostatitis, leading to significant diagnostic confusion [3].
Historically, patients with suspected prostate cancer underwent systematic transrectal ultrasound (TRUS)-guided 12-core biopsies. While this approach has served as the diagnostic backbone for decades, it is subject to severe limitations, including sampling errors, underdiagnosis of clinically significant cancers located in the anterior or apical regions of the prostate, and the potential for overdetecting indolent, low-grade tumors [4]. Furthermore, TRUS biopsy is an invasive procedure associated with complications such as hematuria, hematoschezia, pain, and life-threatening urosepsis [5].
To address these diagnostic challenges, multiparametric magnetic resonance imaging (mpMRI) has emerged as a crucial clinical tool. By combining high-resolution anatomical sequences (T2-weighted imaging) with functional imaging techniques, mpMRI provides superb soft-tissue contrast and localization [6]. Functional sequences include dynamic contrast-enhanced (DCE) imaging, magnetic resonance spectroscopy (MRS), and diffusion-weighted imaging (DWI). DWI, in particular, has established itself as the single most critical component of the mpMRI protocol. It evaluates the microscopic, random Brownian motion of water molecules within biologic tissues without the need for exogenous contrast agents [7].
In normal prostatic tissue, water molecules diffuse relatively freely within the fluid-filled acini of the glandular tubules. However, in malignant tumors, the normal architecture of the gland is disrupted. Proliferating neoplastic cells crowd the interstitial spaces, resulting in hypercellularity, a reduced ratio of extracellular to intracellular volume, and a substantial restriction of water diffusion [8]. This restricted diffusion manifests as high signal intensity on high b-value DWI sequences and a corresponding low signal intensity on Apparent Diffusion Coefficient (ADC) maps, which are mathematically reconstructed from raw DWI sequences [9].
While the qualitative assessment of DWI is highly valuable, quantitative analysis through the measurement of ADC values provides an objective, operator-independent index of tissue cellularity [10]. Although 3.0 Tesla (3T) MRI scanners offer superior signal-to-noise ratios, 1.5 Tesla (1.5T) systems remain the primary workhorse in the vast majority of diagnostic centers and tertiary care hospitals across developing nations due to lower procurement and maintenance costs [11]. It is therefore critical to establish the diagnostic reliability and establish optimal quantitative ADC thresholds specifically for 1.5T scanners in clinical environments.
The Institute of Medical Sciences and SUM Hospital, in Bhubaneswar, serves as a major tertiary care center in Eastern India, catering to a diverse patient population with varied socio-demographic backgrounds. Differentiating benign lesions from malignant ones non-invasively is of paramount clinical importance in this setting to prevent unnecessary biopsies and optimize resource utilization. This study was designed to evaluate the clinical utility of quantitative DWI on a 1.5T MRI platform and to correlate measured ADC values directly with histopathological outcomes in a retrospective cohort of 75 patients.
MATERIALS AND METHODS:
Study Design and Patient Selection
This retrospective, diagnostic accuracy study was conducted in the Department of Radiodiagnosis at the Institute of Medical Sciences and SUM Hospital, Campus 1, Bhubaneswar. The study population comprised patients who underwent mpMRI of the prostate followed by histopathological evaluation (via TRUS-guided biopsy or radical prostatectomy) between January 2022 and December 2025.
The inclusion and exclusion criteria were rigorously applied to select the study cohort:
Inclusion Criteria:
1. Patients who underwent clinical evaluation for suspected prostatic pathology due to elevated serum PSA levels (greater than or equal to 4.0 ng/mL) and/or an abnormal DRE.
2. Patients who completed a standardized prostate mpMRI protocol, including high-quality DW-MRI sequences, on the in-house 1.5T scanner.
3. Patients with histopathological confirmation obtained via systematic 12-core TRUS-guided biopsy or radical prostatectomy within 3 months of the MRI exam.
Exclusion Criteria:
1. Patients with a prior history of prostate cancer treatment, including hormonal therapy, radiation therapy, chemotherapy, or transurethral resection of the prostate (TURP), which would alter baseline tissue characteristics.
2. MRI scans with severe susceptibility artifacts, motion artifacts, or rectal gas distortion that precluded accurate quantitative evaluation of the ADC maps.
3. Inadequate histopathological specimens that did not allow for a definitive benign or malignant diagnosis.
Applying these criteria yielded a final sample size of 75 patients (N = 75).
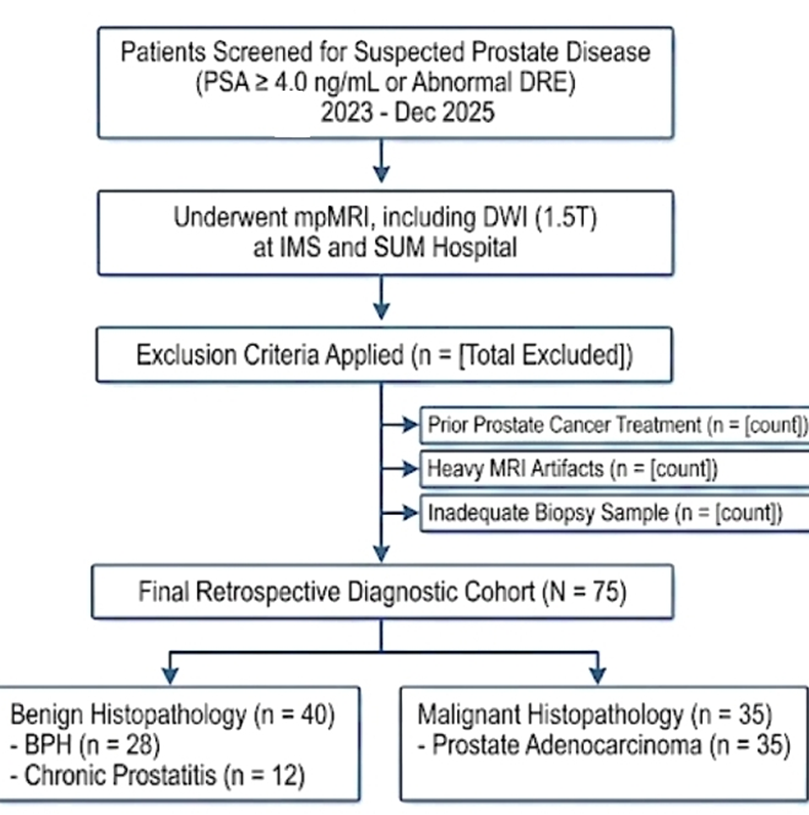
Figure 1: Flowchart of patient selection and final cohort distribution based on histopathological reference standards.
MRI Acquisition Protocol
All imaging examinations were performed on a clinical 1.5 Tesla MRI scanner utilizing a dedicated pelvic phased-array coil to ensure optimal signal detection. Patients were instructed to empty their bladders before the examination. To minimize bowel peristalsis and associated motion artifacts, patients were asked to follow a low-residue diet the day prior to the scan and underwent a cleansing enema on the morning of the procedure when feasible.
The standardized multiparametric protocol consisted of the following sequences:
1. T2-Weighted Imaging (T2WI): High-resolution fast spin-echo (FSE) sequences were acquired in three orthogonal planes (axial, sagittal, and coronal). Parameters: TR 3500-4000 ms, TE 100-110 ms, slice thickness 3 mm, no gap, field of view (FOV) 180-200 mm, matrix size 320 x 256.
2. T1-Weighted Imaging (T1WI): Axial spin-echo sequence to evaluate for pelvic lymphadenopathy and assess the presence of post-biopsy hemorrhage. Parameters: TR 500-600 ms, TE 10-12 ms, slice thickness 4 mm, FOV 200 mm, matrix size 256 x 256.
3. Diffusion-Weighted Imaging (DWI): Single-shot echo-planar imaging (SS-EPI) sequence acquired in the axial plane. Diffusion-sensitizing gradients were applied in three orthogonal directions using b-values of 0, 500, and 1000 s/mm^2. Parameters: TR 4200 ms, TE 85 ms, slice thickness 3 mm, interslice gap 0.5 mm, FOV 200-220 mm, matrix size 128 x 128. Apparent Diffusion Coefficient (ADC) maps were automatically generated on a voxel-by-voxel basis by the system software using a mono-exponential decay model based on the acquired b-values.
Image Analysis and ADC Measurement
Radiological analysis was performed by experienced senior radiologists, experienced in pelvic and genitourinary imaging, who were blinded to the clinical history, PSA levels, and subsequent histopathological results. Discrepancies in scoring were resolved by consensus.
Lesions were categorized according to the Prostate Imaging Reporting and Data System (PI-RADS) version 2.1 guidelines. A PI-RADS score of 1 to 5 was assigned to each localized lesion based on the dominant sequence (T2WI for the transition zone and DWI/ADC for the peripheral zone).
Quantitative ADC evaluation was performed on a dedicated workstation. The radiologists identified the index lesion—defined as the lesion with the highest PI-RADS score or the largest tumor diameter—on the high b-value DWI sequence and matched its location on the corresponding ADC map. A circular or elliptical region of interest (ROI) ranging between 10 mm^2 and 30 mm^2 was carefully placed manually within the darkest portion of the lesion on the ADC map, representing the area of maximum diffusion restriction. Care was taken to avoid the margins of the lesion to prevent volume averaging with surrounding normal prostatic tissue, cystic spaces, calcifications, or neighboring pelvic bones. For each index lesion, three separate ROI measurements were taken, and the average value was calculated and recorded as the mean ADC value (expressed in units of 10^-3 mm^2/s).
Histopathological Correlation
The histopathological specimens served as the reference standard. All biopsies were performed within three months of the MRI exam. TRUS-guided systematic 12-core biopsies were performed under local anesthesia, with additional targeted cores taken from suspicious regions identified on the mpMRI scans. In patients who went on to undergo radical prostatectomy (n = 15), the surgical specimens were processed using whole-mount slicing. The specimens were fixed in 10% neutral buffered formalin, embedded in paraffin, sectioned, and stained with hematoxylin and eosin (H&E). Histopathological grading and diagnosis were performed by an experienced uropathologist who was blinded to the imaging and ADC findings. Malignant lesions were graded using the Gleason scoring system and further classified into the International Society of Urological Pathology (ISUP) Gleason Grade Groups (Grade Groups 1 through 5) based on the primary and secondary growth patterns.
Statistical Analysis
All statistical analyses were conducted using Statistical Package for the Social Sciences (SPSS) software, version 26.0 (IBM Corp., Armonk, NY, USA). Continuous variables (such as age, PSA levels, prostate volume, and mean ADC values) were expressed as mean plus or minus standard deviation (+/- SD). Normal distribution of the continuous variables was verified using the Shapiro-Wilk test. To compare mean ADC values between benign and malignant prostate lesions, an independent-samples t-test was performed. Statistical significance was defined as a p-value less than 0.05, though highly significant associations were highlighted at p-value less than 0.001. Receiver Operating Characteristic (ROC) curve analysis was executed to evaluate the overall diagnostic performance of quantitative ADC measurements. The Area Under the Curve (AUC) was computed along with its 95% confidence interval (CI). The coordinates of the ROC curve were examined to establish the optimal ADC cutoff value that maximized both diagnostic sensitivity and specificity. Positive predictive value (PPV) and negative predictive value (NPV) were calculated based on this optimal threshold.
The association between categorical variables—specifically the assigned PI-RADS v2.1 scores and the final histopathological outcome (benign versus malignant)—was evaluated using the Chi-square test of independence.
RESULTS:
Demographic and Clinical Profiles
A total of 75 male patients met the inclusion and exclusion criteria and were enrolled in this retrospective analysis. Based on the histopathological reference standard, 40 patients (53.3%) were diagnosed with benign prostatic pathology, which included 28 cases of BPH (70.0% of the benign cohort) and 12 cases of BPH complicated by active chronic prostatitis (30.0% of the benign cohort). The remaining 35 patients (46.7%) were diagnosed with histopathologically proven adenocarcinoma of the prostate.
The demographic and baseline clinical characteristics of the study cohort are presented in Table 1. The mean age of patients with malignant lesions was slightly higher than those with benign lesions (67.8 plus or minus 6.5 years versus 63.4 plus or minus 7.2 years), reflecting the progressive incidence of prostate malignancy in older cohorts. The serum PSA level was significantly higher in patients with malignant pathology, showing a mean of 18.5 plus or minus 12.4 ng/mL compared to 7.2 plus or minus 3.1 ng/mL in the benign group. Conversely, the mean prostate volume was larger in the benign group (52.4 plus or minus 14.2 cm^3) than in the malignant group (41.2 plus or minus 12.8 cm^3), consistent with the physical hallmark of benign prostatic hyperplasia.
Table 1: Demographic and clinical characteristics of the study population (N = 75)
|
Parameter |
Benign Lesions (N = 40) |
Malignant Lesions (N = 35) |
Statistical Test / p-value |
|
Age (years, Mean +/- SD) |
63.4 +/- 7.2 |
67.8 +/- 6.5 |
t = 2.76, p-value = 0.007 |
|
Age Range (years) |
50 to 78 |
55 to 82 |
- |
|
Serum PSA (ng/mL, Mean +/- SD) |
7.2 +/- 3.1 |
18.5 +/- 12.4 |
t = 5.58, p-value < 0.001 |
|
PSA Range (ng/mL) |
2.5 to 14.8 |
4.2 to 58.6 |
- |
|
Prostate Volume (cm^3, Mean +/- SD) |
52.4 +/- 14.2 |
41.2 +/- 12.8 |
t = 3.56, p-value = 0.001 |
|
Primary Lesion Location |
|||
|
- Peripheral Zone (PZ) |
14 (35.0%) |
26 (74.3%) |
Chi-square = 11.64, p-value = 0.001 |
|
- Transition Zone (TZ) |
26 (65.0%) |
9 (25.7%) |
- |
(Note: PSA = Prostate-Specific Antigen; SD = Standard Deviation; cm^3 = cubic centimeters)
Apparent Diffusion Coefficient (ADC) Analysis
Quantitative analysis of the ADC maps demonstrated a pronounced difference in diffusion restriction between benign and malignant prostatic tissues. For the malignant group (n = 35), the mean ADC value of the index lesions was 0.74 plus or minus 0.12 x 10^-3 mm^2/s (ranging from 0.51 to 0.96 x 10^-3 mm^2/s). In contrast, the benign group (n = 40) displayed a mean ADC value of 1.34 plus or minus 0.18 x 10^-3 mm^2/s (ranging from 0.98 to 1.72 x 10^-3 mm^2/s). An independent-samples t-test confirmed that this difference was statistically highly significant (t-value = 16.74, p-value less than 0.001). There was minimal overlap in ADC values between the two groups, primarily occurring in cases of chronic prostatitis where acute inflammatory cellular infiltration caused a reduction in diffusion values, mimicking malignancy.
Diagnostic Efficacy of ADC and ROC Analysis
To define the optimal quantitative threshold for clinical decision-making, a Receiver Operating Characteristic (ROC) curve was constructed using the mean ADC values. The Area Under the Curve (AUC) for differentiating benign from malignant lesions was 0.942 (95% confidence interval: 0.891 to 0.993, p-value less than 0.001), indicating outstanding diagnostic accuracy.
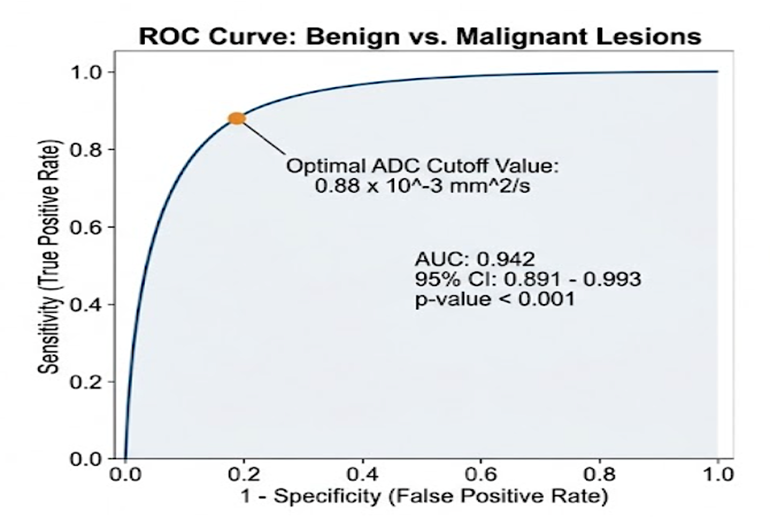
Figure 2: Text-based schematic representation of the Receiver Operating Characteristic (ROC) curve for quantitative ADC performance. The Area Under the Curve (AUC) is 0.942, with the optimal diagnostic point located at an ADC of 0.88 x 10^-3 mm^2/s.
The coordinates of the ROC curve indicated that a mean ADC cutoff value of 0.88 x 10^-3 mm^2/s provided the optimal balance between sensitivity and specificity.
· True Positives (Adenocarcinoma correctly identified): 32 of 35 cases.
· False Negatives (Adenocarcinoma missed): 3 cases (all were low-grade, ISUP Grade Group 1 lesions located in the transition zone).
· True Negatives (Benign pathology correctly identified): 35 of 40 cases.
· False Positives (Benign cases misidentified as cancer): 5 cases (all presented with intense active chronic prostatitis on histopathology).
Using this cutoff of 0.88 x 10^-3 mm^2/s, the diagnostic performance parameters were calculated and are summarized in Table 2.
Table 2: Diagnostic performance parameters of mean ADC values at a cutoff of 0.88 x 10^-3 mm^2/s
|
Performance Parameter |
Value (%) |
Formula and Count |
|
Sensitivity |
91.4% |
(32 / 35) |
|
Specificity |
87.5% |
(35 / 40) |
|
Positive Predictive Value (PPV) |
86.5% |
(32 / 37) |
|
Negative Predictive Value (NPV) |
92.1% |
(35 / 38) |
|
Diagnostic Accuracy |
89.3% |
(67 / 75) |
|
Area Under the Curve (AUC) |
0.942 |
95% Confidence Interval: 0.891 to 0.993 |
Association between PI-RADS v2.1 and Histopathological Diagnosis
The distribution of benign and malignant diagnoses across the standardized PI-RADS v2.1 categories was analyzed. None of the patients had a PI-RADS score of 1. A score of 2 was assigned to 15 patients (all of whom had benign pathology, representing 100%). A score of 3 (equivocal) was observed in 18 cases, of which 14 (77.8%) were benign and 4 (22.2%) were malignant.
Among the high-suspicion categories, a PI-RADS score of 4 was assigned to 24 cases, showing malignant pathology in 15 cases (62.5%) and benign in 9 cases (37.5%). Finally, of the 18 cases categorized as PI-RADS 5, 16 (88.9%) were malignant and only 2 (11.1%) were benign.
The Chi-square test of independence demonstrated a statistically highly significant correlation between the PI-RADS score and the final histopathological outcome (Chi-square value = 32.41, degrees of freedom = 3, p-value less than 0.001), underscoring the reliability of the structured scoring system.
DISCUSSION:
The clinical differentiation of malignant prostatic lesions from benign prostatic hyperplasia and inflammatory conditions remains a persistent challenge in urological practice, particularly in aging male cohorts. In a busy tertiary referral center such as the Institute of Medical Sciences and SUM Hospital, Bhubaneswar, establishing a reliable, non-invasive imaging assay is essential to optimize patient pathways. This retrospective study of 75 patients validated the outstanding diagnostic capabilities of quantitative DWI and ADC measurements on a standard 1.5T MRI platform, showing a clear, statistically significant distinction between benign and malignant pathologies (p-value less than 0.001).
The biophysical principles underlying DWI explain this high diagnostic accuracy. In benign tissue such as BPH, the histological architecture consists of expanded glandular spaces lined by epithelial cells, with abundant stroma. Water molecules can move relatively freely within these large acini, resulting in rapid diffusion and high ADC values [12].
In contrast, prostate adenocarcinoma is characterized by a rapid proliferation of neoplastic cells that form compact, disorganized sheets or nests, obliterating the normal acinar spaces. This substantial reduction in the extracellular matrix and the high nuclear-to-cytoplasmic ratio severely restricts the microscopic motion of water molecules, producing marked hypointensity on ADC maps [13].
In our cohort, the mean ADC value of malignant lesions (0.74 plus or minus 0.12 x 10^-3 mm^2/s) was significantly lower than that of benign lesions (1.34 plus or minus 0.18 x 10^-3 mm^2/s). This finding is highly consistent with seminal radiology literature. For instance, Woodfield et al. [14] reported mean ADC values of 0.79 x 10^-3 mm^2/s for peripheral zone prostate cancer on a 1.5T scanner, which closely aligns with our results. Similarly, other international and national studies have consistently documented that malignant prostate lesions exhibit mean ADC values below 0.85 to 0.90 x 10^-3 mm^2/s, whereas benign stromal or glandular hyperplasia yields values well above 1.10 to 1.20 x 10^-3 mm^2/s [15].
The ROC analysis in our study identified an optimal ADC cutoff value of 0.88 x 10^-3 mm^2/s, providing a high sensitivity of 91.4% and a specificity of 87.5% (AUC = 0.942). This cutoff threshold is highly practical for clinical application. Choosing a cutoff around this value allows radiologists to minimize false-negative diagnoses, ensuring that clinically significant malignancies are not overlooked, while maintaining an acceptable false-positive rate to avoid unnecessary biopsies. A critical review of our false-positive and false-negative cases reveals valuable clinical insights. The five false-positive cases—where benign lesions were misclassified as malignant due to ADC values below the 0.88 x 10^-3 mm^2/s threshold—all demonstrated intense active chronic prostatitis on histopathology.
Inflammatory conditions are known to be primary mimickers of prostate cancer on mpMRI. The dense infiltration of inflammatory cells (such as lymphocytes, plasma cells, and histiocytes), tissue edema, and associated microvascular proliferation can lead to restricted diffusion, resulting in falsely low ADC values that overlap with malignant ranges [16]. This highlights a key limitation of relying solely on quantitative ADC; clinical context, including patient history, acute urinary symptoms, and serial PSA monitoring, must always be integrated. On the other hand, the three false-negative cases—where malignant lesions were missed because their ADC values exceeded 0.88 x 10^-3 mm^2/s—were all histopathologically confirmed as low-grade, ISUP Gleason Grade Group 1 (Gleason Score 3+3=6) adenocarcinomas. Low-grade tumors often retain a relatively well-differentiated glandular architecture with patent lumen structures, which permits moderate water diffusion.
As a result, low-grade lesions typically exhibit higher ADC values than high-grade tumors, representing a recognized pitfall of quantitative DWI [17]. Fortunately, because these tumors are typically indolent and often managed via active surveillance rather than aggressive surgery, missing them on initial DWI screening is unlikely to compromise short-term clinical outcomes. This study also confirmed the high diagnostic utility of the PI-RADS v2.1 scoring system. The progression of malignancy rates from PI-RADS 1-2 (0%), PI-RADS 3 (22.2%), PI-RADS 4 (62.5%), and PI-RADS 5 (88.9%) is closely aligned with the statistics reported in large-scale multi-center clinical trials [18].
Our findings indicate that while PI-RADS 4 and 5 lesions possess a very high likelihood of malignancy, PI-RADS 3 remains a highly challenging, equivocal category, with 22.2% of such lesions harboring cancer. In these equivocal cases, incorporating a strict quantitative ADC cutoff (e.g., assessing whether the mean ADC is below 0.88 x 10^-3 mm^2/s) can serve as a vital tie-breaker, helping clinicians decide whether to recommend immediate biopsy or opt for close surveillance.
From a clinical and public health perspective, establishing the reliability of 1.5T scanners for prostate cancer evaluation is crucial. Although 3T magnets provide superior image resolution and faster scan times, they are not universally accessible across semi-urban and rural areas of India. Our study demonstrates that when technical parameters are appropriately optimized and standardized protocols (like PI-RADS v2.1 and quantitative ADC map calculations) are followed, 1.5T scanners are highly effective, cost-efficient, and clinically robust. Utilizing quantitative DWI can help reduce the number of unnecessary TRUS biopsies, minimizing patient discomfort, reducing the risk of severe post-biopsy urosepsis, and lowering healthcare costs for patients in Eastern India.
We acknowledge several limitations in our study. First, the retrospective design carries inherent risks of selection bias, as only patients who underwent both MRI and histopathological assessment were included. Second, the sample size of 75 patients, while sufficient for statistical significance, is relatively modest and comes from a single institution. Large, multi-center prospective studies are needed to validate our established ADC cutoff value across diverse patient populations. Third, we did not assess inter-observer variability between the two performing radiologists, which could impact the reproducibility of ROI placement on ADC maps. Finally, histopathological confirmation was obtained primarily via TRUS-guided biopsy rather than whole-mount radical prostatectomy specimens for the entire cohort. Because biopsies are subject to sampling errors, there is a possibility of upgrading or downgrading of the Gleason scores upon final surgical resection.
Despite these limitations, our study provides robust, institution-specific evidence supporting the routine implementation of quantitative DWI in the clinical workflow for suspected prostate cancer. By combining structured PI-RADS v2.1 scoring with objective ADC measurements, radiologists at IMS and SUM Hospital and similar tertiary institutions can provide highly accurate, reproducible, and clinically actionable reports to referring urologists.
CONCLUSION:
This retrospective study confirms that quantitative diffusion-weighted MRI on a 1.5T scanner is a highly effective, non-invasive method for differentiating benign from malignant prostate lesions. Malignant prostatic adenocarcinoma is associated with significantly lower mean ADC values compared to benign pathologies like BPH and prostatitis.
An optimal ADC cutoff threshold of 0.88 x 10^-3 mm^2/s demonstrated high diagnostic sensitivity (91.4%) and specificity (87.5%), offering an objective parameter to assist in clinical decision-making. Incorporating standardized, quantitative ADC measurements alongside structured PI-RADS v2.1 scoring can improve diagnostic confidence, help avoid unnecessary invasive biopsies, and streamline the clinical management of prostate disease in tertiary healthcare settings.
REFERENCES:
1. Weinreb JC, Barentsz JO, Choyke PL, Cornud F, Haider MA, Macura KJ, Margolis DJ, Schnall MD, Shtern F, Tempany CM, Thoeny HC, Verma S. PI-RADS Prostate Imaging - Reporting and Data System: 2015, Version 2. European Urology. 2016;69(1):16-40.
2. Sung H, Ferlay J, Siegel RL, Laversanne M, Soerjomataram I, Jemal A, Bray F. Global Cancer Statistics 2020: GLOBOCAN Estimates of Incidence and Mortality Worldwide for 36 Cancers in 185 Countries. CA: A Cancer Journal for Clinicians. 2021;71(3):209-249.
3. Turkbey B, Mani H, Shah V, Rastinehad AR, Bernardo M, Pohida T, Pang Y, Albert PS, McKinney YL, Ehrman V, Dahut W, Lobo J, Tomaszewski JE, Kaushal A, Pinto PA, Choyke PL, Kurdziel KA. Multiparametric 3T Prostate Magnetic Resonance Imaging to Detect Prostate Cancer: Active Surveillance Implications. The Journal of Urology. 2013;189(3):848-855.
4. Woodfield CA, Tung GA, Grand DJ, Pezzullo JA, Machan JT, Mayo-Smith WW. Diffusion-weighted MRI of peripheral zone prostate cancer: comparison of tumor and normal prostate ADC values on a 1.5T system. American Journal of Roentgenology. 2010;194(2):W316-W322.
5. Verma S, Rajesh A, Morales H, Latha L, Bagga HS, Westphalen AC, Coakley FV. Overview of the Prostate Imaging Reporting and Data System (PI-RADS). American Journal of Roentgenology. 2012;198(6):1366-1377.
6. Barentsz JO, Richenberg J, Clements R, Choyke P, Verma S, Villeirs G, Rouviere O, Logager V, Futterer JJ. ESUR prostate MR guidelines 2012. European Radiology. 2012;22(4):746-757.
7. Tamada T, Sone T, Jo Y, Yamamoto A, Ito K. Apparent diffusion coefficient values in peripheral and transition zones of the prostate as a function of age. Journal of Magnetic Resonance Imaging. 2011;34(3):662-667.
8. Haas GP, Delongchamps N, Brawley OW, Wang CY, de Tubianilla G. The worldwide epidemiology of prostate cancer: perspectives on geographic, temporal, and racial differences. The Canadian Journal of Urology. 2008;15(1):3866-3871.
9. Epstein JI, Egevad L, Amin MB, Delahunt B, Srigley JR, Humphrey PA. The 2014 International Society of Urological Pathology (ISUP) Consensus Conference on Gleason Grading of Prostatic Carcinoma: One-year later. The American Journal of Surgical Pathology. 2016;40(2):244-252.
10. Wang L, Muzi M, Brinkmann F, Cheng SC, Kibel AS, Tempany C, Sandrasegaran K. Accuracy of multiparametric magnetic resonance imaging for diagnosing prostate cancer: a systematic review and meta-analysis. BMC Cancer. 2018;18(1):624-635.
11. Boesen L, Nørgaard N, Løgager V, Chabanova E, Baco E, Thomsen HS. Assessment of Parametric and Multiparametric MRI for Prostate Cancer Detection: A Multicenter Diagnostic Study. JAMA Network Open. 2019;2(8):e1911438.
12. Padhani AR, Liu G, Koh DM, Chenevert TL, Thoeny HC, Takahara T, Barentsz JO, Anwar KK, Sennfaub MR. Diffusion-weighted magnetic resonance imaging as a cancer biomarker: consensus and recommendations. Neoplasia. 2009;11(2):102-125.
13. de Souza GR, de Souza MD, Rodrigues AD, Lima AC, de Oliveira CD. Diffusion-weighted magnetic resonance imaging of the prostate: correlation of apparent diffusion coefficient values with Gleason score in peripheral zone tumors. Radiologia Brasileira. 2014;47(4):224-229.
14. Langer DL, van der Kwast TH, Evans AJ, Plotkin A, Trachtenberg J, Wilson BC, Haider MA. Prostate cancer detection with quantitative T2 mapping, diffusion-weighted imaging, and dynamic contrast-enhanced MRI: Coregistration with whole-mount histopathology. Radiology. 2009;250(3):793-802.
15. Hambrock T, Somford DM, Huisman HJ, van Oort IM, Barentsz JO, Hulsbergen-van de Kaa CA, Futterer JJ. Relationship between apparent diffusion coefficients at 3.0-T MR imaging and Gleason grade in peripheral zone prostate cancer. Radiology. 2011;259(2):453-461.
16. Nagel DR, Schouten MG, Hambrock T, Litjens GJ, Hoeks CM, ten Haken B, Barentsz JO, Futterer JJ. Differentiation of Prostatitis, Benign Prostatic Hyperplasia, and Prostate Cancer Using Diffusion-Weighted Imaging. Investigative Radiology. 2013;48(11):773-781.
17. Koo JH, Kim CK, Choi D, Park BK, Sim KC, Kim JH. Diffusion-weighted MRI of the prostate: comparison of b-value combinations for the calculation of apparent diffusion coefficient maps in cancer detection. Journal of Magnetic Resonance Imaging. 2013;38(3):607-614.
18. Giles SL, Morgan VA, deSouza NM. Is there a role for quantitative diffusion-weighted MRI in evaluating the prostate transition zone? American Journal of Roentgenology. 2011;197(5):W871-W878.