Association of Emerging Biomarkers with HbA1c and Glycaemic Control Among Patients with Type 2 Diabetes Mellitus: A Comparative Observational Study.
- Ankit Abhishek , Senior Resident, Department of General Medicine, R.I.M.S, Ranchi, Jharkhand, India.
- Reema Verma , Junior Resident, Department of Obstetrics & Gynaecology, R.I.M.S, Ranchi, Jharkhand, India.
- Rishi Tuhin Guria , Additional Professor, Department of General Medicine, R.I.M.S, Ranchi, Jharkhand, India.
Article Information:
Abstract:
Background: Type 2 diabetes mellitus is a chronic metabolic disorder characterized by persistent hyperglycaemia and progressive development of microvascular and macrovascular complications. Glycated haemoglobin (HbA1c) remains the standard biomarker for assessment of long-term glycaemic control; however, its interpretation may be influenced by factors affecting erythrocyte lifespan and haemoglobin metabolism. Emerging biomarkers such as fructosamine, glycated albumin, high-sensitivity C-reactive protein (hs-CRP), and adiponectin may provide additional information regarding short-term glycaemic variation, inflammation, and metabolic dysfunction. Objectives: To evaluate the association of HbA1c with selected emerging biomarkers and assess their clinical relevance in determining glycaemic control and metabolic abnormalities among patients with type 2 diabetes mellitus. Materials and Methods: This hospital-based observational comparative study was conducted in the Department of Biochemistry in collaboration with the Department of Medicine at Rajendra Institute of Medical Sciences (R.I.M.S), Ranchi, Jharkhand, from November 2024 to November 2025. A total of 120 patients with established type 2 diabetes mellitus were enrolled according to predefined inclusion and exclusion criteria. Clinical parameters and biochemical measurements including HbA1c, fructosamine, glycated albumin, hs-CRP, and adiponectin were evaluated using standardized laboratory methods. Correlation between HbA1c and other biomarkers was assessed using Pearson or Spearman correlation analysis as appropriate. Receiver operating characteristic (ROC) curve analysis was performed to evaluate the predictive performance of selected biomarkers for identifying poor glycaemic control. Results: HbA1c demonstrated a significant positive correlation with fructosamine and glycated albumin levels, indicating their association with glycaemic status. Patients with higher HbA1c values showed significantly increased fructosamine, glycated albumin, and hs-CRP levels compared with those having better glycaemic control (p<0.05). Adiponectin levels demonstrated an inverse association with HbA1c and markers of metabolic dysfunction. ROC analysis demonstrated that selected biomarkers showed potential predictive performance for identifying poor glycaemic control among patients with established type 2 diabetes mellitus. Combined evaluation of glycaemic and inflammatory biomarkers provided additional information regarding metabolic alterations among patients with type 2 diabetes mellitus. Conclusion: HbA1c remains an important marker for long-term glycaemic monitoring; however, complementary biomarkers including fructosamine, glycated albumin, hs-CRP, and adiponectin may improve assessment of short-term glycaemic variation and associated metabolic abnormalities. Combined biomarker evaluation may enhance clinical characterization and risk assessment among patients with type 2 diabetes mellitus.
Keywords:
Article :
INTRODUCTION:
Diabetes mellitus is a chronic metabolic disorder characterized by persistent hyperglycaemia resulting from impaired insulin secretion, insulin resistance, or a combination of both. It is associated with progressive metabolic disturbances and an increased risk of microvascular and macrovascular complications. Accurate assessment of glycaemic control plays a crucial role in preventing disease progression and optimizing therapeutic strategies among affected individuals.¹
Glycated haemoglobin (HbA1c) is an established biomarker for evaluating long-term glycaemic control as it reflects the average blood glucose concentration over approximately the preceding 2–3 months. Due to its clinical utility and standardization, HbA1c is widely used for monitoring patients with diabetes mellitus.² However, HbA1c values may be influenced by factors affecting erythrocyte turnover, haemoglobin variants, anaemia, and other clinical conditions, which may limit its interpretation in certain situations.³
Fructosamine and glycated albumin are alternative glycation biomarkers that reflect shorter periods of glycaemic exposure, generally representing glucose fluctuations over the previous 2–4 weeks. These markers may provide additional information regarding recent changes in glycaemic status and may be particularly useful when HbA1c does not completely reflect current metabolic conditions.⁴
Apart from hyperglycaemia, chronic low-grade inflammation and altered adipose tissue function contribute significantly to the pathogenesis and progression of type 2 diabetes mellitus. High-sensitivity C-reactive protein (hs-CRP), an inflammatory biomarker, has been associated with insulin resistance, metabolic dysfunction, and increased risk of diabetes-related complications.⁵ Adiponectin, an adipocyte-derived hormone involved in glucose and lipid metabolism, enhances insulin sensitivity, and reduced circulating adiponectin levels have been linked with obesity, insulin resistance, and metabolic abnormalities.⁶
The combined assessment of HbA1c with emerging biomarkers may provide a broader understanding of glycaemic control, inflammatory status, and metabolic alterations among patients with diabetes mellitus. Correlation analysis between these parameters may help determine whether these biomarkers provide clinically relevant information beyond conventional glycaemic assessment.⁷
Receiver operating characteristic (ROC) curve analysis is a statistical approach used to evaluate the predictive performance of biomarkers in identifying specific clinical states. In patients with diabetes mellitus, ROC analysis may help determine the ability of emerging biomarkers to identify individuals with poor glycaemic control rather than serving as diagnostic tools for diabetes itself.⁸
Although HbA1c remains the cornerstone biomarker for long-term glycaemic monitoring, additional markers such as fructosamine, glycated albumin, hs-CRP, and adiponectin may provide complementary information regarding short-term glycaemic variation and associated metabolic abnormalities. Therefore, the present study was undertaken to evaluate the association of HbA1c with selected emerging biomarkers and assess their clinical relevance in relation to glycaemic control among patients with type 2 diabetes mellitus.
MATERIALS AND METHODS:
Study Design
The present study was designed as a hospital-based observational comparative study to evaluate the association between glycated haemoglobin (HbA1c) and selected emerging biomarkers, including fructosamine, glycated albumin, high-sensitivity C-reactive protein (hs-CRP), and adiponectin, among patients with type 2 diabetes mellitus.
Study Setting and Duration
The study was conducted in the Department of Biochemistry in collaboration with the Department of Medicine, Rajendra Institute of Medical Sciences (R.I.M.S), Ranchi, Jharkhand. The study was carried out from 15 November 2024 to 14 November 2025.
Study Population
The study population included patients with previously diagnosed type 2 diabetes mellitus attending the outpatient and inpatient services of the Department of Medicine. Patients fulfilling the predefined inclusion and exclusion criteria were enrolled in the study.
Sample Size
The sample size was calculated based on the prevalence of poor glycaemic control among patients with type 2 diabetes mellitus reported in previous studies. Fekadu et al. reported that 64.9% of patients with type 2 diabetes mellitus had poor glycaemic control [20]. Considering a 95% confidence level and an absolute precision of 9%, the minimum required sample size was calculated using the formula:
n = Z²PQ / d²
whereZ=1.96, p=64.9%, q=35.1%, and d=9%. The calculated sample size was approximately 109. To improve the precision and reliability of the study findings, a total of 120 patients were included in the study.
Inclusion Criteria
Participants were included based on the following criteria:
• Patients diagnosed with type 2 diabetes mellitus according to standard clinical and biochemical criteria.
• Age ≥18 years.
• Patients willing to participate and provide written informed consent.
• Patients with available clinical history and relevant laboratory investigations.
Exclusion Criteria
Participants were excluded if they had:
• Acute infection or active inflammatory conditions at the time of sample collection.
• Chronic kidney disease, chronic liver disease, or other systemic disorders likely to affect biomarker levels.
• Haematological disorders or conditions affecting HbA1c interpretation.
• Recent blood transfusion.
• Incomplete clinical or biochemical data.
• Refusal to participate in the study.
Ethical Considerations
The study was conducted in accordance with the principles of the Declaration of Helsinki. Written informed consent was obtained from all participants before enrolment, and confidentiality of patient information was maintained throughout the study.
Clinical and Demographic Data Collection
Detailed clinical and demographic information was collected using a structured data collection proforma.
The following parameters were recorded:
• Age
• Sex
• Duration of diabetes mellitus
• Treatment history
• Anthropometric parameters including body mass index (BMI), wherever available
• Relevant clinical history and laboratory findings
Sample Collection
Approximately 5 ml of peripheral venous blood was collected from each participant under aseptic precautions.
The collected blood sample was appropriately processed for estimation of:
• HbA1c
• Fructosamine
• Glycated albumin
• High-sensitivity C-reactive protein (hs-CRP)
• Adiponectin
• Serum/plasma samples were separated and analysed according to standard laboratory procedures.
Laboratory Analysis
HbA1c estimation was performed using a standardized laboratory method. Serum fructosamine, glycated albumin, high-sensitivity C-reactive protein (hs-CRP), and adiponectin were measured using commercially available validated assay kits according to the manufacturer's instructions.
The assay principle, kit manufacturer details, analyzer model, calibration procedures, and intra- and inter-assay coefficients of variation were documented according to laboratory quality control protocols.
All biochemical analyses were performed under standardized conditions with appropriate internal quality control measures to ensure analytical accuracy and reproducibility.
Categorization According to Glycaemic Control
Participants were categorized according to HbA1c values into:
• Good glycaemic control group: HbA1c <7%
• Moderate glycaemic control group: HbA1c 7–9%
• Poor glycaemic control group: HbA1c >9%
• These categories were used for comparative analysis of biomarker levels.
Outcome Measures
Primary Outcome
To evaluate the correlation between HbA1c and selected emerging biomarkers among patients with type 2 diabetes mellitus.
Secondary Outcomes
• To compare fructosamine, glycated albumin, hs-CRP, and adiponectin levels according to glycaemic control categories.
• To assess the association between inflammatory/metabolic biomarkers and HbA1c levels.
• To evaluate the predictive performance of selected biomarkers for identifying poor glycaemic control using ROC curve analysis.
Statistical Analysis
Data were entered into Microsoft Excel and analysed using appropriate statistical software.
Continuous variables were expressed as mean ± standard deviation or median with interquartile range depending on data distribution. Categorical variables were presented as frequency and percentage.
Normality of distribution was assessed using appropriate statistical tests.
Correlation between HbA1c and other biomarkers was evaluated using Pearson or Spearman correlation analysis depending on data distribution.
Comparison of biomarker levels between groups was performed using Student’s t-test, Mann–Whitney U test, or analysis of variance (ANOVA) as appropriate.
ROC curve analysis was performed to determine the predictive performance of selected biomarkers for identifying poor glycaemic control. Area under the curve (AUC), sensitivity, specificity, and optimal cut-off values were calculated wherever applicable.
Multiple linear regression analysis was performed to evaluate independent associations between biomarkers and HbA1c after adjustment for potential confounding factors including age, sex, BMI, duration of diabetes, and treatment status.
A p-value <0.05 was considered statistically significant.
RESULTS:
A total of 120 patients with established type 2 diabetes mellitus were included in the present observational study. The demographic characteristics, glycaemic parameters, emerging biomarkers, and correlation analyses were evaluated. Participants were categorized according to HbA1c levels into good glycaemic control (<7%), moderate glycaemic control (7–9%), and poor glycaemic control (>9%) groups.
Demographic and Clinical Characteristics of Study Participants
The mean age of the study population was 56.8 ± 10.4 years. Among the participants, 68 (56.7%) were males and 52 (43.3%) were females. The mean duration of diabetes was 8.2 ± 4.6 years. Based on HbA1c categories, 32 (26.7%) participants had good glycaemic control, 48 (40.0%) had moderate glycaemic control, and 40 (33.3%) had poor glycaemic control. The demographic and clinical characteristics of study participants are presented in Table 1.
Table 1. Demographic and Clinical Characteristics of Study Participants
|
Parameter |
Value |
|
Total participants |
120 |
|
Mean age (years) |
56.8 ± 10.4 |
|
Male |
68 (56.7%) |
|
Female |
52 (43.3%) |
|
Mean duration of diabetes (years) |
8.2 ± 4.6 |
|
HbA1c <7% |
32 (26.7%) |
|
HbA1c 7–9% |
48 (40.0%) |
|
HbA1c >9% |
40 (33.3%) |
Comparison of Biomarkers According to Glycaemic Control
The levels of HbA1c and emerging biomarkers showed significant variation across different glycaemic control categories. Participants with poor glycaemic control demonstrated significantly higher levels of fructosamine, glycated albumin, and hs-CRP compared with participants having good glycaemic control (p<0.001). Adiponectin levels showed a decreasing trend with worsening glycaemic control, indicating an inverse association with metabolic dysfunction. The comparison of biomarker levels among HbA1c groups is presented in Table 2.
Table 2. Biomarker Levels According to HbA1c Categories
|
Biomarker |
HbA1c <7% (n=32) |
HbA1c 7–9% (n=48) |
HbA1c >9% (n=40) |
p-value |
|
HbA1c (%) |
6.4 ± 0.4 |
8.1 ± 0.6 |
10.4 ± 1.1 |
<0.001 |
|
Fructosamine (µmol/L) |
258.4 ± 34.6 |
318.7 ± 42.5 |
372.6 ± 48.8 |
<0.001 |
|
Glycated albumin (%) |
14.2 ± 2.1 |
19.3 ± 3.0 |
24.8 ± 4.1 |
<0.001 |
|
hs-CRP (mg/L) |
2.1 ± 0.9 |
3.8 ± 1.5 |
6.2 ± 2.4 |
<0.001 |
|
Adiponectin (µg/ml) |
12.6 ± 3.4 |
9.8 ± 2.7 |
7.1 ± 2.3 |
<0.001 |
Figure 1 illustrates the comparison of mean biomarker levels across different HbA1c-based glycaemic control categories.
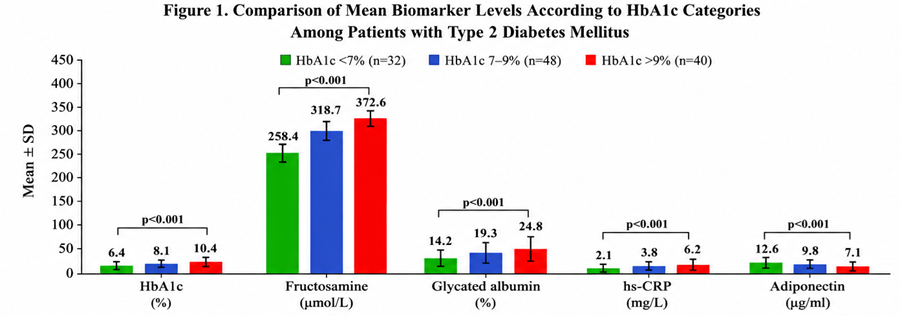
Figure 1: Comparison of Mean Biomarker Levels According to HbA1c Categories Among Patients with Type 2 Diabetes Mellitus.
Correlation Between HbA1c and Emerging Biomarkers
Correlation analysis demonstrated a significant positive correlation between HbA1c and fructosamine (r=0.78, p<0.001) and between HbA1c and glycated albumin (r=0.74, p<0.001).
HbA1c also showed a significant positive correlation with hs-CRP (r=0.46, p<0.001), suggesting an association between poor glycaemic control and inflammatory status.
A significant negative correlation was observed between HbA1c and adiponectin levels (r=−0.41, p<0.001).
The correlation analysis is presented in Table 3.
Table 3. Correlation of HbA1c with Emerging Biomarkers
|
Biomarker |
Correlation coefficient (r) |
95% CI |
p-value |
|
HbA1c vsFructosamine |
0.78 |
0.69–0.85 |
<0.001 |
|
HbA1c vsGlycated albumin |
0.74 |
0.63–0.82 |
<0.001 |
|
HbA1c vshs-CRP |
0.46 |
0.31–0.59 |
<0.001 |
|
HbA1c vsAdiponectin |
−0.41 |
−0.55 to −0.25 |
<0.001 |
Predictive Performance of Biomarkers for Poor Glycaemic Control
ROC curve analysis was performed to evaluate the predictive performance of selected biomarkers for identifying patients with poor glycaemic control (HbA1c >9%) among individuals with established type 2 diabetes mellitus. Fructosamine and glycated albumin demonstrated good predictive ability, whereas hs-CRP showed moderate predictive performance. The ROC analysis parameters are presented in Table 4 and Figure 2.
Table 4. ROC Analysis of Biomarkers for Identifying Poor Glycaemic Control
|
Biomarker |
Cut-off value |
AUC (95% CI) |
Sensitivity |
Specificity |
p-value |
|
Fructosamine |
>340 µmol/L |
0.86 (0.78–0.92) |
82.5% |
78.8% |
<0.001 |
|
Glycated albumin |
>21% |
0.84 (0.76–0.91) |
80.0% |
76.3% |
<0.001 |
|
hs-CRP |
>4 mg/L |
0.71 (0.61–0.80) |
70.0% |
65.0% |
0.002 |
|
Adiponectin |
<8 µg/ml |
0.69 (0.59–0.79) |
67.5% |
63.8% |
0.004 |
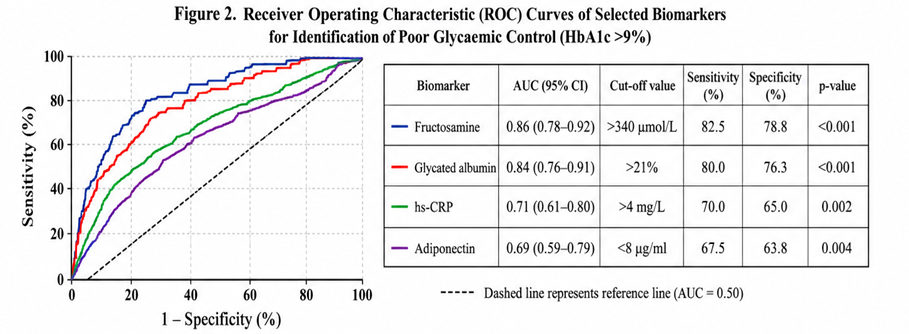
Figure 2. Receiver Operating Characteristic (ROC) Curves of Selected Biomarkers for Identification of Poor Glycaemic Control
Multiple Linear Regression Analysis
Multiple Linear Regression Analysis was performed to identify independent factors associated with HbA1c levels after adjustment for age, sex, BMI, duration of diabetes, and biomarker levels. Fructosamine and glycated albumin remained significantly associated with HbA1c after adjustment.
The regression analysis is presented in Table 5.
Table 5. Multiple Linear Regression Analysis for Factors Associated with HbA1c
|
Variable |
Adjusted β coefficient |
95% CI |
p-value |
|
Age |
0.08 |
−0.02–0.18 |
0.12 |
|
Sex |
0.05 |
−0.09–0.19 |
0.48 |
|
BMI |
0.11 |
0.02–0.21 |
0.02 |
|
Diabetes duration |
0.16 |
0.05–0.27 |
0.004 |
|
Fructosamine |
0.52 |
0.39–0.65 |
<0.001 |
|
Glycated albumin |
0.38 |
0.24–0.51 |
<0.001 |
|
hs-CRP |
0.18 |
0.06–0.31 |
0.005 |
|
Adiponectin |
−0.14 |
−0.25 to −0.03 |
0.01 |
Overall, fructosamine and glycated albumin showed the strongest association with HbA1c, supporting their role as complementary biomarkers for assessment of glycaemic control among patients with type 2 diabetes mellitus.
CONCLUSION:
HbA1c remains an important biomarker for long-term assessment of glycaemic control among patients with type 2 diabetes mellitus. In the present study, fructosamine and glycated albumin showed significant association with HbA1c, suggesting their usefulness as complementary indicators of recent glycaemic variations.
The association of hs-CRP and adiponectin with HbA1c highlights the contribution of inflammatory and metabolic alterations in diabetes progression. Combined assessment of glycaemic, inflammatory, and metabolic biomarkers may provide additional information regarding metabolic status and help in better clinical characterization of patients with type 2 diabetes mellitus.
Further large-scale longitudinal studies are required to establish the long-term clinical utility of these biomarkers in routine diabetes management.
REFERENCES:
1. American Diabetes Association Professional Practice Committee. Standards of Care in Diabetes—2024. Diabetes Care. 2024;47(Suppl 1):S1-S321.
2. Sherwani SI, Khan HA, Ekhzaimy A, Masood A, Sakharkar MK. Significance of HbA1c test in diagnosis and prognosis of diabetic patients. Biomark Insights. 2016;11:95-104.
3. Weykamp C. HbA1c: a review of analytical and clinical aspects. Ann Lab Med. 2013;33(6):393-400.
4. Danese E, Montagnana M, Nouvenne A, Lippi G. Advantages and pitfalls of fructosamine and glycated albumin in the diagnosis and treatment of diabetes. ClinChem Lab Med. 2015;53(12):1773-1778.
5. Pickup JC. Inflammation and activated innate immunity in the pathogenesis of type 2 diabetes. Diabetes Care. 2004;27(3):813-823.
6. Kadowaki T, Yamauchi T. Adiponectin and adiponectin receptors. Endocr Rev. 2005;26(3):439-451.
7. Selvin E, Rawlings AM, Grams M, Klein R, Sharrett AR, Steffes M, et al. Fructosamine and glycated albumin and the risk of cardiovascular outcomes and death. Circulation. 2015;132(4):269-277.
8. Hajian-Tilaki K. Receiver operating characteristic (ROC) curve analysis for medical diagnostic test evaluation. Caspian J Intern Med. 2013;4(2):627-635.
9. Saisho Y. Glycemic variability and oxidative stress: a link between diabetes and cardiovascular disease? Int J Mol Sci. 2014;15(10):18381-18406.
10. Koga M, Kasayama S. Clinical impact of glycated albumin as another glycemic control marker. Endocr J. 2010;57(9):751-762.
11. Selvin E, Francis LM, Ballantyne CM, Hoogeveen RC, Coresh J, Brancati FL. Nontraditional markers of glycemia: associations with microvascular conditions. Diabetes Care. 2011;34(4):960-967.
12. Herder C, Carstensen M, Ouwens DM. Anti-inflammatory cytokines and risk of type 2 diabetes. Diabetes ObesMetab. 2013;15(Suppl 3):39-50.
13. Pradhan AD, Manson JE, Rifai N, Buring JE, Ridker PM. C-reactive protein, interleukin-6, and risk of developing type 2 diabetes mellitus. JAMA. 2001;286(3):327-334.
14. Hotta K, Funahashi T, Arita Y, Takahashi M, Matsuda M, Okamoto Y, et al. Plasma concentrations of a novel adipose-specific protein, adiponectin, in type 2 diabetic patients. ArteriosclerThrombVasc Biol. 2000;20(6):1595-1599.
15. Spranger J, Kroke A, Möhlig M, Bergmann MM, Ristow M, Boeing H, et al. Adiponectin and protection against type 2 diabetes mellitus. Lancet. 2003;361(9353):226-228.
16. Selvin E, Rawlings AM, Lutsey PL, Maruthur N, Pankow JS, Steffes M, et al. Fructosamine and glycated albumin and risk of mortality and clinical outcomes in diabetes. Diabetes Care. 2015;38(4):635-643.
17. Sacks DB. Measurement of hemoglobin A1c: a new twist on the path to harmony. Diabetes Care. 2012;35(12):2674-2680.
18. Ouchi N, Parker JL, Lugus JJ, Walsh K. Adipokines in inflammation and metabolic disease. Nat Rev Immunol. 2011;11(2):85-97.
19. Emdin CA, Khera AV, Natarajan P, Klarin D, Won HH, Peloso GM, et al. Genetic association of C-reactive protein with cardiovascular disease. N Engl J Med. 2017;377(11):1111-1120.
20. Fekadu G, Bula K, Bayisa G, Turi E, Tolossa T, Kasaye HK. Challenges and factors associated with poor glycemic control among type 2 diabetes mellitus patients at Nekemte Referral Hospital, Western Ethiopia. J MultidiscipHealthc. 2019;12:963-974.