COMPARISON OF PROPHYLACTIC LOW DOSE EPINEPHRINE AND PHENYLEPHRINE INFUSION ON MATERNAL HEMODYNAMICS DURING SPINAL ANAESTHESIA FOR ELECTIVE CESAREAN SECTION– A PROSPECTIVE, RANDOMIZED, DOUBLE BLIND STUDY.
- Somarani Saniel , Assistant Professor, MBBS, MD, Department of Anaesthesiology, Deben Mahata Govt. Medical College, Purulia.
- Kuntal Malik , Assistant professor, MBBS, MD (Anaesthesiology), Department of Anaesthesia, Deben Mahata Govt. Medical College, Purulia.
- Manisha Dey , Senior Resident, MD Anesthesiology, Department of Anesthesiology, Deben Mahata Govt. Medical College, Purulia.
Article Information:
Abstract:
Introduction: Spinal anaesthesia, introduced by Karl August Bier, is widely used for caesarean section due to safety over general anaesthesia. However, it causes hypotension from sympathetic blockade, reducing venous return and cardiac output. Phenylephrine may cause bradycardia; epinephrine may improve haemodynamic stability. This study compares both infusions. Aims: This study compares low-dose epinephrine and phenylephrine infusions for preventing spinal hypotension, assessing maternal haemodynamics, side effects, and neonatal outcomes. Materials and methods: The present study was a prospective, randomized, double blinded study. This Study was conducted for 12 months. Department of Anaesthesiology, Deben Mahata Govt. Medical College, Purulia. Study population 150. Result: Baseline variables were comparable between Group E and Group P: age (24.57 ± 2.78 vs 24.85 ± 2.93 years; p = 0.552), weight (68.69 ± 6.41 vs 68.13 ± 3.92 kg; p = 0.523), BMI (26.83 ± 2.60 vs 26.18 ± 1.25 kg/m²; p = 0.055), and gestational age (38.01 ± 0.77 vs 37.87 ± 0.72 weeks; p = 0.234). Adverse effects differed, with tachycardia (6 vs 0; p = 0.0124), bradycardia (0 vs 7; p = 0.0067), and hypotension/vasopressor need significantly higher in Group P (p = 0.0099, 0.0104), while SBP and DBP remained comparable throughout. Conclusion: On the basis of our study, we can conclude that prophylactic low dose of epinephrine may be more appropriate than phenylephrine in preventing spinal-induced hypotension during caesarean delivery with fewer maternal and neonatal side effects.
Keywords:
Article :
INTRODUCTION:
In 1898, Karl August Bier introduced spinal anaesthesia into clinical practice [1], and it has since become the preferred method for caesarean sections. This preference is largely due to its ability to avoid many of the risks associated with general anaesthesia, such as aspiration, difficult intubation, and adverse effects on the foetus. [2] Nonetheless, the most common complication of spinal anaesthesia is hypotension, which results from the blockade of pre-ganglionic sympathetic fibres. This drop in blood pressure can compromise systemic circulation and lead to various maternal issues, including nausea, vomiting, dizziness, bradycardia, loss of consciousness, apnoea, aspiration pneumonia, and even cardiorespiratory arrest. When hypotension is profound and persistent, it may also cause uteroplacental insufficiency, potentially resulting in foetal complications like hypoxia, acidosis, bradycardia, and stillbirth. [3]
For over 50 years, researchers have focused on post-spinal hypotension in caesarean sections because of its serious implications for both the mother and the foetus. [4] As a result, considerable efforts have been made to prevent and manage this condition. The underlying mechanism involves several pathophysiological processes, with the most critical being a rapid onset of sympatholytic. In pregnant women, nerve fibres are more sensitive to local anaesthetics, and there is an elevated baseline level of sympathetic activity relative to parasympathetic activity. When sympatholysis occurs, it causes significant peripheral vasodilation and a shift toward parasympathetic dominance. This change decreases venous return and cardiac preload, which can lead to bradycardia, nausea, and vomiting. [5-7] The reduced preload further diminishes cardiac output, exacerbating systemic hypotension—a situation worsened by the additional factor of aortocaval compression. Moreover, a more extensive sympathetic block impairs the baroreceptor-mediated compensatory responses, thereby increasing the likelihood of cardioinhibitory reflexes such as the Bezold-Jarisch reflex, which can ultimately lead to cardiac arrest and death. Various vasopressors have already been tried with phenylephrine being the ideal one. However, phenylephrine has its own limitations that is dose dependent reflex bradycardia and reduced cardiac output. [8-11]
Furthermore, sometimes phenylephrine and norepinephrine might not be available [12], therefore alternative vasopressors should be researched. Since there is limited data present on safety and efficacy of Epinephrine for prophylaxis and treatment of spinal hypotension.
This study is done to compare the effect of low dose epinephrine infusion with phenylephrine on maternal hemodynamics during spinal anaesthesia for elective caesarean section.Epinephrine (also known as adrenaline) is a catecholamine that functions as both a hormone and a neurotransmitter. It is endogenously produced by the adrenal medulla and exogenously administered in various clinical scenarios. Its ability to stimulate both alpha- and beta-adrenergic receptors underpins its wide range of physiological and pharmacological effects. [13]
Epinephrine is a potent sympathomimetic agent with both alpha- and beta-adrenergic effects, making it an effective tool for managing hypotension. Its pharmacokinetic profile—with rapid onset and short half-life—allows for prompt and controllable responses to the hemodynamic challenges posed by spinal anaesthesia. By inducing vasoconstriction and enhancing cardiac output, epinephrine plays a critical role in preventing and treating spinal-induced hypotension, thereby improving maternal and foetal outcomes during procedures such as caesarean sections.
MATERIALS AND METHODS:
Study design: A prospective, randomized, double blinded study
Place of study: Department of Anaesthesiology, Deben Mahata Govt. Medical College, Purulia
Period of study: 12 Months
Sample size: 150 patients.
Inclusion Criteria:
• Patients giving valid consent
• All ASA criteria II
• Elective LSCS
• Patient between 18 to 35 years of age
• Term singleton pregnancy
Exclusion Criteria:
• Patient’s refusal.
• Patients with medical complications like diabetes, CVA, cardio respiratory disease, hepatic, renal or endocrine disease.
• Obstetric complications like breech presentation, twin pregnancy, placenta previa, placental abruption, pregnancy induced hypertension (PIH).
• Patients with autonomic neuropathy, spinal deformity or coagulation abnormality.
• Patients with neonatal compromise like foetal bradycardia meconium stained liquor, IUGR.
• Failed spinal ,repeat spinal, patchy spinal, Conversion to general anaesthesia at any moment of surgery is excluded from study.
• Patient with history of allergy to study drugs
• Height <140 cm and >180 cm
• Weight <50kg and >100kg.
Study Variable:
1. Age and BMI of patient
2. Name and duration of surgery
3. SBP,DBP,MAP
4. Respiratory rate and oxygen saturation
5. Incidence of bradycardia, tachycardia and hypotension
6. Time for rescue dose of bolus vasopressor
7. Cumulative total dose of vasopressor used
8. Incidence of nausea, vomiting, shivering
9. Level of sensory and motor blockade
10. Foetal APGAR scores
11. Umbilical cord blood pH and gas analysis
Statistical Analysis: For statistical analysis, data were initially entered into a Microsoft Excel spreadsheet and then analyzed using SPSS (version 27.0; SPSS Inc., Chicago, IL, USA) and GraphPad Prism (version 5). Numerical variables were summarized using means and standard deviations, while Data were entered into Excel and analyzed using SPSS and GraphPad Prism.
Numerical variables were summarized using means and standard deviations, while categorical variables were described with counts and percentages. Two-sample t-tests were used to compare independent groups, while paired t-tests accounted for correlations in paired data. Chi-square tests (including Fisher’s exact test for small sample sizes) were used for categorical data comparisons. P-values ≤ 0.05 were considered statistically significant.
RESULTS:
Table 1: Baseline Demographic, Anthropometric, Obstetric, and Sociocultural Characteristics of the Study Population
|
Variable |
Group E (Mean ± SD / n) |
Group P (Mean ± SD / n) |
P value |
Significance |
|
Age (years) |
24.57 ± 2.78 |
24.85 ± 2.93 |
0.552 |
Not significant |
|
Weight (kg) |
68.69 ± 6.41 |
68.13 ± 3.92 |
0.523 |
Not significant |
|
Height (cm) |
160.13 ± 5.38 |
161.35 ± 4.45 |
0.137 |
Not significant |
|
Body Mass Index (kg/m²) |
26.83 ± 2.60 |
26.18 ± 1.25 |
0.055 |
Not significant |
|
Gestational Age (weeks) |
38.01 ± 0.77 |
37.87 ± 0.72 |
0.234 |
Not significant |
|
Duration of Surgery (min) |
58.35 ± 3.28 |
57.53 ± 2.01 |
0.071 |
Not significant |
|
Religion – Hindu, n (%) |
41 (54.7%) |
38 (50.7%) |
0.6237 |
Not significant |
|
Religion – Muslim, n (%) |
34 (45.3%) |
37 (49.3%) |
||
|
Total |
75 |
75 |
|
|
Table 2: Comparison of Adverse Effects between Study Groups
|
|
Adverse Effect |
Group E (n=75) |
Group P (n=75) |
Total (n=150) |
Chi-square Value |
P value |
Significance |
|
Nausea |
Present |
7 |
12 |
19 |
1.5066 |
0.2197 |
Not significant |
|
Absent |
68 |
63 |
131 |
||||
|
Vomiting |
Present |
0 |
3 |
3 |
3.0612 |
0.8096 |
Not significant |
|
Absent |
75 |
72 |
147 |
||||
|
Shivering |
Present |
2 |
3 |
5 |
0.2069 |
0.6492 |
Not significant |
|
Absent |
73 |
72 |
145 |
||||
|
Tachycardia |
Present |
6 |
0 |
6 |
6.25 |
0.0124 |
Significant |
|
Absent |
69 |
75 |
144 |
||||
|
Bradycardia |
Present |
0 |
7 |
7 |
7.3427 |
0.0067 |
Significant |
|
Absent |
75 |
68 |
143 |
||||
|
Hypertension |
Present |
4 |
0 |
4 |
4.1096 |
0.0426 |
Significant |
|
Absent |
71 |
75 |
146 |
Table 3: Comparison of Hypotensive Episodes and Vasopressor Requirements Between the Study Groups
|
|
Variable |
Group E (n=75) |
Group P (n=75) |
Total (n=150) |
Chi-square Value |
P value |
Significance |
|
Number of Hypotensive Episodes |
None |
73 |
62 |
135 |
9.2296 |
0.0099 |
Significant |
|
1 episode |
2 |
10 |
12 |
||||
|
2 episodes |
0 |
3 |
3 |
||||
|
Number of Vasopressor Boluses |
None |
73 |
62 |
135 |
9.1271 |
0.0104 |
Significant |
|
1 dose |
2 |
11 |
13 |
||||
|
2 doses |
0 |
2 |
2 |
Table 4: Comparison of Umbilical Artery Blood Gas Analysis Between the Study Groups.
|
Umbilical Artery Blood Gas Parameter |
Group E Mean ± SD |
Group P Mean ± SD |
P value |
Significance |
|
pH |
7.32 ± 0.01 |
7.33 ± 0.01 |
0.08 |
Not significant |
|
pO₂ (mm Hg) |
26.29 ± 1.12 |
26.73 ± 1.65 |
0.058 |
Not significant |
|
pCO₂ (mm Hg) |
39.88 ± 1.39 |
39.34 ± 2.07 |
0.066 |
Not significant |
|
HCO₃ (mEq/L) |
21.94 ± 1.00 |
22.31 ± 1.34 |
0.06 |
Not significant |
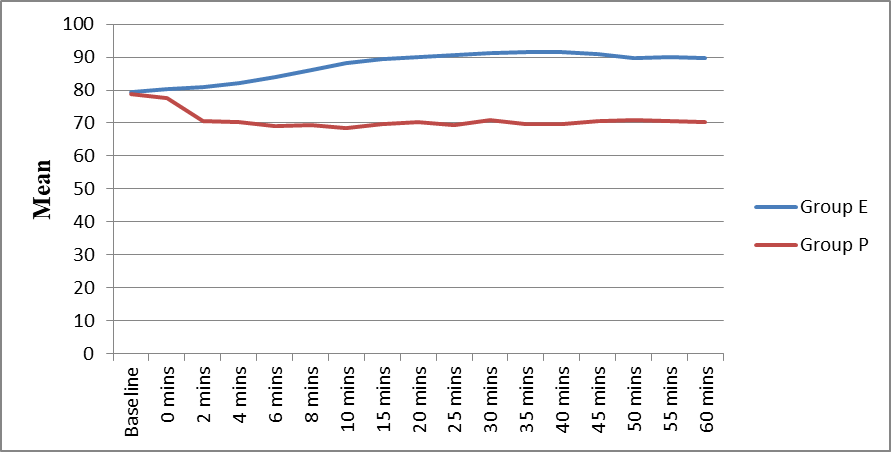
Figure 1: Distribution of Heart Rate (HR in beats/min) in groups at different time intervals.
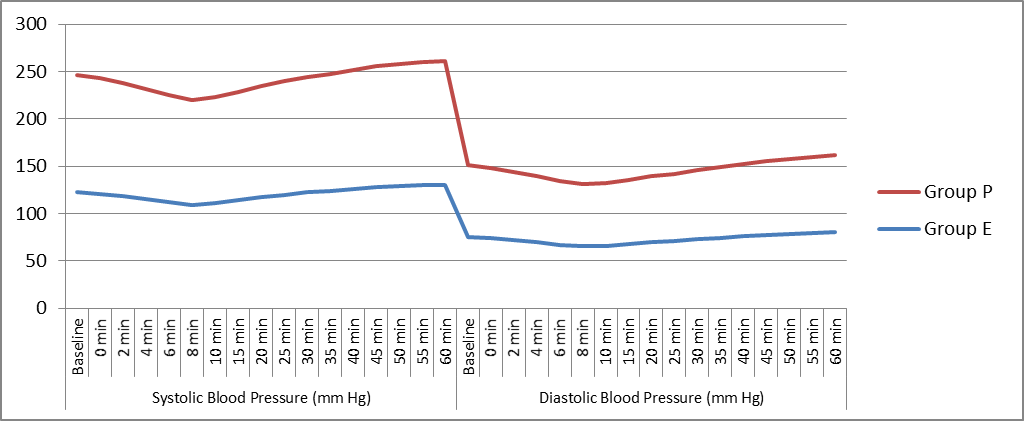
Figure 2: Comparison of Systolic and Diastolic Blood Pressure Between the Study Groups Over Time
In our study, the mean age was 24.57 ± 2.78 years in Group E and 24.85 ± 2.93 years in Group P, with no significant difference (p = 0.552). The mean weight was 68.69 ± 6.41 kg in Group E and 68.13 ± 3.92 kg in Group P (p = 0.523), and the mean height was 160.13 ± 5.38 cm vs 161.35 ± 4.45 cm (p = 0.137), with no significant difference. The mean BMI was 26.83 ± 2.60 kg/m² in Group E and 26.18 ± 1.25 kg/m² in Group P, showing no significant difference (p = 0.055). The mean gestational age was 38.01 ± 0.77 weeks in Group E and 37.87 ± 0.72 weeks in Group P, showing no significant difference (p = 0.234), and the mean duration of surgery was 58.35 ± 3.28 minutes vs 57.53 ± 2.01 minutes (p = 0.071), both not significant. Religion distribution was also similar between groups, with Hindu (54.7% vs 50.7%) and Muslim (45.3% vs 49.3%), showing no significant difference (p = 0.6237) (Table 1).
In our study, nausea was seen in 7 patients in Group E and 12 patients in Group P, with no significant difference (p = 0.2197). Vomiting occurred in 3 patients in Group P, which was also not significant (p = 0.8096). Shivering was observed in 2 patients in Group E and 3 patients in Group P, with no significant difference (p = 0.6492). However, tachycardia was significantly higher in Group E 6 patients with significant difference (p = 0.0124). Bradycardia was seen only in Group P 7 patients, showing a significant difference (p = 0.0067). Hypertension was observed in 4 patients in Group E, which was also significant (p = 0.0426) (Table 2).
In our study, most patients had no hypotensive episodes in both groups. However, Group P had more hypotensive episodes compared to Group E, with a statistically significant difference (p = 0.0099). In Group E, 2 patients had 1 episode, while in Group P, 62 had no episodes, 10 had 1 episode, and 3 had 2 episodes. Similarly, for the number of vasopressor boluses, Group P required more doses compared to Group E, and this difference was statistically significant (p = 0.0104). In Group E, 2 required 1 dose, whereas in Group P, 11 required 1 dose, and 2 required 2 doses (Table 3).
In our study, the umbilical artery blood gas parameters were similar between both groups. The pH was 7.32 ± 0.01 in Group E and 7.33 ± 0.01 in Group P, with no significant difference (p = 0.08). The pO₂ was 26.29 ± 1.12 mm Hg in Group E and 26.73 ± 1.65 mm Hg in Group P, with no significant difference (p = 0.058). The pCO₂ values were 39.88 ± 1.39 mm Hg in Group E and 39.34 ± 2.07 mm Hg in Group P, with no significant difference (p = 0.066), and the HCO₃ levels were 21.94 ± 1.00 mEq/L vs 22.31 ± 1.34 mEq/L, with no significant difference (p = 0.06) (Table 4).
In our study, the baseline mean value was 79.49 ± 6.09 in Group E and 78.92 ± 5.25 in Group P, with no significant difference (p = 0.541). At 0 min, the values were 80.39 ± 6.55 vs 77.64 ± 10.59, with no significant difference (p = 0.06). At 2 min, the values were 80.91 ± 7.40 vs 70.72 ± 7.31 with significant difference (p < 0.001). At 4 min, 82.00 ± 9.17 vs 70.21 ± 7.22, with significant difference (p < 0.001). At 6 min, 84.03 ± 9.35 vs 69.13 ± 7.26, with significant difference (p < 0.001). At 8 min, 86.01 ± 9.58 vs 69.45 ± 8.82, with significant difference (p < 0.001). At 10 min, 88.09 ± 9.58 vs 68.44 ± 7.72, with significant difference (p < 0.001). At 15 min, the values were 89.49 ± 9.50 vs 69.63 ± 7.15, with significant difference (p < 0.001). At 20 min, 90.16 ± 10.08 vs 70.16 ± 6.88, with significant difference (p < 0.001). At 25 min, 90.68 ± 10.19 vs 69.51 ± 7.02, with significant difference (p < 0.001). At 30 min, 91.24 ± 9.44 vs 70.97 ± 7.23, with significant difference (p < 0.001). At 35 min, the values were 91.45 ± 9.22 vs 69.65 ± 6.49, with significant difference (p < 0.001). At 40 min, 91.43 ± 8.45 vs 69.72 ± 6.91, with significant difference (p < 0.001). At 45 min, 91.00 ± 7.39 vs 70.56 ± 7.46, with significant difference (p < 0.001). At 50 min, 89.80 ± 6.94 vs 71.00 ± 6.94, with significant difference (p < 0.001). At 55 min, 89.91 ± 6.74 vs 70.57 ± 6.78, with significant difference (p < 0.001). At 60 min, 89.79 ± 5.76 vs 70.15 ± 7.15, with significant difference (p < 0.001) (Figure 1).
In our study, the systolic blood pressure (SBP) was comparable between Group E and Group P at all time points. At baseline, SBP was 122.20 ± 8.01 mmHg vs 123.65 ± 7.64 mmHg (p = 0.261). At 0 min, it was 120.73 ± 7.98 vs 122.00 ± 7.79 (p = 0.33). At 2 min, 118.05 ± 7.95 vs 119.31 ± 8.14 (p = 0.345). At 4 min, 115.01 ± 8.23 vs 116.35 ± 8.98 (p = 0.348). At 6 min, 112.19 ± 8.14 vs 113.24 ± 9.78 (p = 0.477). At 8 min, 109.40 ± 8.08 vs 110.12 ± 10.11 (p = 0.633). At 10 min, 111.08 ± 6.44 vs 111.52 ± 9.42 (p = 0.741). At later time points, SBP remained similar: at 15 min (114.07 ± 5.92 vs 114.49 ± 8.80, p = 0.73), 20 min (117.09 ± 5.66 vs 117.35 ± 8.19, p = 0.827), 25 min (119.83 ± 5.54 vs 119.72 ± 8.20, p = 0.926), 30 min (122.28 ± 5.52 vs 121.87 ± 8.11, p = 0.718), 35 min (123.95 ± 5.40 vs 123.72 ± 8.05, p = 0.841), 40 min (125.96 ± 5.25 vs 125.88 ± 7.96, p = 0.943), 45 min (127.79 ± 5.12 vs 127.63 ± 7.42, p = 0.879), 50 min (128.53 ± 4.76 vs 129.12 ± 7.05, p = 0.554), 55 min (129.63 ± 5.46 vs 130.44 ± 7.38, p = 0.447), and 60 min (130.19 ± 4.99 vs 131.16 ± 6.22, p = 0.295).
There was no statistically significant difference in SBP between the groups at any time point. Similarly, diastolic blood pressure (DBP) showed no significant difference between groups at all time points. At baseline, DBP was 75.19 ± 6.64 vs 75.55 ± 6.86 (p = 0.746). At 0 min, 73.99 ± 6.74 vs 74.29 ± 7.23 (p = 0.79). At 2 min, 71.79 ± 6.78 vs 72.13 ± 7.71 (p = 0.772). At 4 min, 69.44 ± 7.07 vs 70.00 ± 7.73 (p = 0.646). At 6 min, 67.15 ± 7.00 vs 67.68 ± 8.14 (p = 0.67). At 8 min, 65.37 ± 6.49 vs 65.56 ± 8.06 (p = 0.877). At 10 min, 65.68 ± 5.73 vs 66.04 ± 7.88 (p = 0.751). At later time points, DBP remained comparable: at 15 min (67.25 ± 5.60 vs 68.15 ± 7.19, p = 0.401), 20 min (69.55 ± 5.39 vs 69.65 ± 6.87, p = 0.916), 25 min (71.24 ± 5.13 vs 70.91 ± 6.50, p = 0.73), 30 min (72.88 ± 5.38 vs 72.57 ± 6.50, p = 0.755), 35 min (74.48 ± 5.03 vs 74.48 ± 6.27, p = 1.00), 40 min (75.91 ± 4.94 vs 76.11 ± 5.98, p = 0.825), 45 min (77.48 ± 4.77 vs 77.51 ± 5.67, p = 0.975), 50 min (78.56 ± 4.74 vs 79.08 ± 5.44, p = 0.536), 55 min (79.72 ± 4.83 vs 80.45 ± 5.44, p = 0.387), and 60 min (80.48 ± 4.40 vs 81.45 ± 4.97, p = 0.209). There was no statistically significant difference in DBP between the two groups throughout the study period (Figure 2).
DISCUSSION:
In the present study, baseline demographic and obstetric variables were comparable between Group E and Group P, including mean age (24.57 ± 2.78 vs 24.85 ± 2.93 years; p = 0.552), weight (68.69 ± 6.41 vs 68.13 ± 3.92 kg; p = 0.523), height (160.13 ± 5.38 vs 161.35 ± 4.45 cm; p = 0.137), BMI (26.83 ± 2.60 vs 26.18 ± 1.25 kg/m²; p = 0.055), gestational age (38.01 ± 0.77 vs 37.87 ± 0.72 weeks; p = 0.234), duration of surgery (58.35 ± 3.28 vs 57.53 ± 2.01 minutes; p = 0.071), and religion distribution (p = 0.6237), ensuring adequate randomization and homogeneity of study groups Kee WD et al. [14].
The incidence of adverse effects showed a clear difference in haemodynamic profile between groups. Nausea (7 vs 12; p = 0.2197), vomiting (0 vs 3; p = 0.8096), and shivering (2 vs 3; p = 0.6492) were comparable. However, tachycardia was significantly higher in Group E (6 patients; p = 0.0124), while bradycardia occurred exclusively in Group P (7 patients; p = 0.0067). Hypertension was also more frequent in Group E (4 patients; p = 0.0426). These findings reflect the pharmacological profile of epinephrine, which has beta-adrenergic chronotropic effects, and phenylephrine, which is associated with reflex bradycardia due to pure alpha-agonism Singh D et al. [15], Nag DS et al. [16].
Regarding hypotension, Group P demonstrated a higher number of hypotensive episodes compared to Group E, with statistically significant difference (p = 0.0099). In Group E, only 2 patients had 1 episode, whereas in Group P, 62 had no episodes, 10 had 1 episode, and 3 had 2 episodes. Similarly, vasopressor requirement was higher in Group P (11 required 1 dose, 2 required 2 doses; p = 0.0104), while Group E showed minimal requirement (2 required 1 dose). This suggests that low-dose epinephrine infusion provided more stable haemodynamics compared to phenylephrine, possibly due to combined inotropic and vasoconstrictive effects Adigun TA et al. [17], Butwick AJ et al. [18].
Umbilical cord blood gas analysis showed no significant difference between groups. pH values were 7.32 ± 0.01 vs 7.33 ± 0.01 (p = 0.08), pO₂ 26.29 ± 1.12 vs 26.73 ± 1.65 mm Hg (p = 0.058), pCO₂ 39.88 ± 1.39 vs 39.34 ± 2.07 mm Hg (p = 0.066), and HCO₃ 21.94 ± 1.00 vs 22.31 ± 1.34 mEq/L (p = 0.06), indicating that both regimens maintained adequate foetal acid–base status without clinically significant compromise Patil SS et al. [19].
Haemodynamic trends showed that mean heart rate was similar at baseline (79.49 ± 6.09 vs 78.92 ± 5.25; p = 0.541) and at 0 min (80.39 ± 6.55 vs 77.64 ± 10.59; p = 0.06), but from 2 min onwards, Group E maintained significantly higher heart rate compared to Group P: 2 min (80.91 ± 7.40 vs 70.72 ± 7.31; p < 0.001), 4 min (82.00 ± 9.17 vs 70.21 ± 7.22; p < 0.001), 6 min (84.03 ± 9.35 vs 69.13 ± 7.26; p < 0.001), 8 min (86.01 ± 9.58 vs 69.45 ± 8.82; p < 0.001), 10 min (88.09 ± 9.58 vs 68.44 ± 7.72; p < 0.001), 15 min (89.49 ± 9.50 vs 69.63 ± 7.15; p < 0.001), 20 min (90.16 ± 10.08 vs 70.16 ± 6.88; p < 0.001), 25 min (90.68 ± 10.19 vs 69.51 ± 7.02; p < 0.001), 30 min (91.24 ± 9.44 vs 70.97 ± 7.23; p < 0.001), 35 min (91.45 ± 9.22 vs 69.65 ± 6.49; p < 0.001), 40 min (91.43 ± 8.45 vs 69.72 ± 6.91; p < 0.001), 45 min (91.00 ± 7.39 vs 70.56 ± 7.46; p < 0.001), 50 min (89.80 ± 6.94 vs 71.00 ± 6.94; p < 0.001), 55 min (89.91 ± 6.74 vs 70.57 ± 6.78; p < 0.001), and 60 min (89.79 ± 5.76 vs 70.15 ± 7.15; p < 0.001), indicating sustained haemodynamic support with epinephrine infusion Lee A et al. [20].
Systolic blood pressure remained comparable throughout the study: baseline (122.20 ± 8.01 vs 123.65 ± 7.64 mmHg; p = 0.261), 0 min (120.73 ± 7.98 vs 122.00 ± 7.79; p = 0.33), 2 min (118.05 ± 7.95 vs 119.31 ± 8.14; p = 0.345), 4 min (115.01 ± 8.23 vs 116.35 ± 8.98; p = 0.348), 6 min (112.19 ± 8.14 vs 113.24 ± 9.78; p = 0.477), 8 min (109.40 ± 8.08 vs 110.12 ± 10.11; p = 0.633), 10 min (111.08 ± 6.44 vs 111.52 ± 9.42; p = 0.741), 15 min (114.07 ± 5.92 vs 114.49 ± 8.80; p = 0.73), 20 min (117.09 ± 5.66 vs 117.35 ± 8.19; p = 0.827), 25 min (119.83 ± 5.54 vs 119.72 ± 8.20; p = 0.926), 30 min (122.28 ± 5.52 vs 121.87 ± 8.11; p = 0.718), 35 min (123.95 ± 5.40 vs 123.72 ± 8.05; p = 0.841), 40 min (125.96 ± 5.25 vs 125.88 ± 7.96; p = 0.943), 45 min (127.79 ± 5.12 vs 127.63 ± 7.42; p = 0.879), 50 min (128.53 ± 4.76 vs 129.12 ± 7.05; p = 0.554), 55 min (129.63 ± 5.46 vs 130.44 ± 7.38; p = 0.447), and 60 min (130.19 ± 4.99 vs 131.16 ± 6.22; p = 0.295).
Diastolic blood pressure also showed no significant differences at all time points: baseline (75.19 ± 6.64 vs 75.55 ± 6.86; p = 0.746), 0 min (73.99 ± 6.74 vs 74.29 ± 7.23; p = 0.79), 2 min (71.79 ± 6.78 vs 72.13 ± 7.71; p = 0.772), 4 min (69.44 ± 7.07 vs 70.00 ± 7.73; p = 0.646), 6 min (67.15 ± 7.00 vs 67.68 ± 8.14; p = 0.67), 8 min (65.37 ± 6.49 vs 65.56 ± 8.06; p = 0.877), 10 min (65.68 ± 5.73 vs 66.04 ± 7.88; p = 0.751), 15 min (67.25 ± 5.60 vs 68.15 ± 7.19; p = 0.401), 20 min (69.55 ± 5.39 vs 69.65 ± 6.87; p = 0.916), 25 min (71.24 ± 5.13 vs 70.91 ± 6.50; p = 0.73), 30 min (72.88 ± 5.38 vs 72.57 ± 6.50; p = 0.755), 35 min (74.48 ± 5.03 vs 74.48 ± 6.27; p = 1.00), 40 min (75.91 ± 4.94 vs 76.11 ± 5.98; p = 0.825), 45 min (77.48 ± 4.77 vs 77.51 ± 5.67; p = 0.975), 50 min (78.56 ± 4.74 vs 79.08 ± 5.44; p = 0.536), 55 min (79.72 ± 4.83 vs 80.45 ± 5.44; p = 0.387), and 60 min (80.48 ± 4.40 vs 81.45 ± 4.97; p = 0.209), confirming stable blood pressure profiles in both groups Lee A et al. [20].
CONCLUSION:
Prophylactic low-dose epinephrine infusion is an effective alternative to phenylephrine for maintaining maternal haemodynamic stability during spinal anaesthesia for elective caesarean section. Although both drugs provided comparable systolic and diastolic blood pressure control and similar neonatal outcomes, epinephrine was associated with fewer hypotensive episodes and reduced vasopressor requirement. However, it showed a higher incidence of tachycardia, while phenylephrine was associated with bradycardia and greater hypotension. Low-dose epinephrine may be considered a suitable option for preventing spinal-induced hypotension with acceptable maternal and neonatal safety profiles.
REFERENCES:
1. Parameswara G. Spinal epidural to combined spinal epidural analgesia the history of central neuraxial block. Indian J Anaesth 2001; 45: 406-12.
2. Spinal Anesthesia - NYSORA [Internet]. NYSORA. 2022 [cited 14 October 2022]. Available from: https://www.nysora.com/techniques/neuraxial-and-perineuraxialtechniques/spinal-anesthesia/ .
3. Corke BC, Datta S, Ostheimer GW, Weiss JB, Alper MH. Spinal anaesthesia for caesarean section. The influence of hypotension on neonatal outcome. Anaesthesia. 1982; 37: 658-62.
4. Kennedy RL, Friedman DL, Katcka DM, Selmants S, Smith RN. Hypotension during obstetrical anaesthesia. Anaesthesiology. 1959; 20: 153-5.
5. Šklebar I, Bujas T, Habek D. Spinal Anaesthesia-induced Hypotension in Obstetrics:
a. Prevention and Therapy. Acta Clin Croat. 2019; 58: 90-94.
6. Kestin IG. Spinal anaesthesia in obstetrics. Br J Anaesth. 1991; 66: 596-607.
7. Salinas FV, Sueda LA, Liu SS. Physiology of spinal anaesthesia and practical suggestions for successful spinal anaesthesia. Best Pract Res Clin Anaesthesiol. 2003; 17(3): 289-303.
8. Ngan Kee WD , Lee A, Khaw KS, et al . A randomized double blinded comparison of Phenylephrine and ephedrine infusion combinations to maintain blood pressure during spinal anesthesia for cesarean delivery: the effects on fetal acid base status and hemodynamic control. Anesth Analg. 2008;107:1295-1302
9. Ngan Kee WD , Khaw KS ,Ng FF , et al. Prophylactic Phenylephrine infusion for preventing hypotension during spinal anesthesia for cesarean section delivery. Anesth Analg.2004; 98:815-821.
10. Langesaeter E, Roseland LA , Stubhaug A. Continuous invasive blood pressure and cardiac output monitoring during cesarean delivery: a randomized, double blind comparison of low dose versus high dose spinal anesthesia with intravenous Phenylephrine or placebo infusion. Anesthesiology. 2008; 109: 856-863.
11. Wang X, Shen X, Liu S, et al. The efficacy and safety of norepinephrine and its feasibility as a replacement for Phenylephrine to manage maternal hypotension during elective cesarean delivery under spinal anesthesia. Biomedical Res Int. 2018; 2018: 1869189.
12. Vail E, Gershengorn HB, Hua M, Walked AJ, Rubenfeld G,Wunsch H. Association between US norepinephrine shortage and mortality among patients with septic shock. JAMA 2017;317:1433-42.
13. Motiejunaite J, Amar L, Vidal-Petiot E. Adrenergic receptors and cardiovascular effects of catecholamines. Ann Endocrinol (Paris). 2021 Jun;82(3-4):193-197.
14. Kee WD. The use of vasopressors during spinal anaesthesia for caesarean section. Current Opinion in Anesthesiology. 2017 Jun 1;30(3):319-25.
15. Singh D, Yadav JB, Singh AK, Rai MK, Rai M. Comparing the effect of phenylephrine bolus and phenylephrine infusion for maintaining arterial blood pressure during cesarean delivery under spinal anesthesia: a randomized prospective study. Cureus. 2023 Jul 31;15(7).
16. Nag DS, Samaddar DP, Chatterjee A, Kumar H, Dembla A. Vasopressors in obstetric anesthesia: A current perspective. World Journal of Clinical Cases: WJCC. 2015 Jan 16;3(1):58.
17. Adigun TA. Comparison of intravenous ephedrine with phenylephrine for the maintenance of arterial blood pressure during elective caesarean section under spinal anaesthesia. Faculty of Anaesthesia. 2018 Sep 15.
18. Butwick AJ, Columb MO, Carvalho B. Preventing spinal hypotension during Caesarean delivery: what is the latest?. British Journal of Anaesthesia. 2015 Feb 1;114(2):183-6.
19. Patil SS, Rath S, George CE. Study on umbilical cord arterial blood gas analysis and cord blood lactate levels as predictors for adverse neonatal outcome: an observational study. International Journal of Reproduction, Contraception, Obstetrics and Gynecology. 2018 Apr 1;7(4):1494-501.
20. Lee A, Kee WN. Effects of vasoactive medications and maternal positioning during cesarean delivery on maternal hemodynamics and neonatal acid–base status. Clinics in Perinatology. 2019 Dec 1;46(4):765-83.