Applications of BMI and BSA - A Retrospective Study.
- Geetha J , Professor, Department of Anaesthesia, Dhanalakshmi Srinivasan Medical College and Hospital, Siruvachur, Perambalur, Tamil Nadu, India.
- Dharana T. , CRMI INTERN, Department of Anaesthesia, Dhanalakshmi Srinivasan Medical College and Hospital, Siruvachur, Perambalur, Tamil Nadu, India.
- Dhanasekar M , CRMI INTERN, Department of Anaesthesia, Dhanalakshmi Srinivasan Medical College and Hospital, Siruvachur, Perambalur, Tamil Nadu, India.
- Guru Prasanth S , CRMI INTERN, Department of Anaesthesia, Dhanalakshmi Srinivasan Medical College and Hospital, Siruvachur, Perambalur, Tamil Nadu, India.
- Prasanth Arivazhagan , Postgraduate of Anaesthesia, Dhanalakshmi Srinivasan medical college, Siruvachur, Perambalur, Tamil Nadu, India.
Article Information:
Abstract:
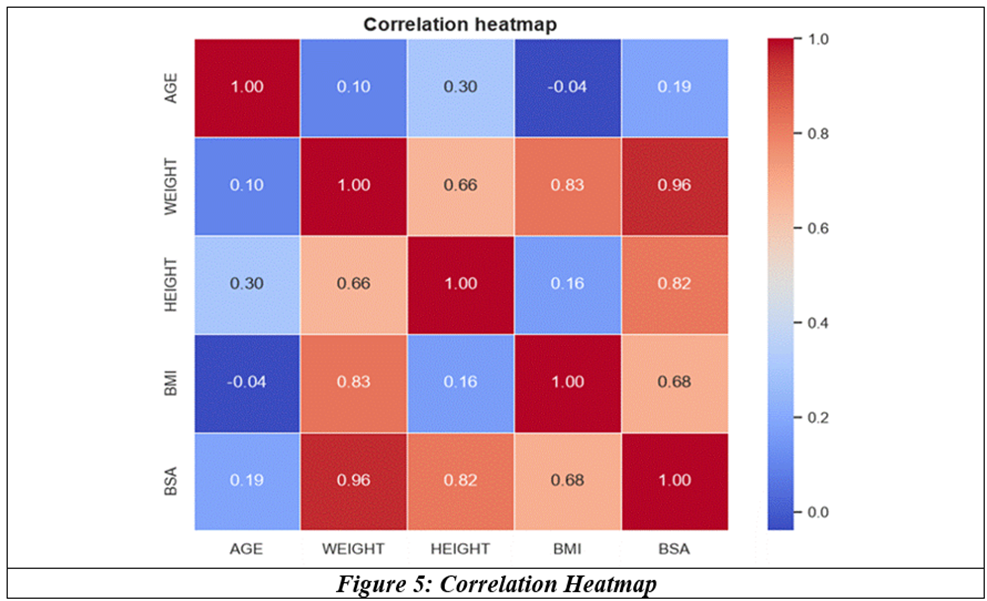
INTRODUCTION: General examination of any patient routinely includes age, gender, height and weight. The two derived factors of clinical significance from height and weight are body mass index body surface area. Increasing public health awareness and rising trend of childhood obesity with fitness centres, Body mass index as an indicator and Prognosticator became popular. Increased risk of lifestyle illness could be predicted by BMI and metabolically active area was represented by BSA. Both BMI and BSA were derived from height and weight but by the different operations. In this study BMI and BSA were calculated over a wide range of patients and analysed. MATERIALS AND METHODS: Study: Retrospective observational clinical study. Study Population: All inpatients admitted across various medical and surgical departments of various age groups and both genders. Study Period: March 2026 to April 2026. Study Sample: Convenient sample of Hundred for the short study. Study Parameters: Age, Gender, Weight, Height, Diagnosis, BMI, BSA. Method: Case records of hundred inpatients of various departments in the said study period were included in the study. The patient demographic data with diagnosis were noted. BMI was calculated by the formula weight in kilograms divided by height square in meters. BSA was calculated by the formula square root of product of height and weight divided by 3600. All the parameters for the hundred patients were tabulated and analysed. RESULTS: The numeric summary gives the overall range/spread of age, weight, height, BMI, and BSA across the full cohort. The department counts show which specialty contributed the most patients to this dataset, namely: Ophthalmology, Urology, Obstetrics. BMI had a higher range in females, whereas BSA had a higher range in males. BMI and BSA are both derived from weight and height, but they combined differently. BMI and BSA are correlated but not redundant. BMI captures heaviness, whereas BSA represents absolute body size. The correlation coefficient quantifies how tightly linked they are in this cohort -a moderate but imperfect r(r ≈ 0.68) confirms they carry complementary rather than duplicate information, (relevant for drug dosing decisions, which often use a BSA specifically rather than BMI). BMI Median: 22.7 (Male), 24.1 (Female) Mann–Whitney U p = 0.15. CONCLUSION: Clinical significance of the parameter must be considered in holistic manner and individualised, keeping in mind the situation in which BMI or BSA are taken alone BMI and a BSA could be misleading regarding clinical decision. Drug dosing and graft area calculation could be with BSA whereas morbid obesity and fat distribution could affect outcome with BMI calculation. BMI and BSA are complementary to each other(r=0.68).
Keywords:
Article :
INTRODUCTION:
Lifestyle disorders and childhood obesity have been on the increasing trend in the last decade. Apart from healthcare professional gymnasia and other health clubs plan workouts elaborating on body mass index (BMI). Both body mass index and body surface area depend on the two parameters namely height and weight. While body mass index gives an idea of appropriate weight for height and suggests probability of illnesses at risk, body surface area suggests the metabolically active parameter of an individual .Body mass index as gain awareness among the public stimulating researches by statisticians, community medical sociologists and even engineering graduates to derive various formula and methodology to calculate BMI with knee height in patients who cannot stand, amputees and facial anthropometry applications which computerisation respectively.
In this study the students have been encouraged to calculate BMI and BSA for around 100 patients across various Inpatient wards, critical care units with various age groups to understand the similarities and differences between the two parameters and enumerate various applications of BMI and BSA.
Aim
1. To evaluate applications of both BMI and BSA.
2. To calculate body mass index and body surface area from case record across various departments.
3. To correlate BMI, BSA and the diagnosis to attach significance of the parameters.
MATERIALS AND METHODS:
Study
Retrospective observational clinical study.
Study Population
All inpatients admitted across various medical and surgical departments of various age groups and both genders.
Study Period
March 2026 to April 2026.
Study Sample
Convenient sample of Hundred for the short study.
Study Parameters
Age, Gender, Weight, Height, Diagnosis, BMI, BSA.
Method
Case records of hundred inpatients of various departments in the said study period were included in the study. The patient demographic data with diagnosis were noted. BMI was calculated by the formula weight in kilograms divided by height square in meters. BSA was calculated by the formula square root of product of height and weight divided by 3600. All the parameters for the hundred patients were tabulated and analysed.
RESULTS:
Age group of the sample extended from two years to eighty years. Most of the patients occupied the 50 to 65 years age group. The weight of the study population ranged from 10 kg to 100kg, with most patients between 50-75 kg.
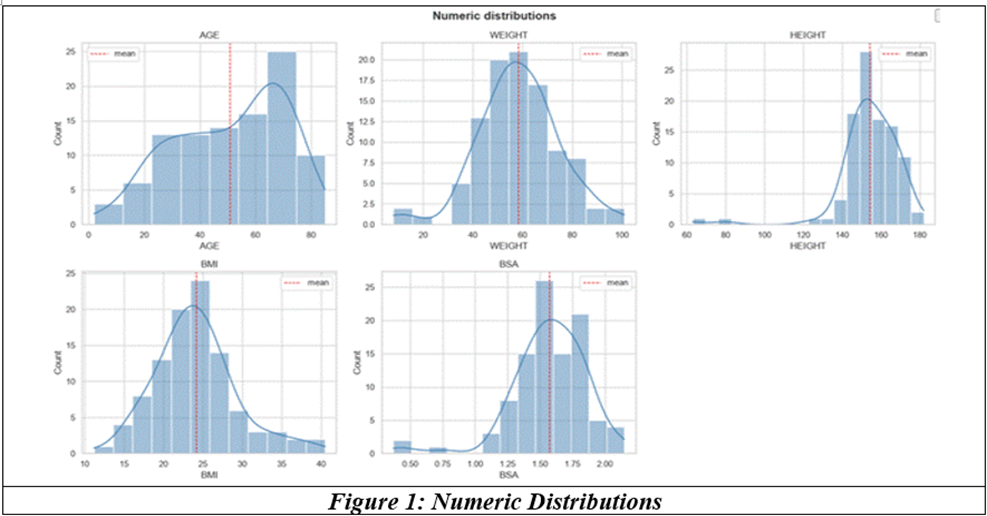
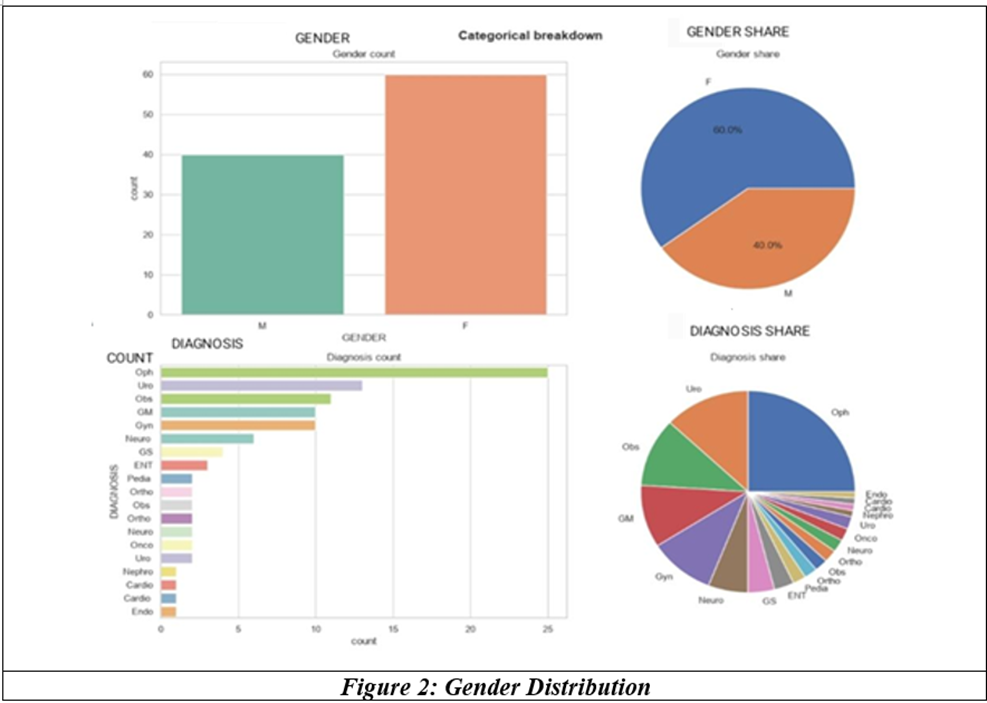
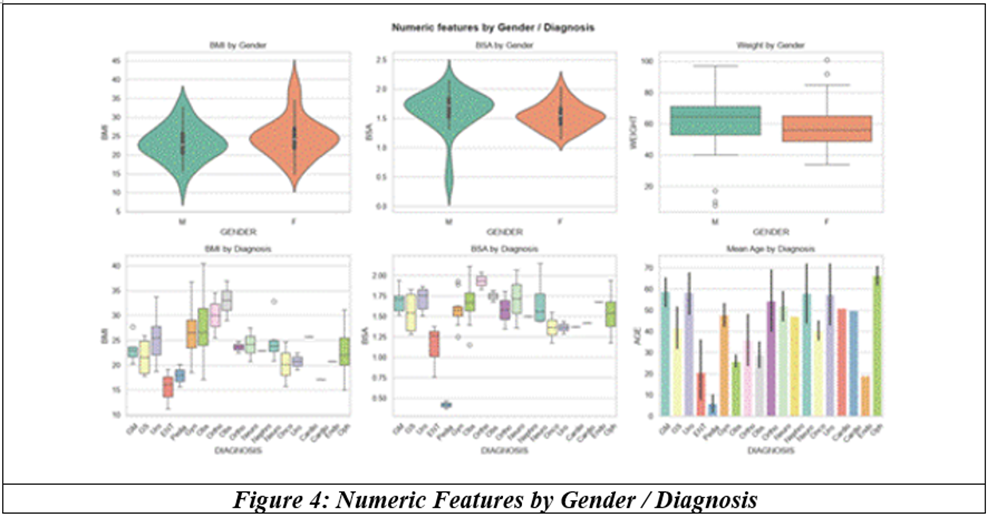
The height ranged from 120 to 180 cm, peaking at 150 cm. BMI ranged from 10 to 40 and peaked around 24. BSA ranges from 0.5 to 2. Elderly ophthalmic patients for cataract extraction dominated the population. BMI was higher in females and BSA ranged widely in males.
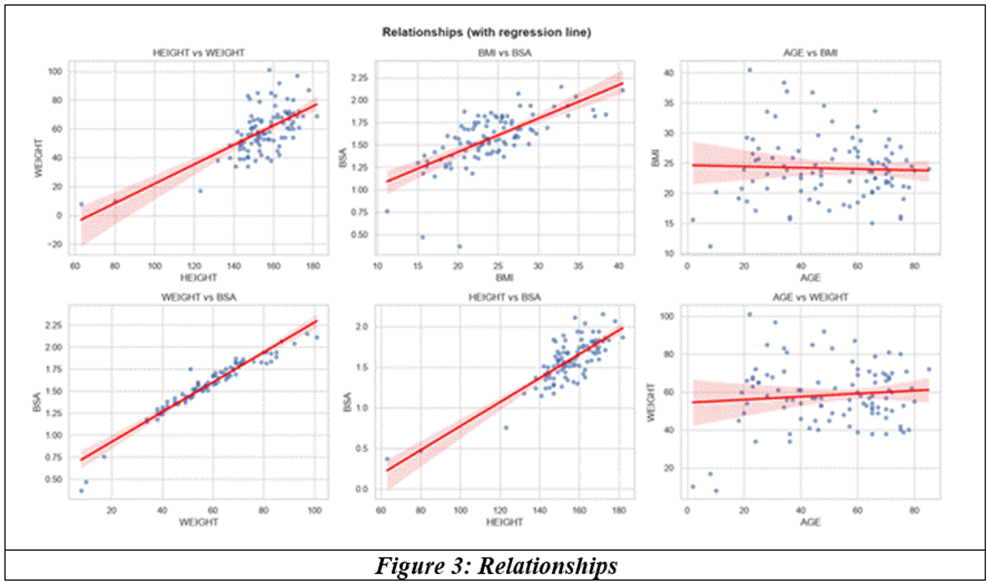
Weight and Height had correlation with r of 0.96 and 0.82 with BSA. With BMI, the r value of weight was 0.83, while height showed r of 0.16. BMI and BSA were highest in obstetric patients in the study population.
CONCLUSION:
Body mass index and body surface area are two common parameters routinely used in medical practice. This Study WAS conducted to encourage understanding and applications of BMI and BSA, BMI focuses on predicting increased risk to systemic illness as well as prognosticate them, BSA speaks on metabolically active area and its important in drug dosing and burns management apart from other indication, BMI and BSA complement each other but not duplicate each other.
REFERENCES:
1. Eknoyan G. Adolphe Quetelet (1796–1874): The average man and indices of obesity. Nephrology Dialysis Transplantation 2008;23:47-51.
2. A Healthy Lifestyle – WHO Recommendations. Accessed in 2010, updated 2025.
3. Freedman DS, Woo JG, Ogden CL, et al. Distance and percentage distance from BMI as alternatives to BMI z score. British Journal of Nutrition 2020;124:493-500.
4. Darbandi M, Pasdar Y, Moradi S, et al. discriminatory capacity of anthropometric indices for cardiovascular disease in adults: a systematic review and meta-analysis. Prev Chronic Dis 2020;17:E131.
5. Silventoinen K, Konttinen H. Obesity and eating behaviour from the perspective of twin and genetic research. Neuroscience, Biobehavioral Reviews 2020;109:150-65.
6. Briana DD, Malamitsi-Puchner A. Adipocytokines in normal and complicated pregnancies. Reprod Sci 2009;16(10):921-37.
7. Michaud DS, Giovannucci E, Willett WC, et al. Physical activity, obesity, height and risk of pancreatic malignancy. JAMA 2001;286:921-9.
8. Vainio H, Bianchini F, eds. Weight Control and physical activity. International Agency for Research on Cancer. Vol. 6. Lyon, France: IARC Press 2000.
9. Devita VT, Hellman S, Rosenberg SA. Cancer: Principles and practice of oncology. Chap- 21, 9th edn. Wolters Kluwer 2008: p. 228, 962.
10. Boer P. Estimated lean body mass as an index for normalisation of body fluid volumes in man. American Journal of Physiology 1984;247:F632-5.
11. Peters AM, Snelling HCR, Glass DM, et al. Estimation of lean body mass in children. Br J Anaesth 2011;106(5):719-23.
12. Courtney Gilbert PT. Ed. by Sara Lindberg. What is healthy fat Percentage? Healthline Updated March 24, 2025.
13. Kıskaç M, Soysal P, Smith L, et al. What is the optimal body mass index range for older adults? Ann Geriatr Med Res 2022;26(1):49-57.
14. Body mass index considerations for practitioners. Accessed on August 2, 2011. CDS Stack (Handwriting unclear.)
15. Stanford FC, Lee M, Hur C. Race, ethnicity, sex, and obesity: is it time to personalize the scale? Mayo Clin Proc 2019;94(2):362-3.
16. Vermund S, Scott M, Humphries D. Public Health and Clinical Implications of Nutrition–Infection Interactions. In: Humphries DL, Scott ME, Vermund SH, eds. Nutrition and infectious diseases: shifting the clinical paradigm. Humana Press/Springer Nature Switzerland 2021:459-81.
17. Danbandi M, Pasdan Y, Moradi S, et al. Discriminatory capacity of anthropometric indices for cardiovascular disease in adults: systematic review and meta-analysis. Preventive Chronic Disease 2020;17:E131.
18. Udristhova A, Cojocaru M, Panait ADM, et al. Variability of biological parameters in blood samples between two schedules of haemodialysis. In: Sahay M, ed. Basic Nephrology and Acute Kidney Injury. Intech Open 2012:53-60.
19. Blanchard OL, Smoliga JM. Translating dosages from animal models to human clinical trials – revisiting body surface area scaling. FASEB J 2015;29(5):1629-34.