A Hospital-Based Study Examined The Relationship Between Mean Platelet Volume And Acute Ischaemic Cerebrovascular Accidents In Patients With Type 2 Diabetes Mellitus And Those Without.
- Manjunath , Assistant Professor Dept. Of General Medicine KIMS Koppala.
- Swaraj Goud K B , Senior Resident General Medicine Kims Koppal.
- Prathvi Nandalike , Assistant professor General Medicine KLE JGMMMC HUBLI.
- Sowmya G R , Assistant professor General Medicine Bmcrc, Ballari.
Article Information:
Abstract:
Aims And Objectives: To study the association of MPV (mean platelet volume) and acute ischemic stroke in patients of type 2 diabetes mellitus. To assess outcome of stroke by MRS score. A Hospital based Cross sectional study. Materials And Methods: The study had included 80 adult patients with age > 18 years with diagnosis of acute ischemic stroke. 40 patients are diabetic and 40 patients are nondiabetic. MPV of all patients was compared with stroke and its assessment of severity by MRS score. Results: The mean platelet volume was 9.71 fL SD + 0.58 fL in the non diabetic group and 10.26 fl SD + 0.92 fL in the diabetic group with a statistical significance between the groups with a p=0.003. The mean MPV increased with increasing MRS scores. with MRS 1, 2, and 3 had MPVs of 5.7 fl, 6.5 fl, and 8.4 fl, respectively, patients with severe functional impairment (MRS 4 and MRS 5) had higher MPVs of 10.1 fl and 10.6 fl respectively. Conclusion: Based on the study we concluded that there is a significant positive correlation between the mean platelet volume and the severity of stroke. We also noted that there is a significant association of higher mean platelet volume with poor prognosis in terms of morbidity and mortality. MPV was higher in patients with diabetes than nondiabetic people. Diabetes being a procoagulant state, patients are at more risk of thrombotic events. MPV is an easy test available in routine hemogram tests and can predict severity and outcome of stroke patients.
Keywords:
Article :
INTRODUCTION:
"An abrupt onset of a neurologic deficit that is attributable to a focal vascular cause" is the definition of "stroke, or cerebrovascular accident." either result in death without any other nonvascular cause or last longer than 24 hours(1). Because stroke can sometimes result in lasting neurological damage and can occasionally become complicated, it is regarded as a medical emergency. There have also been documented cases of stroke-related deaths. As a result, this illness must be treated as soon as possible during what is known as the "golden period"(2,3).
Stroke accounts for the majority of deaths and acquired disabilities worldwide. Eighty percent of them are caused by ischaemia, while the remaining ones are caused by bleeding into the subarachnoid or intracerebral regions. (2, 3). Diabetes mellitus, hypertension, hyperlipidaemia, and smoking are among the risk factors for stroke. Platelets are essential to the regular haemostatic process(4,5). One readily accessible indicator of platelet activity and function is the mean platelet volume (MPV). Increased platelet reactivity will play a significant part in a number of issues.(6–9)
When compared to normal persons, a higher MPV is associated with an independent risk of stroke as well as ischaemic vascular stroke(4). It is unclear what causes elevated MPV and associated platelet activity. However, a number of metabolic disorders, including oxidative stress, endothelial dysfunction, inflammation, and insulin resistance, hyperglycemia, and hyperlipidaemia, are involved. According to studies, elevated MPV both independently and as a risk factor for stroke(6–9).
Compared to patients in lower quintiles, individuals in the highest quartile of MPV were more than twice as likely to suffer a severe stroke. According to these theories, elevated MPV may be a major factor in the development or aggravation of acute ischaemic stroke. As a readily available and reasonably priced parameter in standard hemograms, MPV aids in the prediction of stroke severity.
This study aims to connect the clinical severity of acute ischaemic stroke with MPV(7). Studies on elevated MPV in IHD have previously been published. The cumulative incidence of stroke ranged from 105 to 152/100,000 persons per year, and the crude prevalence of stroke ranged from 44.29 to 559/100,000 persons in different parts of the country during the past decade; however, there are very few studies regarding MPV in acute ischaemic stroke(7) The megakaryocyte-platelet-hemostatic axis (MPHA) plays a significant role in the development of hyperfunctional platelets, which increases the risk of vascular disease or acute thrombotic events like acute coronary syndrome or an ischaemic cerebrovascular accident(8).
Stroke is the second most common cause of mortality, accounting for 5 to 8 million fatalities annually, of which 40% occur in individuals under the age of 70. People under 40 account for about 12% of all strokes. Over the past 15 years, there has been a 17.5% increase in stroke cases in the Indian population. (9)
In light of this, our institute carried out a 12-month hospital-based cross-sectional study on patients with acute ischaemic stroke in order to comprehend the relationship between MPV and acute stroke in diabetics throughout hospital stays.
MATERIALS AND METHODS:
Study design: A Hospital based Cross sectional study
Study participants: The present study was carried out on the Adult patients admitted in medical wards and ICU of SDM College of medical sciences and hospital, Sattur, Dharwad.
Selection Criteria:
Inclusion Criteria:
• Adult patients (>18 years)
• Acute ischemic stroke with or without prior history of Diabetes Mellitus in SDM College of Medical Science and Hospital, Dharwad
Exclusion Criteria:
• Coronary artery disease Malignancy
• Immune thrombocytopenic purpura Renal failure
• Valvular heart disease, cyanotic congenital heart disease, and deep vein thrombosis.
Sample Size:
80 cases: 40- Diabetic and 40- Non Diabetic
Method Of Collection Of DATA:
Institutional ethical committee clearance to conduct the study will be obtained. Written and informed consent from the studypopulation will be taken. The study population includes – patients admitted to the SDM medical college and hospital coming with stroke
History of symptoms:
1) Weakness of limbs.
2) Confusion, trouble speaking.
3) Trouble in walking, Dizziness, loss of balance or loss ofcoordination.
4) Impairment and loss of consciousness.
5) Trouble in seeing on eye or both eye.
RESULTS:
The study was a Cross sectional study that was done on eighty patients who were diagnosed with having ischemic stroke of which 40 patients were diabetic and 40 patients were non diabetic and here are the findings of the study.
TABLE 1 : MEAN AGE
|
AGE |
Minimum |
Maximum |
Mean |
Std. Deviation |
|
NON DM |
22 years |
87 years |
57.05 years |
16.12 years |
|
DM |
25 years |
91 years |
62.82 years |
14.75 |
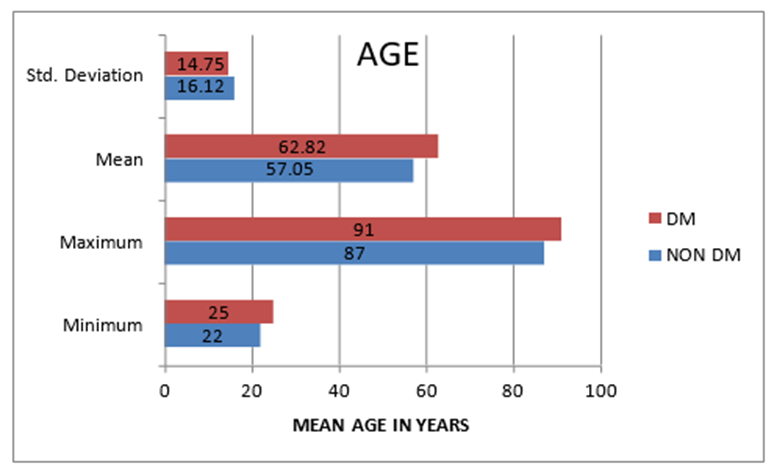
GRAPH 1 : MEAN AGE
In the present study the age group of the cases ranged between 21 years and 91 years , in the non diabetic group the mean age was years 57.05 SD + 16.12years and , in the diabetic group the mean age was years 62.82 SD + 14.75years . The overall mean age was 59.94 years Std. Deviation + 15.626.
TABLE 2: AGE GROUP
|
AGE GROUP IN YEARS |
NON DM |
DM |
Total |
NON DM |
DM |
Total |
|
21-30 YEARS |
3 |
1 |
4 |
7.50% |
2.50% |
10.00% |
|
31-40 YEARS |
2 |
1 |
3 |
5.00% |
2.50% |
7.50% |
|
41-50 YEARS |
7 |
6 |
13 |
17.50% |
15.00% |
32.50% |
|
51-60 YEARS |
9 |
11 |
20 |
22.50% |
27.50% |
50.00% |
|
61-70 YEARS |
10 |
7 |
17 |
25.00% |
17.50% |
42.50% |
|
71-80 YEARS |
5 |
9 |
14 |
12.50% |
22.50% |
35.00% |
|
MORE THAN 80 YEARS |
4 |
5 |
9 |
10.00% |
12.50% |
22.50% |
Chi- square test p= 0.098 (NS)
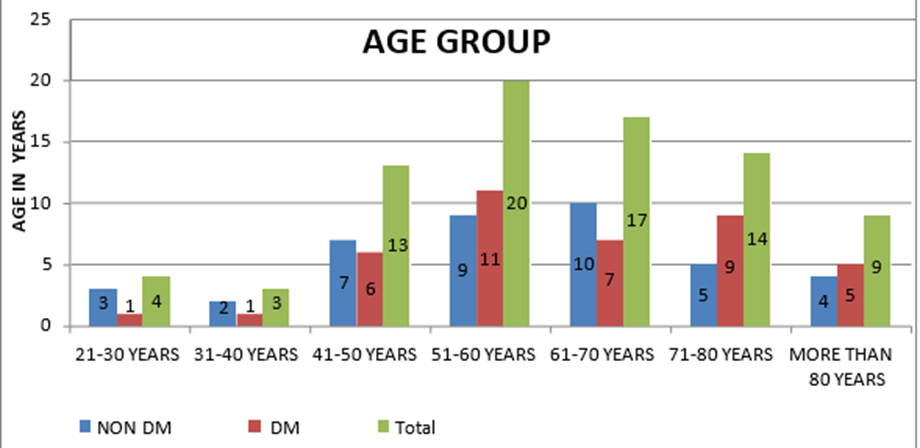
GRAPH 2: AGE GROUP
TABLE 3: GENDER
|
GENDER |
FEMALE |
MALE |
Total |
|
NON DM |
15 |
25 |
40 |
|
DM |
12 |
28 |
40 |
|
Total |
27 |
53 |
80 |
|
NON DM |
37.50% |
62.50% |
100.00% |
|
DM |
30.00% |
70.00% |
100.00% |
|
Total |
33.75% |
66.25% |
100.00% |
Chi- square test p= 0.381 (NS)
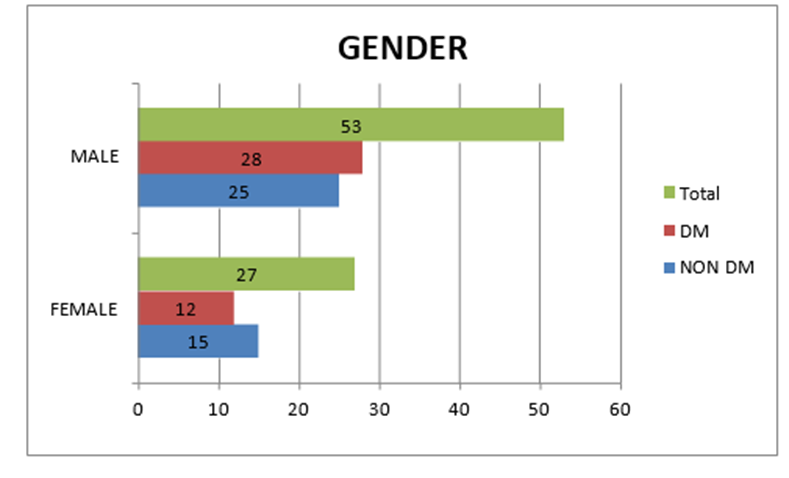
GRAPH 3: GENDER
In the present study 37.50% were females and 62.50% were males in the non diabetic group , 30.00% were females 70.00% were males in the diabetic group. Overall in the study 33.75% were females 66.25% were males . There was a statistical significance between the 2 groups with a p=0.003.
TABLE 4: COMPLAINTS
|
Gender |
Non-diabetic Group n (%) |
Diabetic Group n (%) |
Overall n (%) |
p-value |
|
Female |
37.50% |
30.00% |
33.75% |
|
|
Male |
62.50% |
70.00% |
66.25% |
0.003 |
|
Total |
100.00% |
100.00% |
100.00% |
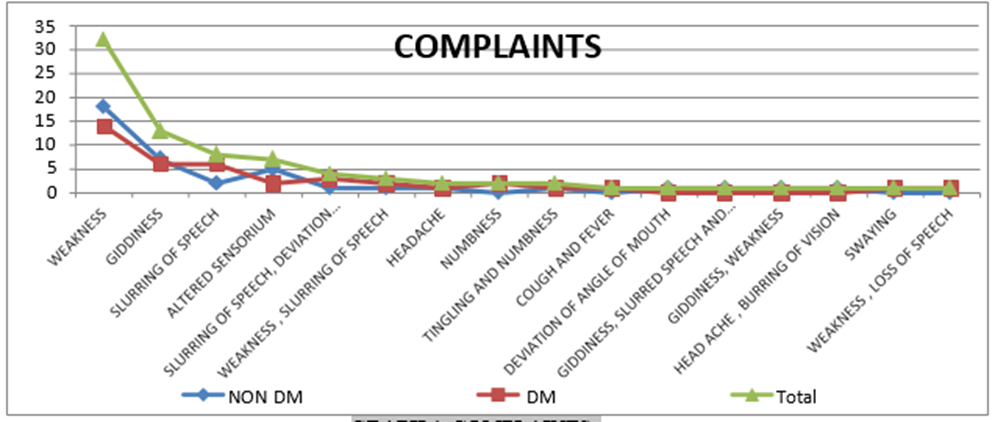
GRAPH 4: COMPLAINTS
The above table and graph shows the list of complaints the patients presented with . There was a no statistical significance between the to groups with a p= p=0.081
TABLE 5: HYPERTENSION
|
HYPERTENSION |
NON DM |
DM |
Total |
NON DM |
DM |
Total |
|
hypertensives |
22 |
29 |
51 |
55.00% |
72.50% |
63.75% |
|
non-hypertensives |
18 |
11 |
29 |
45.00% |
27.50% |
36.25% |
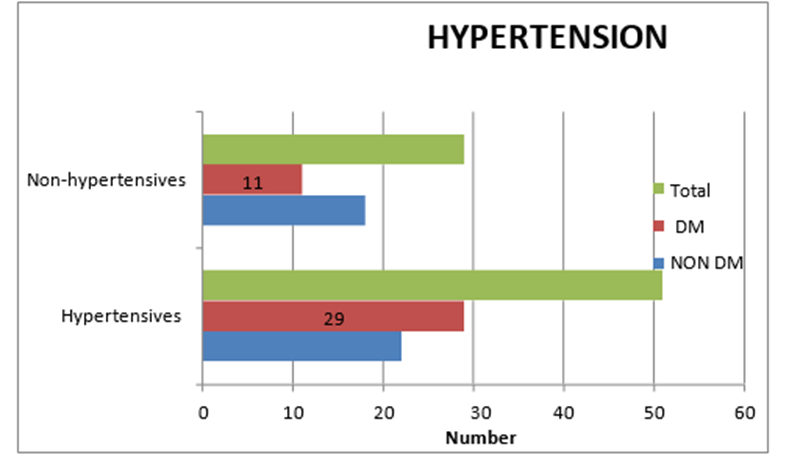
GRAPH 5: HYPERTENSION
55.00% in the non diabetic group and 72.50% in the diabetic group were hypertensives . There was no statistical significance between the two groups with a p=0.081.
DISCUSSION:
Stroke is a serious public health issue with high rates of morbidity and mortality. It is the third leading cause of adult mortality globally.
According to a 2012 study conducted in India (Taylor et al., 2012; Stroke in India factsheet, South Asia Network for Chronic Diseases, Public Health Foundation of India), the prevalence of stroke in India is 84–262/100000 in rural regions and 334–424/100000 in urban areas.
AGE
It is well known by previous studies that, advancing age is a risk factor for stroke , in our study we also noted the same.
The following are studies that show similar results:-
|
Our Study |
The overall mean age was 59.64 ±15.626 |
|
Rajkumar Bharatia et al (64) |
The mean age was 51.2 ± 8.64 years. |
|
Avinash Itagi et al (35) |
The mean age was 58.49±13.97 years. |
|
Birgitta Langhammer et al (102) |
The mean age was 76.8 ± 12.9 years. |
|
Vijaya Sorganvi (8) |
The mean age was 62.88 years |
GENDER
It is well known by previous studies that, the male sex has been listed as a risk factor for stroke, in our study we also noted the same.
The following are studies that show similar results: -
|
Our Study |
66.25% were males |
|
Rajkumar Bharatia et al (64) |
71.4% were males |
|
Avinash Itagi et al (35) |
71.00% were males |
|
Birgitta Langhammer et al (102 ) |
57.3% were males |
|
Sita Chattapadhyay et al (25) |
67.48% were males. |
HYPERTENSION
It is well known by previous studies that, hypertension is a risk factor for stroke in our study we also noted the same.
The following are studies that show similar results:-
|
Our Study |
Hypertension was observed in 63.75% |
|
|
Avinash Itagi et al(35) |
Noted that the most common comorbid condition was hypertension (38.00%) and hypertension + diabetes mellitus (23%). |
|
|
Tapas K Banerjee et al 12 |
Hypertension was observed in 77.3% |
|
|
Vijaya Sorganvi(8) et al |
Noted bivariate analysis included odds ratio and its 95% confidence intervals was for hypertension (0R=3.807), |
|
|
Sita Chattapadhyay et al(25) |
Noted that pre hypertension was seen in 72.36% & hypertension was seen in 8.94% in their study |
|
NIH Stroke Scale between diabetic and nondiabetic:
In the present study the NIH Stroke Scale of the cases ranged between 0 and 22 with a mean of 6.08 SD + 3.63 in the non-diabetic group and 4.30 SD + 2.66 in the diabetic group . There was no a statistical significance between the two groups with a p=0.091, as sample size was small.
In our study results related to Mean Platelet Volume (MPV) were:
1. Grouping were done based on MRS:
· Group 1: Patients with MRS ≤ 2
· Group 2: Patients with MRS ≥ 3
2. MPV Comparison:
· The mean MPV of Group 2 (MRS ≥ 3) was significantly higher (9.851 ± 1.7604 fl) than that of Group 1 (MRS ≤ 2) with a mean MPV of (6.180 ± 1.0743 fl).
· The difference was found to be statistically significant (p value – 0.001, p < 0.05).
3. Correlation between MPV and MRS:
· The Pearson correlation coefficient between MPV and MRS was calculated and found to be 0.818, indicating a strong positive correlation. This correlation was statistically significant.
4. Clinical Severity of Stroke:
· The severity of stroke was assessed using the MRS scale at the time of admission.
· The MRS scale ranges from 0 to 6, where 0 signifies no disability, and 6 implies death.
5. MPV across different MRS Scores:
· MPV was compared across different MRS scores.
· The mean MPV increased with increasing MRS scores. For instance, patients with MRS 1, 2, and 3 had MPVs of 5.7 fl, 6.5 fl, and 8.4 fl, respectively. Patients with severe functional impairment (MRS 4 and MRS 5) had higher MPVs of 10.1 fl and 10.6 fl respectively.
1. MPV with Diabetes Mellitus:
· The mean platelet volume was 9.71 fl SD + 0.58 fL in the non diabetic group and 10.26 fl SD + 0.92 fL in the diabetic group. There was a statistical significance between the groups with a p=0.003.
Other Literature Summary and Comparison on MPV:
|
S.Greisenegger et al |
Patients with the high MPV had a significantly high risk of suffering a severe stroke as compared with low MPV (odds ratio=2.6; 95% confidence interval, 1.6 to 4.1; P<0.001). |
|
Priyanka Patil et al |
Acute ischemic stroke in diabetic patients is significantly associated with raised MPV level, and also having high mortality and morbidity |
|
Vivekanand Kamat et al |
MPV correlated with ischemic stroke severity and clinical outcomes |
|
Sreejith et al |
High MPV correlated with severity and outcomes of ischemic stroke |
|
Philip Bath et al |
Small difference in MPV with antiplatelet use, MPV as an independent predictor of stroke risk |
The present study’s findings corroborate the broader literature, reinforcing the association between elevated MPV and the severity and poor outcomes of ischemic stroke. Elevated MPV is consistently shown as a valuable predictor across various studies, indicating its potential utility in clinical settings for assessing stroke risk and severity.
CONCLUSION:
The study's findings led us to the conclusion that the mean platelet volume and stroke severity are significantly positively correlated. Additionally, we observed that a poor prognosis in terms of morbidity and death is significantly correlated with a higher mean platelet volume. Patients with diabetes had higher MPV than those without the disease. Patients with diabetes are more susceptible to thrombotic events since the condition is pro coagulant. MPV is a simple test that can be used in routine hemograms to predict the severity and prognosis of stroke patients.
REFERENCES:
1. Sacco RL, Kasner SE, Broderick JP, Caplan LR, Connors JJ, Culebras A, Elkind MS, George MG, Hamdan AD, Higashida RT, Hoh BL. An updated definition of stroke for the 21st century: a statement for healthcare professionals from the American Heart Association/American Stroke Association. Stroke. 2013 Jul;44(7):2064-89.
2. Prema TPGraicy KF.Essentials of Neurological and Neurosurgical Nursing. Delhi: Jaypee Brothers.2013, 2/e: 2/e.
3. Iversen AB, Blauenfeldt RA, Johnsen SP, Sandal BF, Christensen B, Andersen G, Christensen MB. Understanding the seriousness of a stroke is essential for appropriate help-seeking and early arrival at a stroke centre: a cross-sectional study of stroke patients and their bystanders. European stroke journal. 2020 Dec;5(4):351-361.
4. Kuriakose D, Xiao Z. Pathophysiology and treatment of stroke: present status and future perspectives. International journal of molecular sciences. 2020 Oct 15;21(20):7609.
5. Mendelson SJ, Prabhakaran S. Diagnosis and management of transient ischemic attack and acute ischemic stroke: a review. Jama. 2021 Mar 16;325(11):1088-1098.
6. Colkesen Y, Muderrisoglu H. The role of mean platelet volume in predicting thrombotic events. Clinical chemistry and laboratory medicine. 2012 Apr 1;50(4):631- 634.
7. Park Y, Schoene N, Harris W. Mean platelet volume as an indicator of platelet activation: methodological issues. Platelets. 2002 Jan1;13(5-6):301-306.
8. Yuri Gasparyan A, Ayvazyan L, P Mikhailidis D, D Kitas G. Mean platelet volume: a link between thrombosis and inflammation? Current pharmaceutical design. 2011 Jan 1;17(1):47-58.
9. Pikija S, CVETKO D, Hajduk M, TRKULJA V. Higher mean platelet volume determined shortly after the symptom onset in acute ischemic stroke patients is associated with a larger infarct volume on CT brain scans and with worse clinical outcome. Clinical neurology and neurosurgery. 2009 Sep 1;111(7):568-573.
10. Syrmos NC, Giannouli V, Kottas S, Turgut M. History of Cranial Subdural Hematoma. Subdural Hematoma: Past to Present to Future Management. 2021:33-43.
11. Howard JM, Hess W, Howard JM, Hess W. The early surgeon-anatomists. History of the pancreas: mysteries of a hidden organ. 2002:1-64.
12. Jaillard A, Cornu C, Durieux A, et al.Hemorrhagic transformation in acute ischemic stroke. The MAST-E study. MAST-E Group. Stroke 1999;30:1326-1332.
13. Bang OY, Saver JL, Kim SJ, et al.Collateral flow averts hemorrhagic transformation after endovascular therapy for acute ischemic stroke. Stroke 2011;42:2235-2239.
14. Vavilala MS, Lee LA, Lam AM. Cerebral blood flow and vascular physiology. Anesthesiology Clinics of North America. 2002 Jun 1;20(2):247-264.
15. Dumitrescu AM, Sava A, Ciocoiu M, Rezuş E, Gavrilescu CM, Turliuc DM, Costea CF, Şorodoc V, Iliescu DM, Stan CI. THE CIRCLE OF WILLIS REVISITED: ITS ANATOMY AND FUNCTION. Romanian Journal of Functional & Clinical, Macro-& Microscopical Anatomy & of Anthropology/Revista Româna de Anatomie Functionala si Clinica, Macro si Microscopica si de Antropologie. 2021 Oct 1;20(4).
16. Wijesinghe P, Steinbusch HW, Shankar SK, Yasha TC, De Silva KR. Circle of Willis abnormalities and their clinical importance in ageing brains: A cadaveric anatomical and pathological study. Journal of Chemical Neuroanatomy. 2020 Jul 1;106:101772.
17. Caplan LR. Stroke classification: a personal view. Stroke. 2011 Jan;42:S3-6.
18. Saver JL. Optimizing an evidence-based causative classification system for ischemic stroke. Annals of neurology. 2006 Feb;59(2):434-438.
19. Amarenco P, Bogousslavsky J, Caplan LR, Donnan GA, Hennerici MG. Classification of stroke subtypes. Cerebrovascular diseases. 2009;27(5):493-501.
20. Jamrozik K, Broadhurst RJ, the role of lifestyles factors in the etiology of stroke: A population based case control study in peth, western Australia stroke 1991; 25:51-59.
21. Elkind MS, Sacco RL. Stroke risk factors and stroke prevention. InSeminars in neurology .1998 by Thieme Medical Publishers, Inc.. 1998 ;18( 04,):429-440.
22. Boden-Albala B, Sacco RL. Lifestyle factors and stroke risk: exercise, alcohol, diet, obesity, smoking, drug use, and stress. Current atherosclerosis reports. 2000 Mar 1;2(2):160-166.
23. Lee CD, Folsom AR, Blair SN. Physical activity and stroke risk: a meta-analysis. Stroke. 2003 Oct 1;34(10):2475-2481.
24. Yousufuddin M, Young N. Aging and ischemic stroke. Aging (Albany NY). 2019 May 5;11(9):2542.
25. Choudhury MJ, Chowdhury MT, Nayeem A, Jahan WA. Modifiable and non- modifiable risk factors of stroke: A review update. Journal of National Institute of Neurosciences Bangladesh. 2015 Apr 28;1(1):22-26.