Comparative Performance of the Triglyceride-Glucose Index and Triglyceride-Glucose-Body Mass Index for Assessing Hepatic Steatosis and Fibrosis in Non-Alcoholic Fatty Liver Disease: A Cross-Sectional Study.
- Arvapally Aravind , Senior Resident, Department of Medical Gastroenterology, Osmania Medical College and Hospital, Hyderabad, Telangana.
- Vivek , Senior Resident, Department of Medical Gastroenterology, ESIC Medical College & Hospital, Kalaburagi, Karnataka.
- M. Uma Devi , Prof & HOD, Department of Medical Gastroenterology, Osmania Medical College and Hospital, Hyderabad, Telangana.
- B. Ramesh Kumar , Professor, Department of Medical Gastroenterology, Osmania Medical College and Hospital, Hyderabad, Telangana.
Article Information:
Abstract:
Background: The triglyceride-glucose index is an inexpensive surrogate of insulin resistance, while the triglyceride-glucose-body mass index incorporates adiposity and may improve identification of clinically important hepatic steatosis. Its comparative value for fibrosis assessment remains uncertain. Methods: This cross-sectional study included 101 adults with non-alcoholic fatty liver disease evaluated at a tertiary academic center. The triglyceride-glucose index was recalculated as the natural logarithm of [fasting triglycerides (mg/dL) × fasting glucose (mg/dL)/2], and the triglyceride-glucose-body mass index was calculated by multiplying the triglyceride-glucose index by body mass index. Controlled attenuation parameter and liver stiffness were measured using vibration-controlled transient elastography. The primary steatosis outcome was controlled attenuation parameter ≥275 dB/m; the fibrosis-risk outcome was liver stiffness ≥7.0 kPa. Associations, effect sizes, receiver operating characteristic curves, paired area-under-the-curve comparisons, and diagnostic performance measures were calculated. Results: The mean age was 43.03 ± 10.82 years, 58 participants (57.4%) were women, and the mean body mass index was 30.61 ± 6.11 kg/m². Controlled attenuation parameter ≥275 dB/m was present in 46 participants (45.5%), and liver stiffness ≥7.0 kPa in 37 (36.6%). Both indices were higher in participants with controlled attenuation parameter ≥275 dB/m, with a moderate effect for the triglyceride-glucose index (Hedges g=0.63) and a large effect for the triglyceride-glucose-body mass index (Hedges g=1.02). The corresponding areas under the receiver operating characteristic curve were 0.654 and 0.768; the paired difference was 0.115 (DeLong z=2.00, p=0.046). At a data-derived cutoff of 270.6, the triglyceride-glucose-body mass index had 76.1% sensitivity and 72.7% specificity. Neither index discriminated liver stiffness ≥7.0 kPa (areas under the curve 0.484 and 0.450). Conclusions: The triglyceride-glucose-body mass index showed better discrimination than the triglyceride-glucose index for controlled attenuation parameter-defined higher-grade steatosis, but neither index identified elevated liver stiffness. The index may serve as a low-cost steatosis triage marker, but it should not replace established fibrosis-risk pathways. External validation of the proposed cutoff is required.
Keywords:
Article :
INTRODUCTION:
Non-alcoholic fatty liver disease (NAFLD) is one of the most common causes of chronic liver disease and encompasses a continuum from isolated steatosis to steatohepatitis, progressive fibrosis, cirrhosis, and hepatocellular carcinoma [1,2]. Contemporary multisociety nomenclature uses the term metabolic dysfunction-associated steatotic liver disease (MASLD), emphasizing the close relationship between hepatic steatosis and cardiometabolic dysfunction [3,4].
Because the parent study enrolled patients using NAFLD-era diagnostic criteria and did not prospectively capture every component required for retrospective MASLD adjudication, the term NAFLD is retained in this report for methodological fidelity. Fibrosis stage is the strongest liver-related prognostic determinant in NAFLD, whereas the quantity of hepatic fat is more closely linked to current metabolic burden and may change relatively rapidly with weight, glycemic control, and treatment [2,3].
Clinical risk assessment therefore requires tools that distinguish steatosis burden from fibrosis risk. Current guidelines recommend sequential non-invasive assessment, generally beginning with a simple blood-based fibrosis score and progressing to vibration-controlled transient elastography or another second-line test when appropriate [2,3,5].
Insulin resistance is central to the development of hepatic steatosis. Increased adipose lipolysis, hepatic de novo lipogenesis, impaired fatty-acid oxidation, and altered very-low-density lipoprotein export promote intrahepatic triglyceride accumulation and lipotoxic injury. The hyperinsulinemic-euglycemic clamp is the reference method for quantifying insulin sensitivity, but its complexity limits routine use.
The triglyceride-glucose (TyG) index, derived from fasting triglyceride and glucose values, has consequently emerged as a practical surrogate of insulin resistance [6,7]. Because body mass index (BMI) captures an important component of adiposity-related metabolic risk, multiplying TyG by BMI yields the triglyceride-glucose-body mass index (TyG-BMI). Population studies have reported stronger associations of TyG-BMI than TyG alone with prevalent fatty liver, including among Asian populations [8-11].
However, TyG-BMI may partly improve apparent performance simply because BMI is itself strongly associated with steatosis. Moreover, a marker that reflects insulin resistance and adiposity may not identify established hepatic fibrosis, which represents cumulative and heterogeneous tissue remodeling.
Controlled attenuation parameter (CAP), acquired during vibration-controlled transient elastography, provides a quantitative estimate of ultrasound attenuation related to liver fat, while liver stiffness measurement (LSM) is used to estimate fibrosis probability [5,12-14]. Neither measure is equivalent to histology, and diagnostic thresholds vary with population, probe, technical quality, inflammation, and body habitus.
Nevertheless, their paired acquisition offers a pragmatic non-invasive framework for comparing steatosis-oriented metabolic indices with fibrosis-oriented elastography. Indian data directly comparing TyG and TyG-BMI against both CAP and LSM are limited. This study therefore compared the associations and diagnostic performance of TyG and TyG-BMI for CAP-defined higher-grade steatosis and study-defined elevated liver stiffness in adults with NAFLD.
We hypothesized that TyG-BMI would outperform TyG for steatosis assessment but that neither index would provide adequate discrimination for elevated liver stiffness.
MATERIALS AND METHODS:
Study design and setting
This cross-sectional observational study was conducted in the Department of Medical Gastroenterology, Osmania General Hospital and Osmania Medical College, Hyderabad, India, over an 18-month period after institutional ethics approval. Reporting was structured with reference to the Strengthening the Reporting of Observational Studies in Epidemiology and Standards for Reporting Diagnostic Accuracy Studies statements [15,16].
Participants
Adults aged 18-70 years attending inpatient or outpatient gastroenterology services were consecutively screened. Eligible participants had ultrasonographic or elastographic evidence of NAFLD and provided written informed consent. Exclusion criteria were alcohol consumption >30 g/day in men or >20 g/day in women; hepatitis C virus infection; recognized secondary causes of steatosis, including relevant hepatotoxic medication exposure or endocrinopathy; known clinical or radiological cirrhosis; pregnancy; malignancy; and refusal of consent. A total of 101 participants were included.
Clinical and laboratory assessment
Age, sex, comorbidities, height, and weight were recorded using a structured case proforma. BMI was calculated as weight in kilograms divided by height in meters squared. Following an overnight fast, blood was collected for fasting plasma glucose, triglycerides (TGL), total cholesterol (TC), low-density lipoprotein cholesterol (LDL-C, high-density lipoprotein cholesterol (HDL-C), aspartate aminotransferase (AST), alanine aminotransferase (ALT), serum albumin, and platelet count (PLT). The aspartate aminotransferase-to-platelet ratio index (APRI) and Fibrosis-4 (Fib-4) index were derived from routine laboratory variables.
Calculation of TyG and TyG-BMI
The TyG index was recalculated for every participant from the individual fasting values using: TyG = ln [fasting triglycerides (mg/dL) × fasting plasma glucose (mg/dL)/2]. TyG-BMI was calculated as TyG × BMI (kg/m²). Recalculation was undertaken to ensure consistent application of the formula and to avoid propagation of any spreadsheet calculation error.
Ultrasonography
Abdominal ultrasonography was used to categorize hepatic steatosis as grade 1, grade 2, or grade 3 according to increasing hepatic echogenicity, loss of visualization of intrahepatic vascular margins and diaphragm, and posterior beam attenuation. Four examinations were recorded as altered echotexture without a conventional grade, and two had no recorded steatosis grade; these six examinations were excluded from ordinal grade analyses but retained in analyses based on CAP and LSM.
Vibration-controlled transient elastography
Vibration-controlled transient elastography was performed using a FibroScan system (Echosens, Paris, France) to obtain CAP in decibels per meter (dB/m) and LSM in kilopascals (Kpa). CAP and LSM were interpreted as continuous measurements; categorical thresholds were used only as operational study outcomes and not as histological confirmation.
Outcome definitions
The primary steatosis outcome was CAP ≥275 dB/m, selected as an operational threshold for higher-grade steatosis within the range of published CAP thresholds [12,13]. The primary fibrosis-risk outcome was LSM ≥7.0 kPa, corresponding to the threshold used in the parent study for elevated stiffness. Because disease-specific thresholds vary and biopsy was not performed, this outcome is described as study-defined elevated LSM rather than histologically proven stage F2 fibrosis. A sensitivity analysis used LSM ≥8.0 kPa. Ultrasound grade ≥2 and ordinal ultrasound grade were analyzed as supportive steatosis outcomes.
Statistical analysis
Continuous variables were assessed for distribution and summarized as mean ± standard deviation when approximately symmetric or median with interquartile range when skewed. Categorical variables were summarized as number and percentage with exact binomial 95% confidence intervals for key prevalences. Spearman rank correlation quantified associations of TyG and TyG-BMI with CAP, LSM, and ordinal ultrasound grade.
Between-group comparisons used Welch's independent-samples t test, supplemented by the Mann-Whitney U test, and Hedges g was reported as the standardized mean difference.
Univariable logistic regression estimated the odds ratio for each outcome per one standard deviation increase in the index. Receiver operating characteristic (ROC) curves were constructed for CAP ≥275 dB/m and LSM ≥7.0 kPa. Areas under the ROC curve (AUROCs) were reported with DeLong 95% confidence intervals and compared using the paired DeLong test [17].
For the steatosis outcome, exploratory cutoffs were selected using the maximum Youden index, and sensitivity, specificity, positive predictive value, negative predictive value, likelihood ratios, and accuracy were reported with Wilson 95% confidence intervals. Because both fibrosis AUROCs were below 0.50, no clinically meaningful fibrosis cutoff was derived.
Across ultrasound grades 1-3, Kruskal-Wallis tests assessed differences in each index, with epsilon-squared as the effect size. All tests were two-sided and p<0.05 was considered statistically significant.
Analyses were performed using Python version 3.13.5 (Python Software Foundation, Wilmington, Delaware, United States), pandas version 2.2.3, SciPy version 1.17.0, scikit-learn version 1.8.0, statsmodels version 0.14.6, and a validated DeLong covariance implementation.
Ethical considerations
The study was approved by the Institutional Ethics Committee of Osmania Medical College. All participants provided written informed consent. The present reanalysis used de-identified participant-level data.
RESULTS:
All 101 enrolled participants were included in the reanalysis. The mean age was 43.03 ± 10.82 years, 58 participants (57.4%) were women, and the mean BMI was 30.61 ± 6.11 kg/m². Mean CAP was 268.44 ± 42.94 dB/m, while median LSM was 6.10 kPa (interquartile range 5.30-7.60). The mean recalculated TyG index was 9.014 ± 0.422 and mean TyG-BMI was 276.69 ± 60.47. Baseline characteristics are summarized in Table 1.
Table 1. Baseline demographic, biochemical, metabolic-index, and elastography characteristics
|
Characteristic |
Value |
|
Participants |
101 |
|
Age, years |
43.03 ± 10.82 |
|
Women |
58 (57.4%) |
|
BMI, kg/m² |
30.61 ± 6.11 |
|
TGL, mg/dL |
156.27 ± 46.78 |
|
Fasting plasma glucose, mg/dL |
108 (88-132) |
|
AST, U/L |
27 (20-44) |
|
ALT, U/L |
32 (19-46) |
|
Serum albumin, g/dL |
4.27 ± 0.45 (n=100) |
|
CAP, dB/m |
268.44 ± 42.94 |
|
LSM, kPa |
6.10 (5.30-7.60) |
|
TyG |
9.014 ± 0.422 |
|
TyG-BMI |
276.69 ± 60.47 |
|
APRI |
0.30 (0.20-0.60) |
|
Fib-4 |
1.05 (0.74-1.50) |
Values are mean ± standard deviation, median (interquartile range), or number (percentage), as appropriate. Controlled attenuation parameter was measured in decibels per meter; liver stiffness measurement was measured in kilopascals. Body mass index was calculated as weight in kilograms divided by height in meters squared. BMI: Body mass index, TGL: Fasting triglycerides, AST: Aspartate aminotransferase, ALT: Alanine aminotransferase, CAP: Controlled attenuation parameter, LSM: Liver stiffness measurement, TyG: Triglyceride-glucose index, TyG-BMI: Triglyceride-glucose-body mass index, APRI: Aspartate aminotransferase-to-platelet ratio index, Fib-4: Fibrosis-4 index
CAP ≥275 dB/m was present in 46 of 101 participants (45.5%; exact 95% confidence interval 35.6%-55.8%). Study-defined elevated LSM ≥7.0 kPa was present in 37 (36.6%; 95% confidence interval 27.3%-46.8%), and LSM ≥8.0 kPa in 24 (23.8%; 95% confidence interval 15.9%-33.3%). Ultrasound showed grade 1 steatosis in 58, grade 2 in 34, and grade 3 in three participants; four had non-graded altered echotexture and two had no recorded ultrasound steatosis. The imaging outcome distribution is presented in Table 2.
Table 2. Distribution of ultrasound findings and operational elastography outcomes
|
Imaging finding or operational outcome |
Number (%) |
95% confidence interval |
|
CAP ≥275 dB/m |
46 (45.5) |
35.6%-55.8% |
|
LSM ≥7.0 kPa |
37 (36.6) |
27.3%-46.8% |
|
LSM ≥8.0 kPa |
24 (23.8) |
15.9%-33.3% |
|
Ultrasound grade 1 steatosis |
58 (57.4) |
Not calculated |
|
Ultrasound grade 2 steatosis |
34 (33.7) |
Not calculated |
|
Ultrasound grade 3 steatosis |
3 (3.0) |
Not calculated |
|
Ultrasound altered echotexture, not graded |
4 (4.0) |
Not calculated |
|
No recorded ultrasound steatosis grade |
2 (2.0) |
Not calculated |
Percentages use the full cohort denominator of 101. Exact binomial 95% confidence intervals are provided for the prespecified binary controlled attenuation parameter and liver stiffness measurement outcomes. CAP: Controlled attenuation parameter, LSM: Liver stiffness measurement
TyG showed a weak positive correlation with CAP (Spearman ρ=0.271, p=0.006), whereas TyG-BMI showed a moderate positive correlation (ρ=0.478, p<0.001). Neither index correlated with LSM (TyG: ρ=-0.054, p=0.590; TyG-BMI: ρ=0.015, p=0.880). Among the 95 participants with a conventional ultrasound grade, TyG correlated moderately with ordinal steatosis grade (ρ=0.448, p<0.001), while the TyG-BMI correlation was weaker (ρ=0.294, p=0.004).
Participants with CAP ≥275 dB/m had higher TyG values than those below the threshold (9.153 ± 0.468 vs 8.898 ± 0.342; Welch t=3.08, p=0.003; Hedges g=0.63). The difference was larger for TyG-BMI (306.83 ± 57.02 vs 251.49 ± 51.41; Welch t=5.08, p<0.001; Hedges g=1.02). Per one standard deviation increase, the odds of CAP ≥275 dB/m were 1.95-fold higher for TyG (95% confidence interval 1.24-3.07; p=0.004) and 3.13-fold higher for TyG-BMI (95% confidence interval 1.82-5.38; p<0.001). In contrast, neither index differed significantly by LSM ≥7.0 kPa. Complete association estimates are shown in Table 3.
Table 3. Associations of the triglyceride-glucose indices with higher-grade steatosis and elevated liver stiffness
|
Index and outcome |
Outcome present |
Outcome absent |
Welch test |
Hedges g |
Odds ratio per standard deviation (95% confidence interval) |
|
TyG; CAP ≥275 dB/m |
9.153 ± 0.468 |
8.898 ± 0.342 |
t=3.08; p=0.003 |
0.63 |
1.95 (1.24-3.07); p=0.004 |
|
TyG-BMI; CAP ≥275 dB/m |
306.83 ± 57.02 |
251.49 ± 51.41 |
t=5.08; p<0.001 |
1.02 |
3.13 (1.82-5.38); p<0.001 |
|
TyG; LSM ≥7.0 kPa |
8.976 ± 0.354 |
9.036 ± 0.458 |
t=-0.73; p=0.465 |
-0.14 |
0.86 (0.57-1.31); p=0.491 |
|
TyG-BMI; LSM ≥7.0 kPa |
266.38 ± 51.82 |
282.66 ± 64.59 |
t=-1.39; p=0.169 |
-0.27 |
0.75 (0.49-1.15); p=0.194 |
Outcome-present and outcome-absent values are mean ± standard deviation. Welch's independent-samples t test was used for group comparisons. Hedges g is the standardized mean difference. Odds ratios are per one standard deviation increase in the respective index. CAP: Controlled attenuation parameter; LSM: liver stiffness measurement, TyG: Triglyceride-glucose index, TyG-BMI: Triglyceride-glucose-body mass index.
For CAP ≥275 dB/m, TyG had an AUROC of 0.654 (95% confidence interval 0.545-0.762), whereas TyG-BMI had an AUROC of 0.768 (95% confidence interval 0.675-0.862). The paired AUROC difference of 0.115 favored TyG-BMI (DeLong z=2.00, p=0.046). For LSM ≥7.0 kPa, discrimination was no better than chance for TyG (AUROC 0.484, 95% confidence interval 0.369-0.598) or TyG-BMI (AUROC 0.450, 95% confidence interval 0.335-0.564); the paired difference was not significant (DeLong z=-0.54, p=0.590). The ROC analyses are summarized in Table 4 and illustrated in Figures 1 and 2.
Table 4. Comparative receiver operating characteristic performance for steatosis and elevated liver stiffness
|
Outcome |
Index |
AUROC (95% CI) |
Paired area difference |
DeLong test |
|
CAP ≥275 dB/m |
TyG |
0.654 (0.545-0.762) |
Reference |
Reference |
|
CAP ≥275 dB/m |
TyG-BMI |
0.768 (0.675-0.862) |
0.115 |
z=2.00; p=0.046 |
|
LSM ≥7.0 kPa |
TyG |
0.484 (0.369-0.598) |
Reference |
Reference |
|
LSM≥7.0 kPa |
TyG-BMI |
0.450 (0.335-0.564) |
-0.034 |
z=-0.54; p=0.590 |
Areas under the receiver operating characteristic curve were estimated with DeLong 95% confidence intervals. Paired differences compare the triglyceride-glucose-body mass index with the triglyceride-glucose index. 'Reference' denotes the comparator row and avoids empty table cells. CAP: Controlled attenuation parameter; LSM: liver stiffness measurement, TyG: Triglyceride-glucose index, TyG-BMI: Triglyceride-glucose-body mass index.
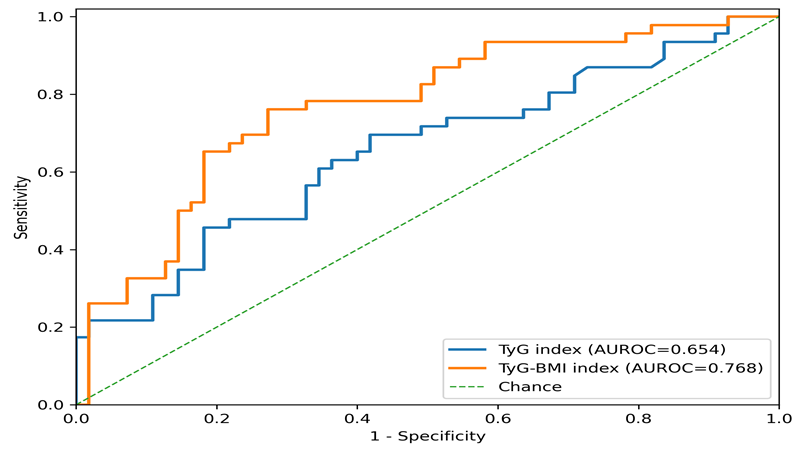
Figure 1. Receiver operating characteristic curves for identifying controlled attenuation parameter ≥275 dB/m.
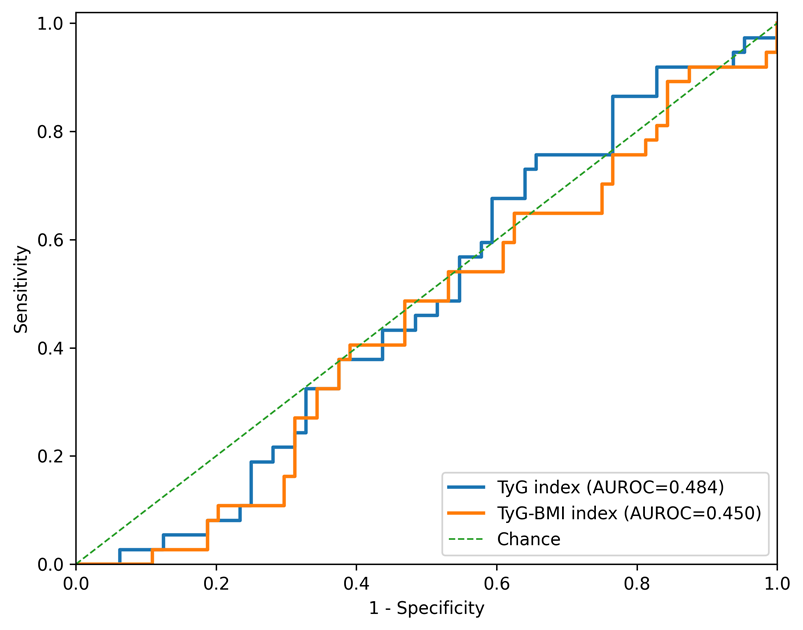
Figure 2. Receiver operating characteristic curves for identifying liver stiffness measurement ≥7.0 kPa.
At the exploratory Youden cutoff of 8.93, TyG had 69.6% sensitivity and 58.2% specificity for CAP ≥275 dB/m. At a cutoff of 270.6, TyG-BMI had 76.1% sensitivity, 72.7% specificity, 70.0% positive predictive value, 78.4% negative predictive value, and 74.3% overall accuracy. Diagnostic operating characteristics are reported in Table 5.
Table 5. Exploratory operating characteristics for controlled attenuation parameter ≥275 dB/m
|
Index and cutoff |
Sensitivity |
Specificity |
Positive predictive value |
Negative predictive value |
Positive likelihood ratio |
Negative likelihood ratio |
Accuracy |
|
TyG ≥8.93 |
69.6% (54.2%-82.3%) |
58.2% (44.1%-71.3%) |
58.2% (44.1%-71.3%) |
69.6% (54.2%-82.3%) |
1.66 |
0.52 |
63.4% |
|
TyG-BMI≥270.6 |
76.1% (61.2%-87.4%) |
72.7% (59.0%-83.9%) |
70.0% (55.4%-82.1%) |
78.4% (64.7%-88.7%) |
2.79 |
0.33 |
74.3% |
Cutoffs were selected in the same dataset using the maximum Youden index and therefore require independent validation. Values in parentheses are Wilson 95% confidence intervals. TyG: Triglyceride-glucose index, TyG-BMI: Triglyceride-glucose-body mass index.
TyG increased across ultrasound grades 1, 2, and 3 (8.899 ± 0.331, 9.205 ± 0.383, and 9.953 ± 0.505, respectively; Kruskal-Wallis H=20.32, p<0.001; ε²=0.199). TyG-BMI also increased across grades (265.05 ± 55.65, 298.63 ± 62.23, and 338.84 ± 58.60; H=8.56, p=0.014; ε²=0.071). These ordinal findings supported an association with steatosis severity but did not alter the primary CAP-based comparison.
In the sensitivity analysis using LSM ≥8.0 kPa, AUROCs remained poor for TyG (0.443, 95% confidence interval 0.325-0.561) and TyG-BMI (0.429, 95% confidence interval 0.302-0.555), with no significant difference between the indices (DeLong p=0.828).
DISCUSSION:
This study directly compared two inexpensive insulin-resistance surrogates against paired non-invasive measures of hepatic fat and stiffness in adults with NAFLD. The principal finding was that TyG-BMI had moderate discrimination for CAP-defined higher-grade steatosis and performed significantly better than TyG alone. The standardized between-group effect was large for TyG-BMI, and each standard deviation increase was associated with more than threefold higher odds of CAP ≥275 dB/m. By contrast, neither index identified study-defined elevated LSM, and both fibrosis AUROCs were below 0.50.
The steatosis result is biologically plausible. TyG reflects the interaction of fasting triglycerides and glucose, two readily measurable consequences of insulin resistance [6,7]. Adding BMI incorporates adiposity, which is upstream of excess free-fatty-acid delivery, adipokine dysregulation, and hepatic de novo lipogenesis. Previous population studies have similarly found TyG-BMI to be associated with prevalent fatty liver and to outperform TyG in selected groups [8-11]. The present study extends those observations by comparing the indices with quantitative CAP in a clinically referred Indian NAFLD cohort.
The degree of improvement should nevertheless be interpreted carefully. TyG-BMI is a mathematical product containing BMI, and BMI is itself associated with hepatic fat. Its superior AUROC therefore does not establish that the composite captures a novel biological pathway independent of adiposity. The data-derived cutoff of 270.6 also requires external validation because optimal thresholds vary with ethnicity, BMI distribution, diabetes prevalence, laboratory methods, and the reference standard. It is best regarded as an exploratory triage threshold rather than a clinically established decision limit.
TyG showed a stronger monotonic relationship than TyG-BMI with ultrasound grade, whereas TyG-BMI was superior for the CAP-based binary outcome. Several factors may explain this difference. Ultrasound grading is subjective and nonlinear, particularly at higher BMI, while CAP is a continuous quantitative measure acquired at the time of elastography [12-14]. Only three participants had ultrasound grade 3 steatosis, making the ordinal comparison unstable. Additionally, multiplying by BMI can amplify interindividual variation unrelated to the visually assigned ultrasound grade.
The absence of fibrosis discrimination is clinically important. Fibrosis reflects the cumulative balance between injury and repair and is influenced by age, diabetes duration, genetic susceptibility, inflammatory activity, and disease duration. A cross-sectional surrogate of present insulin resistance and adiposity may therefore track liver fat more closely than established scar. This finding is consistent with guideline pathways that use validated fibrosis scores such as Fibrosis-4 followed by elastography, rather than TyG or TyG-BMI, to assess advanced fibrosis risk [2,3,5]. In the same dataset, aspartate aminotransferase-to-platelet ratio index and Fibrosis-4 increased across LSM categories, supporting the biological distinction between steatosis-oriented and fibrosis-oriented markers.
CAP and LSM must also be interpreted as probabilistic non-invasive measurements, not histological endpoints. CAP thresholds overlap substantially across steatosis grades, and measurement performance varies with probe selection and BMI [12-14]. LSM can be influenced by acute inflammation, cholestasis, congestion, recent food intake, and technical quality. Accordingly, we describe LSM ≥7.0 kPa as elevated stiffness or fibrosis risk rather than confirmed stage F2 fibrosis. The persistence of poor discrimination at the more stringent 8.0-kPa sensitivity threshold makes it unlikely that the negative fibrosis result is solely an artifact of the primary cutoff.
From a clinical perspective, TyG-BMI may help identify patients likely to have a greater steatosis burden when elastography is unavailable or when prioritizing referrals in resource-constrained settings. Its components are inexpensive and routinely measured. However, a steatosis marker does not replace etiologic assessment, cardiovascular risk management, or fibrosis stratification. A practical pathway would use metabolic indices to raise suspicion of steatotic liver disease, then apply guideline-supported fibrosis assessment using Fibrosis-4 and second-line elastography where indicated [2,3,5].
The study has several strengths. It used participant-level recalculation of both indices, paired CAP and LSM measurements, direct paired AUROC comparison, effect-size reporting, and sensitivity analysis for the stiffness threshold. It also evaluated concordant continuous, binary, and ordinal steatosis outcomes rather than relying on a single p value.
Limitations
1) The single-center cross-sectional design precludes temporal or causal inference and may be affected by tertiary-care referral and spectrum bias. Every participant already had suspected or documented NAFLD; performance estimates therefore cannot be generalized to population screening without external validation.
2) Liver biopsy, magnetic resonance imaging-proton density fat fraction (MRI-PDFF), and magnetic resonance elastography (MRE) were not available. CAP and LSM served as pragmatic reference standards but are imperfect surrogates. The CAP ≥275 dB/m and LSM ≥7.0 kPa thresholds were operational study definitions, not universally accepted histological cutoffs.
3) The sample was modest, only three participants had ultrasound grade 3 steatosis, and relatively few had markedly elevated LSM. The exploratory Youden cutoffs were derived and evaluated in the same cohort, which creates optimism bias. No bootstrap correction, internal validation, or independent validation cohort was available.
4) Waist circumference, fasting insulin, homeostatic model assessment of insulin resistance, hemoglobin A1c, diet, physical activity, duration of diabetes, and genetic variables were not systematically recorded. Residual confounding could not be addressed, and the incremental value of TyG-BMI beyond BMI alone was not formally tested in a multivariable prediction model.
5) The study used the NAFLD framework current at enrollment. Full retrospective classification under MASLD criteria was not possible because all cardiometabolic criteria and alternative steatotic liver disease categories were not prospectively documented.
CONCLUSION:
In adults with NAFLD, TyG-BMI demonstrated better discrimination than TyG for CAP-defined higher-grade hepatic steatosis, with a large standardized effect and a significantly greater AUROC. Neither index showed useful discrimination for elevated liver stiffness, including at a more stringent sensitivity threshold. TyG-BMI may be a practical low-cost steatosis triage marker, but it should not replace guideline-based fibrosis assessment. Prospective multicenter validation against standardized CAP/LSM protocols and, where feasible, MRI or histology is required.
REFERENCES:
1. Younossi ZM, Golabi P, Paik JM, Henry A, Van Dongen C, Henry L. The global epidemiology of nonalcoholic fatty liver disease and nonalcoholic steatohepatitis: a systematic review. Hepatology. 2023;77(4):1335-1347. https://doi.org/10.1097/HEP.0000000000000004
2. Rinella ME, Neuschwander-Tetri BA, Siddiqui MS, et al. AASLD practice guidance on the clinical assessment and management of nonalcoholic fatty liver disease. Hepatology. 2023;77(5):1797-1835. https://doi.org/10.1097/HEP.0000000000000323
3. European Association for the Study of the Liver; European Association for the Study of Diabetes; European Association for the Study of Obesity. EASL-EASD-EASO clinical practice guidelines on the management of metabolic dysfunction-associated steatotic liver disease. J Hepatol. 2024;81(3):492-542. https://doi.org/10.1016/j.jhep.2024.04.031
4. Rinella ME, Lazarus JV, Ratziu V, et al. A multisociety Delphi consensus statement on new fatty liver disease nomenclature. J Hepatol. 2023;79(6):1542-1556. https://doi.org/10.1016/j.jhep.2023.06.003
5. European Association for the Study of the Liver. EASL clinical practice guidelines on non-invasive tests for evaluation of liver disease severity and prognosis: 2021 update. J Hepatol. 2021;75(3):659-689. https://doi.org/10.1016/j.jhep.2021.05.025
6. Simental-Mendía LE, Rodríguez-Morán M, Guerrero-Romero F. The product of fasting glucose and triglycerides as surrogate for identifying insulin resistance in apparently healthy subjects. Metab Syndr Relat Disord. 2008;6(4):299-304. https://doi.org/10.1089/met.2008.0034
7. Guerrero-Romero F, Simental-Mendía LE, González-Ortiz M, et al. The product of triglycerides and glucose, a simple measure of insulin sensitivity: comparison with the euglycemic-hyperinsulinemic clamp. J Clin Endocrinol Metab. 2010;95(7):3347-3351. https://doi.org/10.1210/jc.2010-0288
8. Er LK, Wu S, Chou HH, et al. Triglyceride glucose-body mass index is a simple and clinically useful surrogate marker for insulin resistance in nondiabetic individuals. PLoS One. 2016;11(3):e0149731. https://doi.org/10.1371/journal.pone.0149731
9. Wang R, Dai L, Zhong Y, Xie G. Usefulness of the triglyceride glucose-body mass index in evaluating nonalcoholic fatty liver disease: insights from a general population. Lipids Health Dis. 2021;20(1):77. https://doi.org/10.1186/s12944-021-01506-9
10. Hu H, Han Y, Cao C, He Y. The triglyceride glucose-body mass index: a non-invasive index that identifies non-alcoholic fatty liver disease in the general Japanese population. J Transl Med. 2022;20(1):398. https://doi.org/10.1186/s12967-022-03611-4
11. Khamseh ME, Malek M, Abbasi R, Taheri H, Lahouti M, Alaei-Shahmiri F. Triglyceride glucose index and related parameters identify nonalcoholic fatty liver and fibrosis in individuals with overweight/obesity. Metab Syndr Relat Disord. 2021;19(3):167-173. https://doi.org/10.1089/met.2020.0109
12. Wang M, Chang M, Shen P, et al. Application value of triglyceride-glucose index and triglyceride-glucose related indices in the evaluation of the degree of hepatic steatosis. Lipids Health Dis. 2023;22(1):186. https://doi.org/10.1186/s12944-023-01954-5
13. Karlas T, Petroff D, Sasso M, et al. Individual patient data meta-analysis of controlled attenuation parameter for assessing liver steatosis. J Hepatol. 2017;66(5):1022-1030. https://doi.org/10.1016/j.jhep.2016.12.022
14. Eddowes PJ, Sasso M, Allison M, et al. Accuracy of FibroScan controlled attenuation parameter and liver stiffness measurement in assessing steatosis and fibrosis in patients with nonalcoholic fatty liver disease. Gastroenterology. 2019;156(6):1717-1730. https://doi.org/10.1053/j.gastro.2019.01.042
15. Siddiqui MS, Vuppalanchi R, Van Natta ML, et al. Vibration-controlled transient elastography to assess fibrosis and steatosis in patients with nonalcoholic fatty liver disease. Clin Gastroenterol Hepatol. 2019;17(1):156-163.e2. https://doi.org/10.1016/j.cgh.2018.04.043
16. von Elm E, Altman DG, Egger M, Pocock SJ, Gøtzsche PC, Vandenbroucke JP; STROBE Initiative. The Strengthening the Reporting of Observational Studies in Epidemiology statement: guidelines for reporting observational studies. J Clin Epidemiol. 2008;61(4):344-349. https://doi.org/10.1016/j.jclinepi.2007.11.008
17. Bossuyt PM, Reitsma JB, Bruns DE, et al. STARD 2015: an updated list of essential items for reporting diagnostic accuracy studies. BMJ. 2015;351:h5527. https://doi.org/10.1136/bmj.h5527
18. DeLong ER, DeLong DM, Clarke-Pearson DL. Comparing the areas under two or more correlated receiver operating characteristic curves: a nonparametric approach. Biometrics. 1988;44(3):837-845. https://doi.org/10.2307/2531595.