Association of Neutrophil-to-Lymphocyte and Platelet-to-Lymphocyte Ratios with Clinical Severity in Schizophrenia, Bipolar Disorder, and Major Depressive Disorder.
- Recharla Priyanka , Senior resident, Department of Psychiatry, Institute of Mental Health, Osmania Medical College, Hyderabad, Telangana, India.
- K Rajeevi , Assistant Professor, Department of Psychiatry, Institute of Mental Health, Osmania Medical College, Hyderabad, Telangana, India.
- Sidharth Kadganchikar , Senior Resident, Department of Psychiatry, Institute of Mental Health, Osmania Medical College, Hyderabad, Telangana, India.
- PCB Gupta , Professor, Department of Psychiatry, Institute of Mental Health, Osmania Medical College, Hyderabad, Telangana, India.
Article Information:
Abstract:
Background: Inflammatory alterations are increasingly recognized across schizophrenia and mood disorders. Neutrophil-to-lymphocyte ratio (NLR) and platelet-to-lymphocyte ratio (PLR) are inexpensive complete-blood-count-derived measures, but their relationship with transdiagnostic clinical severity remains uncertain. Aim: To examine the association of NLR and PLR with clinician-rated illness severity in drug-naive and drug-free adults with schizophrenia, bipolar disorder, and major depressive disorder. Methods: This hospital-based cross-sectional study included 90 adults aged 18-60 years: 30 with schizophrenia, 30 with bipolar disorder, and 30 with major depressive disorder. Diagnoses were established using ICD-11 criteria. Participants were psychotropic-drug-naive or drug-free for at least 2 months after oral treatment or 3 months after depot treatment. Clinical severity was assessed in all participants using the Clinical Global Impression-Severity scale (CGI-S); PANSS, YMRS, and HAM-D were used for diagnosis-specific symptom assessment. NLR and PLR were calculated from automated complete blood counts. Pearson correlations were supplemented with Fisher z 95% confidence intervals and Holm adjustment for two co-primary tests. Results: NLR showed a moderate positive association with CGI-S severity (r=0.508, 95% CI 0.336-0.647; t(88)=5.53; raw and Holm-adjusted p<0.05), accounting for 25.8% of unadjusted variance. PLR was also positively associated with CGI-S (r=0.438, 95% CI 0.254-0.591; t(88)=4.57; raw and Holm-adjusted p<0.05), accounting for 19.2% of unadjusted variance. CGI-S category distributions differed among diagnoses, chi-square(4)=18.84, p<0.05, Cramer's V=0.324. Conclusions: Higher NLR and PLR were associated with greater global clinical severity in this transdiagnostic psychiatric sample. The associations were moderate and statistically robust; diagnosis, episode polarity, illness duration, body mass index, and other residual confounders may partly explain the findings. NLR and PLR should be regarded as investigational adjunctive markers rather than stand-alone measures of psychiatric severity.
Keywords:
Article :
INTRODUCTION:
Schizophrenia, bipolar disorder, and major depressive disorder are among the principal causes of disability worldwide and are associated with substantial clinical, social, and economic burden [1]. Although these disorders are defined by different symptom constellations, contemporary evidence supports partially shared biological pathways involving stress regulation, oxidative processes, neuroendocrine signaling, and immune-inflammatory activation [2]. A cross-disorder synthesis of 43 meta-analyses found reproducible inflammatory abnormalities across major psychiatric diagnoses, but also considerable heterogeneity and limited diagnostic specificity [2].
Peripheral immune changes may be clinically relevant because inflammatory activity can interact with neurotransmission, neuroplasticity, microglial function, hypothalamic-pituitary-adrenal signaling, sleep, and metabolic regulation [3,4]. In schizophrenia, cytokine alterations differ between acute exacerbation, first-episode psychosis, and treated states [3]. Recent meta-analytic evidence also demonstrates elevations in circulating immune-cell ratios in psychotic disorders, although medication exposure and illness phase contribute to between-study variability [5,6].
The neutrophil-to-lymphocyte ratio (NLR) integrates relative neutrophilia and lymphopenia and is often interpreted as a nonspecific index of innate-adaptive immune imbalance. The platelet-to-lymphocyte ratio (PLR) incorporates platelet abundance, which may reflect inflammatory and thrombo-inflammatory activity, relative to lymphocyte count. Both ratios can be calculated from a routine complete blood count, making them inexpensive and potentially scalable in settings where cytokine assays are not feasible [5,7]. Their simplicity, however, does not imply specificity: age, sex, adiposity, smoking, acute stress, infection, medical illness, circadian variation, and medication can influence values.
Evidence connecting these ratios with symptom burden is suggestive but inconsistent. In schizophrenia, higher NLR has been associated with PANSS and global severity scores in medication-naive and mixed-treatment samples [8-10]. A large retrospective study reported an independent relationship between NLR and severe psychopathology and observed changes following antipsychotic treatment [8]. Kovacs and colleagues similarly found associations between NLR and PANSS-positive, PANSS-general, and Clinical Global Impression scores [9]. Conversely, other studies have found elevated NLR in schizophrenia without a significant relationship to disease severity [11].
Mood-disorder studies also indicate episode- and severity-related variation. NLR and related ratios tend to be higher during manic episodes than during bipolar depression or unipolar depression [12,13]. In major depression, NLR has been correlated with symptom severity in adolescents [14], whereas PLR, rather than NLR, differentiated severe psychotic depression in another study [15]. These mixed observations suggest that NLR and PLR may index a transdiagnostic severity dimension, but the strength and independence of that relationship remain uncertain.
Medication is an important source of confounding because antipsychotics, antidepressants, mood stabilizers, and treatment-associated metabolic change may alter inflammatory measures. The present study minimized recent medication effects by recruiting psychotropic-drug-naive and drug-free participants and applied CGI-S as a common global severity measure across schizophrenia, bipolar disorder, and major depressive disorder. Diagnosis-specific scales were additionally administered to characterize symptom burden within each disorder.
Aims and Objectives
Aim
To determine whether NLR and PLR are associated with clinician-rated global illness severity in drug-naive and drug-free adults with schizophrenia, bipolar disorder, and major depressive disorder.
Primary objectives
• To quantify the association between NLR and CGI-S score in the complete transdiagnostic sample.
• To quantify the association between PLR and CGI-S score in the complete transdiagnostic sample.
Secondary objectives
• To describe CGI-S severity distributions across schizophrenia, bipolar disorder, and major depressive disorder.
• To characterize diagnosis-specific symptom severity using PANSS, YMRS, and HAM-D.
Hypothesis
Higher NLR and PLR values were hypothesized to be positively associated with greater clinical severity.
MATERIALS AND METHODS:
Study design, setting, and reporting
A hospital-based cross-sectional study was conducted over 12 months at the Institute of Mental Health, Erragadda, Hyderabad, a tertiary psychiatric facility affiliated with Osmania Medical College. Both inpatients and outpatients were recruited using convenience sampling. The analytical sample comprised 90 participants, with 30 participants each in the schizophrenia, bipolar disorder, and major depressive disorder groups. Reporting was organized in accordance with the STROBE statement for observational studies [23].
Participants and diagnostic procedure
Adults aged 18-60 years were eligible when they met ICD-11 diagnostic requirements for schizophrenia, bipolar disorder, or major depressive disorder [18]. Diagnoses were established through clinical psychiatric assessment. The bipolar-disorder group included 23 participants with a manic episode and 7 with a depressive episode. Participants were either drug-naive, defined as having received no prior psychiatric medication, or drug-free, defined as being off oral psychotropic medication for at least 2 months or long-acting/depot medication for at least 3 months before blood sampling.
Exclusion criteria were intellectual disability; harmful use or dependence involving psychoactive substances; organic or neurodegenerative disorders; active infection or fever; endocrine, inflammatory, autoimmune, cerebrovascular, renal, cardiac, or hepatic disease; diabetes mellitus; hypertension; cancer; body mass index greater than 30 kg/m2; heavy smoking exceeding 20 cigarettes/day; pregnancy or lactation; and treatment during the preceding 2 weeks with nonsteroidal anti-inflammatory drugs, aspirin, corticosteroids, immunosuppressive medication, or antibiotics. Participants provided written informed consent after receiving an explanation of study procedures.
Clinical assessment instruments
Table 1. Diagnostic and clinical assessment instruments
|
Instrument |
Clinical construct |
Administration and scoring |
Study population |
Role in this analysis |
|
ICD-11 CDDR |
Diagnostic classification |
Clinical descriptions and diagnostic requirements used to establish schizophrenia, bipolar disorder, and major depressive disorder [18]. |
All participants |
Eligibility and diagnostic grouping |
|
CGI-S |
Global clinical severity |
Single clinician-rated item scored from 1 (normal, not ill) to 7 (among the most extremely ill); higher scores indicate greater severity [22]. |
All participants |
Co-primary severity outcome |
|
PANSS |
Positive, negative, and general psychopathology |
Thirty clinician-rated items: Positive scale 7-49, Negative scale 7-49, General Psychopathology scale 16-112; higher scores indicate greater symptom burden [19]. |
Schizophrenia (n=30) |
Diagnosis-specific characterization |
|
YMRS |
Manic symptom severity |
Eleven clinician-rated items; four items scored 0-8 and seven scored 0-4; total range 0-60, with higher scores indicating greater mania [20]. |
Bipolar mania (n=23) |
Diagnosis-specific characterization |
|
HAM-D |
Depressive symptom severity |
Hamilton depression scale used to classify depressive symptom severity; higher scores indicate greater depression [21]. |
Bipolar depression (n=7) and MDD (n=30) |
Diagnosis-specific characterization |
Abbreviations: CDDR, Clinical Descriptions and Diagnostic Requirements; CGI-S, Clinical Global Impression-Severity; HAM-D, Hamilton Depression Rating Scale; MDD, major depressive disorder; PANSS, Positive and Negative Syndrome Scale; YMRS, Young Mania Rating Scale.
Blood collection and inflammatory ratios
Venous blood was collected into ethylenediaminetetraacetic acid-containing vacutainers and analyzed in the Institute of Mental Health diagnostic laboratory using an automated hematology analyzer. The complete blood count included total leukocyte count, red blood cell count, hemoglobin, platelet count, and differential leukocyte percentages. NLR was calculated as neutrophil count divided by lymphocyte count, and PLR as platelet count divided by lymphocyte count. Height, weight, waist circumference, and body mass index were also recorded.
Outcomes
The co-primary analyses were the Pearson correlations of NLR and PLR with CGI-S score across all 90 participants. Secondary analyses described the distribution of CGI-S categories by diagnosis and diagnosis-specific symptom-scale findings.
Statistical analysis
The source database was analyzed using IBM SPSS Statistics for Windows, version 26.0 (IBM Corp., Armonk, NY, USA). Continuous variables were summarized as mean and standard deviation, and categorical variables as number and percentage. Pearson correlation coefficients were used to quantify the association of NLR and PLR with CGI-S. For complete reporting, the reported coefficients and sample size were used to derive t statistics with 88 degrees of freedom, exact two-sided p values, coefficients of determination (r2), and Fisher z-transformed 95% confidence intervals. Holm adjustment was applied to the two co-primary correlation tests. CGI-S category distributions across diagnoses were compared using a Pearson chi-square test, with Cramer's V as the effect-size measure. These supplementary calculations were performed in Python 3.13.5 using NumPy 2.3.5 and SciPy 1.17.0 [24]. Statistical significance was defined as two-sided p<0.05.
Ethics
Institutional ethics committee approval was obtained from Osmania Medical College before participant recruitment. All participants provided written informed consent.
RESULTS:
Participant and clinical characteristics
All 90 participants were included in the reported analyses. The three diagnostic groups were balanced by sample size and sex. Mean age did not differ significantly across diagnoses, whereas duration of illness and body mass index differed. The sample included 23 participants with bipolar mania and 7 with bipolar depression.
Table 2. Participant characteristics and inflammatory measures by diagnosis
|
Characteristic |
Schizophrenia (n=30) |
Bipolar disorder (n=30) |
Major depressive disorder (n=30) |
Between-group result |
|
Age, years, mean +/- SD |
32.6 +/- 5.6 |
31.7 +/- 4.0 |
34.0 +/- 3.2 |
F(2,87)=2.10; p=0.129 |
|
Male sex, n (%) |
15 (50.0) |
15 (50.0) |
15 (50.0) |
No group difference |
|
Duration of illness, years, mean +/- SD |
6.4 +/- 5.6 |
6.9 +/- 3.9 |
0.7 +/- 0.2 |
F(2,87)=22.7; p<0.05 |
|
Body mass index, kg/m2, mean +/- SD |
24.0 +/- 0.3 |
26.0 +/- 1.5 |
24.1 +/- 0.5 |
F(2,87)=38.7; p<0.05 |
|
NLR, mean +/- SD |
3.23 +/- 0.10 |
3.21 +/- 0.50 |
2.30 +/- 0.10 |
F(2,87)=77.7; p<0.05 |
|
s |
138.4 +/- 2.6 |
131.6 +/- 3.7 |
128.2 +/- 2.1 |
F(2,87)=94.6; p<0.05 |
.
Diagnosis-specific symptom severity
Table 3. Diagnosis-specific symptom-scale findings
|
Clinical group |
n |
Scale |
Reported result |
Interpretation |
|
Schizophrenia |
30 |
PANSS |
Positive 25.0 +/- 1.42; Negative 20.0 +/- 1.43; General 18.0 +/- 1.50; Total 63.0 +/- 4.31 |
Moderate symptom burden within the observed score range |
|
Bipolar mania |
23 |
YMRS |
Mild: 8 (34.8%); Moderate: 15 (65.2%); Severe: 0 (0.0%) |
Predominantly moderate manic symptoms |
|
Bipolar depression |
7 |
HAM-D |
Mild: 3 (42.9%); Moderate: 4 (57.1%); Severe: 0 (0.0%) |
Predominantly moderate depressive symptoms |
|
Major depressive disorder |
30 |
HAM-D |
Mild: 14 (46.7%); Moderate: 16 (53.3%); Severe: 0 (0.0%) |
Approximately equal mild and moderate depression |
PANSS values are mean +/- SD; YMRS and HAM-D values are n (%).
Global clinical severity by diagnosis
CGI-S scores in the sample ranged from mildly ill to markedly ill. Schizophrenia had no mildly ill participants, whereas 40.0% of the major depressive disorder group was classified as mildly ill. The overall category distribution differed significantly by diagnosis, chi-square(4)=18.84, p<0.05, Cramer's V=0.324.
Table 4. CGI-S severity categories by diagnosis
|
CGI-S category |
Schizophrenia (n=30) |
Bipolar disorder (n=30) |
Major depressive disorder (n=30) |
Total (N=90) |
|
Mildly ill |
0 (0.0%) |
3 (10.0%) |
12 (40.0%) |
15 (16.7%) |
|
Moderately ill |
15 (50.0%) |
14 (46.7%) |
10 (33.3%) |
39 (43.3%) |
|
Markedly ill |
15 (50.0%) |
13 (43.3%) |
8 (26.7%) |
36 (40.0%) |
|
Total |
30 (100.0%) |
30 (100.0%) |
30 (100.0%) |
90 (100.0%) |
Association of inflammatory ratios with CGI-S
Both inflammatory ratios were positively associated with global clinical severity. NLR showed the larger coefficient, although the difference between the two correlations was not formally tested because the participant-level NLR-PLR covariance was unavailable. Both associations remained significant after Holm correction.
Table 5. Correlations of NLR and PLR with CGI-S severity
|
Marker |
r |
95% CI |
t (df) |
r2 |
Raw p |
Holm-adjusted p |
Magnitude |
Interpretation |
|
< |
0.508 |
0.336 to 0.647 |
5.53 (88) |
0.258 |
3.20e-07 |
6.41e-07 |
Moderate |
Higher ratio associated with greater CGI-S severity |
|
PLR |
0.438 |
0.254 to 0.591 |
4.57 (88) |
0.192 |
1.58e-05 |
1.58e-05 |
Moderate |
Higher ratio associated with greater CGI-S severity |
Pearson correlations were calculated across N=90 participants. Confidence intervals were derived using Fisher z transformation. r2 is the unadjusted proportion of variance shared with CGI-S. These estimates do not account for diagnosis or other confounding variables.
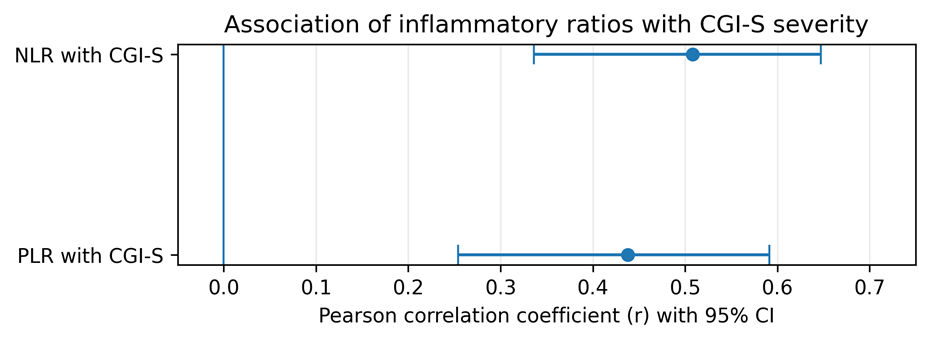
Figure 1. Pearson correlation coefficients of NLR and PLR with CGI-S severity, with Fisher z 95% confidence intervals.
DISCUSSION:
Principal findings
In this balanced transdiagnostic sample of 90 drug-naive and drug-free adults, both NLR and PLR were moderately and positively associated with CGI-S severity. The NLR-CGI-S coefficient was 0.508 and the PLR-CGI-S coefficient was 0.438; their confidence intervals excluded zero and both remained significant after correction for two co-primary tests. In unadjusted terms, NLR shared approximately 25.8% of variance with CGI-S and PLR shared 19.2%. These effect sizes are large enough to support further investigation, but not sufficiently specific or independent to justify clinical decision-making from a single blood count.
Comparison with schizophrenia literature
The NLR finding is consistent with several schizophrenia studies linking peripheral immune-cell ratios to psychopathology. Zhou and colleagues reported that NLR was independently associated with severe psychopathology in a large schizophrenia sample and changed after antipsychotic exposure [8]. Kovacs et al. found correlations between NLR and PANSS-positive, PANSS-general, and CGI scores and observed reductions after long-term treatment [9]. More recent work in first-episode medication-naive schizophrenia similarly associated NLR with positive, general, and total PANSS scores [10]. These studies support the possibility that NLR partly tracks acute symptom burden rather than merely diagnostic status.
Not all reports agree. Yuksel et al. found higher NLR in schizophrenia than in controls but no significant relationship with severity or illness-course variables [11]. Differences in sample size, medication exposure, acute versus chronic phase, medical exclusions, symptom distributions, and laboratory methods may explain the inconsistency. The present study reduced recent medication confounding but combined diagnoses and did not provide diagnosis-stratified correlations, limiting direct comparison with PANSS-focused studies.
Comparison with bipolar disorder and depression literature
The mood-disorder literature suggests that inflammatory ratios vary with episode polarity and severity. Koureta et al. reported higher NLR in mania than unipolar depression and higher monocyte-to-lymphocyte ratios in mania and bipolar depression [12]. Fusar-Poli et al. found higher neutrophils, platelets, NLR, and PLR in manic than depressed bipolar participants, with PLR independently associated with mania [13]. Because most bipolar participants in the present study were manic, episode composition may have strengthened the pooled relationship with CGI-S.
Depression studies have produced marker-specific findings. Ozyurt and Binici found that NLR correlated with depressive severity in adolescents [14], whereas Kayhan et al. observed higher PLR in severe psychotic depression but no clear NLR difference across depression types [15]. These observations align with the present finding that both ratios may relate to severity, while also indicating that NLR and PLR need not behave identically across populations, ages, and clinical phenotypes.
Interpretation and possible mechanisms
A positive NLR-severity relationship could reflect stress-related neutrophil mobilization, relative lymphocyte suppression, altered glucocorticoid signaling, sleep disruption, or a subgroup with greater innate immune activation. PLR may additionally reflect platelet activation and inflammatory thrombopoiesis. These pathways are biologically plausible, but the ratios are composite and nonspecific. They cannot distinguish psychiatric inflammation from physiological stress or unrecognized medical influences and should not be interpreted as direct measures of neuroinflammation.
The stronger observed coefficient for NLR than PLR is compatible with prior evidence that NLR is the more consistently elevated ratio in psychosis [5,6]. Nevertheless, the present data do not permit a valid statistical comparison of correlation magnitudes, and the difference may be due to measurement variation, diagnostic composition, or chance. Repeated sampling and multivariable models are needed to determine whether either marker provides information beyond diagnosis, symptom scale scores, and routine clinical variables.
Clinical implications
NLR and PLR are inexpensive, rapidly available, and potentially useful for research stratification. The current findings support examining whether these markers can complement, rather than replace, structured clinical assessment. A single elevated ratio should not be used to diagnose a psychiatric disorder, grade severity, determine prognosis, or initiate anti-inflammatory treatment. Clinical interpretation requires exclusion of infection, inflammatory disease, hematologic abnormalities, smoking effects, obesity, and medication-related changes.
Strengths
· Balanced representation of schizophrenia, bipolar disorder, and major depressive disorder, with 30 participants in each group.
· Use of CGI-S as a common clinician-rated severity measure across diagnostically heterogeneous disorders.
· Administration of diagnosis-specific instruments (PANSS, YMRS, and HAM-D) to characterize symptom burden.
· Inclusion of drug-naive and drug-free participants and extensive medical exclusion criteria, reducing several major sources of inflammatory confounding.
· Use of inexpensive complete-blood-count-derived markers that are feasible in resource-limited psychiatric settings.
· Complete effect-size reporting with 95% confidence intervals, exact p values, multiplicity adjustment, and a visual summary.
Limitations
· The cross-sectional design prevents determination of temporal direction or causality.
· The principal correlations were pooled across diagnoses and were not adjusted for diagnosis, episode polarity, age, sex, body mass index, illness duration, smoking, inpatient status, or drug-naive versus drug-free status. Because both severity distribution and inflammatory ratios differed by diagnosis, confounding is a major concern.
· Participant-level data were unavailable for multivariable regression, nonlinear assessment, residual diagnostics, outlier evaluation, or diagnosis-stratified correlation analysis.
· The sample was modest, recruited by convenience from a single tertiary center, and included only seven participants with bipolar depression.
· No healthy comparison group was included, so the study cannot determine whether values were elevated relative to the local general population.
· Drug-free participants could retain effects of prior treatment or illness chronicity; the numbers of drug-naive and drug-free participants by diagnosis were not reported.
· NLR and PLR are nonspecific and can be influenced by occult infection, acute stress, circadian timing, smoking, adiposity, menstrual factors, and laboratory procedures despite the exclusion criteria.
· The make/model of the hematology analyzer, blood-draw timing, fasting status, and repeatability of laboratory measurements were not documented in the supplied article
· The CGI-S is a broad clinician-rated measure and may not be strictly measurement-invariant across schizophrenia, mania, and depression.
Future directions
· Test diagnosis-by-marker and episode-polarity-by-marker interactions rather than assuming a common association across disorders.
· Conduct longitudinal studies with repeated CBC and symptom assessments before treatment, during acute care, and after remission to establish temporal responsiveness.
· Include healthy controls and locally validated reference distributions, while avoiding premature universal cutoffs.
· Combine NLR and PLR with C-reactive protein, interleukin-6, metabolic variables, sleep measures, and clinical outcomes to evaluate incremental validity.
· Use multicenter recruitment, standardized morning blood collection, recorded smoking and menstrual status, and prespecified blinded laboratory procedures.
· Assess whether changes in inflammatory ratios predict remission, relapse, hospitalization, functional recovery, or treatment response.
CONCLUSION:
Higher NLR and PLR were moderately associated with greater CGI-S-rated clinical severity across schizophrenia, bipolar disorder, and major depressive disorder in this drug-naive and drug-free sample. The associations were statistically precise after correction for two tests, but they were unadjusted and may be partly driven by diagnostic and clinical differences. NLR and PLR remain promising, accessible research markers; their independent clinical value requires participant-level adjusted analysis, longitudinal validation, and replication in larger multicenter samples.
REFERENCES:
1. GBD 2019 Diseases and Injuries Collaborators. Global burden of 369 diseases and injuries in 204 countries and territories, 1990-2019: a systematic analysis for the Global Burden of Disease Study 2019. Lancet. 2020;396(10258):1204-1222. doi: 10.1016/S0140-6736(20)30925-9
2. Yuan N, Chen Y, Xia Y, Dai J, Liu C. Inflammation-related biomarkers in major psychiatric disorders: a cross-disorder assessment of reproducibility and specificity in 43 meta-analyses. Transl Psychiatry. 2019;9:233. doi: 10.1038/s41398-019-0570-y
3. Miller BJ, Buckley P, Seabolt W, Mellor A, Kirkpatrick B. Meta-analysis of cytokine alterations in schizophrenia: clinical status and antipsychotic effects. Biol Psychiatry. 2011;70(7):663-671. doi: 10.1016/j.biopsych.2011.04.013
4. Poletti S, Mazza MG, Benedetti F. Inflammatory mediators in major depression and bipolar disorder. Transl Psychiatry. 2024;14:247. doi: 10.1038/s41398-024-02921-z
5. Mazza MG, Lucchi S, Rossetti A, Clerici M. Neutrophil-lymphocyte ratio, monocyte-lymphocyte ratio and platelet-lymphocyte ratio in non-affective psychosis: a meta-analysis and systematic review. World J Biol Psychiatry. 2020;21(5):326-338. doi: 10.1080/15622975.2019.1583371
6. Karageorgiou V, Milas GP, Michopoulos I. Neutrophil-to-lymphocyte ratio in schizophrenia: a systematic review and meta-analysis. Schizophr Res. 2019;206:4-12. doi: 10.1016/j.schres.2018.12.017
7. Mazza MG, Lucchi S, Tringali AGM, Rossetti A, Botti ER, Clerici M. Neutrophil/lymphocyte ratio and platelet/lymphocyte ratio in mood disorders: a meta-analysis. Prog Neuropsychopharmacol Biol Psychiatry. 2018;84:229-236. doi: 10.1016/j.pnpbp.2018.03.012
8. Zhou X, Wang X, Li R, Yan J, Xiao Y, Li W, et al. Neutrophil-to-lymphocyte ratio is independently associated with severe psychopathology in schizophrenia and is changed by antipsychotic administration: a large-scale cross-sectional retrospective study. Front Psychiatry. 2020;11:581061. doi: 10.3389/fpsyt.2020.581061
9. Kovacs MA, Tenyi T, Kugyelka R, Prenek L, Hau L, Magyar EE, et al. Elevated osteopontin and interferon gamma serum levels and increased neutrophil-to-lymphocyte ratio are associated with the severity of symptoms in schizophrenia. Front Psychiatry. 2020;10:996. doi: 10.3389/fpsyt.2019.00996
10. Wang X, Chen X, Guan X, Li Z. The neutrophil-to-lymphocyte ratio is associated with clinical symptoms in first-episode medication-naive patients with schizophrenia. Schizophrenia (Heidelb). 2024;10:13. doi: 10.1038/s41537-024-00437-5
11. Yuksel RN, Ertek IE, Dikmen AU, Goka E. High neutrophil-lymphocyte ratio in schizophrenia independent of infectious and metabolic parameters. Nord J Psychiatry. 2018;72(5):336-340. doi: 10.1080/08039488.2018.1458899
12. Koureta A, Asimakopoulos LO, Bozikas VP, Agorastos A. Immune cell ratios are higher in bipolar affective than unipolar depressive disorder and modulated by mood episode: a retrospective cross-sectional study. Brain Sci. 2023;13(3):448. doi: 10.3390/brainsci13030448
13. Fusar-Poli L, Natale A, Amerio A, Cimpoesu P, Grimaldi Filioli P, Aguglia E, et al. Neutrophil-to-lymphocyte, platelet-to-lymphocyte and monocyte-to-lymphocyte ratio in bipolar disorder. Brain Sci. 2021;11(1):58. doi: 10.3390/brainsci11010058
14. Ozyurt G, Binici NC. Increased neutrophil-lymphocyte ratios in depressive adolescents is correlated with the severity of depression. Psychiatry Res. 2018;268:426-431. doi: 10.1016/j.psychres.2018.08.007
15. Kayhan F, Gunduz S, Ersoy SA, Kandeger A, Annagur BB. Relationships of neutrophil-lymphocyte and platelet-lymphocyte ratios with the severity of major depression. Psychiatry Res. 2017;247:332-335. doi: 10.1016/j.psychres.2016.11.016
16. Bulut NS, Yorguner N, Carkaxhiu Bulut G. The severity of inflammation in major neuropsychiatric disorders: comparison of neutrophil-lymphocyte and platelet-lymphocyte ratios between schizophrenia, bipolar mania, bipolar depression, major depressive disorder, and obsessive-compulsive disorder. Nord J Psychiatry. 2021;75(8):624-632. doi: 10.1080/08039488.2021.1919201
17. Brinn A, Stone J. Neutrophil-lymphocyte ratio across psychiatric diagnoses: a cross-sectional study using electronic health records. BMJ Open. 2020;10(7):e036859. doi: 10.1136/bmjopen-2020-036859
18. World Health Organization. Clinical descriptions and diagnostic requirements for ICD-11 mental, behavioural and neurodevelopmental disorders. Geneva: World Health Organization; 2024. Available from: https://www.who.int/publications/i/item/9789240077263
19. Kay SR, Fiszbein A, Opler LA. The Positive and Negative Syndrome Scale for schizophrenia. Schizophr Bull. 1987;13(2):261-276. doi: 10.1093/schbul/13.2.261
20. Young RC, Biggs JT, Ziegler VE, Meyer DA. A rating scale for mania: reliability, validity and sensitivity. Br J Psychiatry. 1978;133:429-435. doi: 10.1192/bjp.133.5.429
21. Hamilton M. A rating scale for depression. J Neurol Neurosurg Psychiatry. 1960;23(1):56-62. doi: 10.1136/jnnp.23.1.56
22. Busner J, Targum SD. The Clinical Global Impressions Scale: applying a research tool in clinical practice. Psychiatry (Edgmont). 2007;4(7):28-37. Available from: https://pmc.ncbi.nlm.nih.gov/articles/PMC2880930/
23. von Elm E, Altman DG, Egger M, Pocock SJ, Gotzsche PC, Vandenbroucke JP; STROBE Initiative. The Strengthening the Reporting of Observational Studies in Epidemiology statement: guidelines for reporting observational studies. PLoS Med. 2007;4(10):e296. doi: 10.1371/journal.pmed.0040296
24. Virtanen P, Gommers R, Oliphant TE, Haberland M, Reddy T, Cournapeau D, et al. SciPy 1.0: fundamental algorithms for scientific computing in Python. Nat Methods. 2020;17(3):261-272. doi: 10.1038/s41592-019-0686-2.