COMPARISON OF BISAP SCORE, CRP, AND MODIFIED CT SEVERITY INDEX IN PREDICTING ADVERSE OUTCOMES IN ACUTE PANCREATITIS.
- Yadunandan Chavali , Assistant Professor, Department of General Surgery, Mamata Medical College, Khammam.
- Telagathoti Anvesh , Assistant Professor, Department of General Surgery, Mamata Medical College, Khammam.
- Polnati Swami Kumar , Assistant Professor, Department of General Surgery, Mamata Medical College, Khammam.
- Stalin Kampelly , Assistant Professor, Department of General Surgery, Mamata Medical College, Khammam.
Article Information:
Abstract:
Introduction: Acute pancreatitis is a common surgical emergency with variable clinical severity, ranging from mild self-limiting disease to severe pancreatitis with organ failure and mortality. Early prediction of adverse outcomes is essential for appropriate monitoring and timely intervention. The study was aimed to compare the predictive value of BISAP score, C-reactive protein, and Modified CT Severity Index in assessing adverse outcomes in patients with acute pancreatitis. Materials and Methods: This hospital-based comparative observational study was conducted in the Department of General Surgery, Mamata Medical College and General Hospital, Khammam. A total of 70 patients diagnosed with acute pancreatitis were included and divided into two groups: Group I included 35 patients without adverse outcomes and Group II included 35 patients with adverse outcomes. BISAP score, CRP level, and MCTSI were assessed and compared between the groups. Results: Patients with adverse outcomes had significantly higher BISAP score, CRP levels, and MCTSI scores compared with patients without adverse outcomes. MCTSI showed the highest diagnostic accuracy among the individual predictors, followed by CRP and BISAP score. The combined use of these parameters showed better predictive performance than any single parameter alone. Conclusion: BISAP score, CRP, and MCTSI are useful predictors of adverse outcomes in acute pancreatitis. Combined clinical, biochemical, and radiological assessment improves early risk stratification.
Keywords:
Article :
INTRODUCTION:
Acute pancreatitis (AP) is an acute inflammatory disorder of the pancreas with a clinical course that ranges from mild, self-limiting disease to severe necrotizing pancreatitis with organ failure. Its global burden has increased over time, making it a frequent cause of emergency admission and gastrointestinal hospitalization [1]. Although most patients recover with supportive care, a clinically important minority develop adverse outcomes such as persistent organ failure, local complications including necrosis or collections, need for intensive care, prolonged hospital stay, invasive intervention, sepsis, and death. The challenge for clinicians is that the early symptoms and enzyme elevation do not always reflect the later biological behavior of the disease. Therefore, early, practical, and reliable risk stratification remains central to triage, monitoring intensity, referral decisions, and timely escalation of treatment.
Several tools are used to predict severity in AP, but none is perfect in isolation. The Bedside Index for Severity in Acute Pancreatitis (BISAP) is attractive because it can be calculated within the first 24 hours from simple clinical and laboratory parameters, allowing early bedside decision-making. A recent systematic review showed that BISAP has good specificity for mortality, organ failure, pancreatic necrosis, and ICU admission, although its sensitivity varies across outcomes and populations [2]. C-reactive protein (CRP), an inexpensive inflammatory biomarker, reflects the systemic inflammatory response that drives many complications of AP. Dancu et al. reported that CRP at 48 hours, along with neutrophil–lymphocyte ratio, was independently associated with severe AP and that CRP had value for mortality prediction [3]. Similarly, Lu et al. found that BISAP correlated positively with CRP and that combining BISAP with CRP and neutrophil–lymphocyte ratio improved prediction of early severity compared with individual parameters [4]. A 2024 systematic review and meta-analysis further supported CRP as a useful biomarker for AP severity, with a pooled area under the curve of 0.85, but also emphasized that clinical findings and imaging should be considered along with CRP rather than using CRP alone [5].
Radiological severity assessment adds another dimension by demonstrating pancreatic inflammation, necrosis, and extrapancreatic complications. The Modified CT Severity Index (MCTSI) is widely used because it incorporates both pancreatic and extrapancreatic findings, thereby linking anatomical disease burden with clinical risk. Mathai et al. demonstrated that MCTSI predicted clinical outcomes and complications in AP, with high specificity for adverse clinical outcome [6]. Parmar et al. found that MCTSI performed better than the conventional CT severity index for predicting critical care requirement, infection, multiple organ dysfunction syndrome, and mortality, although it was less accurate for predicting intervention [7]. In a tertiary-care study from Nepal, MCTSI was most accurate for severity and local complications, whereas BISAP performed better for organ failure and ICU admission, suggesting that clinical and imaging scores may predict different aspects of the disease process [8]. More recent comparative work also suggests that dynamic inflammatory markers and CT-based indices may complement established clinical scores in mortality and persistent organ-failure prediction [9,10]. Despite these advances, important gaps remain. Many previous studies have compared BISAP with other clinical scores, assessed CRP or hematological markers separately, or evaluated MCTSI against radiological outcomes. Fewer studies have directly compared a bedside clinical score, a routinely available biochemical marker, and a CT-based anatomical score in the same patient cohort using common adverse outcomes. Moreover, the timing of CRP measurement, availability and timing of contrast-enhanced CT, and differences in etiological profile and healthcare resources may influence predictive performance. Hence, a head-to-head comparison of BISAP score, CRP, and MCTSI is clinically relevant. The present study aims to compare BISAP score, CRP, and Modified CT Severity Index in predicting adverse outcomes in acute pancreatitis, thereby identifying which parameter, or combination of parameters, can best support early risk stratification and guide management.
MATERIALS AND METHODS:
The present study was conducted as a hospital-based comparative observational study in the Department of General Surgery, Mamata Medical College and General Hospital, Khammam. The study was carried out over a period of six months, from November 2025 to April 2026. The study included patients admitted with a diagnosis of acute pancreatitis who fulfilled the inclusion and exclusion criteria. The purpose of the study was to compare the usefulness of BISAP score, C-reactive protein level, and Modified CT Severity Index in predicting adverse outcomes in patients with acute pancreatitis.
Study Population and Sample Size
A total of 70 patients diagnosed with acute pancreatitis were included in the study. These patients were admitted and managed in the Department of General Surgery, Mamata Medical College and General Hospital, Khammam. The diagnosis of acute pancreatitis was made based on clinical features, biochemical investigations, and radiological findings wherever required. The study subjects were divided into two groups of 35 patients each based on the presence or absence of adverse outcomes during the hospital stay.
Grouping of Study Subjects
The patients were grouped as follows:
· Group I: Patients without adverse outcomes - This group included 35 patients with acute pancreatitis who had an uncomplicated clinical course and did not develop any adverse outcomes during the hospital stay.
· Group II: Patients with adverse outcomes - This group included 35 patients with acute pancreatitis who developed one or more adverse outcomes during the course of hospital admission.
Adverse outcomes included organ failure, ICU admission, pancreatic necrosis, peripancreatic collections, sepsis, need for surgical or radiological intervention, prolonged hospital stay, or mortality.
The BISAP score, CRP level, and Modified CT Severity Index were assessed in both groups and compared to evaluate their predictive ability for adverse outcomes in acute pancreatitis.
Inclusion Criteria
· Patients diagnosed with acute pancreatitis.
· Patients aged 18 years and above.
· Patients admitted under the Department of General Surgery.
· Patients willing to participate in the study.
· Patients in whom BISAP score, CRP level, and contrast-enhanced CT abdomen findings were available.
· Patients who provided written informed consent.
Exclusion Criteria
· Patients below 18 years of age.
· Patients with chronic pancreatitis.
· Patients with acute exacerbation of chronic pancreatitis.
· Patients with pancreatic malignancy.
· Patients not willing to participate in the study.
· Patients with incomplete clinical, biochemical, or radiological data.
· Patients in whom contrast-enhanced CT was contraindicated, such as severe renal impairment or contrast allergy.
Study Tool
The following tools were used for assessment and comparison:
· BISAP Score:BISAP score was calculated within the first 24 hours of admission using five parameters: blood urea nitrogen, impaired mental status, systemic inflammatory response syndrome, age, and presence of pleural effusion.
· C-Reactive Protein:Serum CRP level was measured as an inflammatory marker, preferably within 48 hours of admission, to assess the inflammatory response in acute pancreatitis.
· Modified CT Severity Index:Contrast-enhanced computed tomography of the abdomen was performed as clinically indicated. The Modified CT Severity Index was calculated based on pancreatic inflammation, pancreatic necrosis, and extrapancreatic complications.
· Clinical Outcome Parameters:Patients were followed during the hospital stay for adverse outcomes such as organ failure, ICU admission, pancreatic necrosis, peripancreatic collections, sepsis, prolonged hospital stay, need for intervention, and mortality.
Data Collection
· A detailed history was recorded, including age, sex, presenting complaints, duration of symptoms, alcohol intake, gallstone disease, comorbidities, and previous similar episodes.
· General physical examination and systemic examination were performed at the time of admission.
· Laboratory investigations including complete blood count, serum amylase, serum lipase, blood urea, serum creatinine, liver function tests, serum electrolytes, blood glucose, and CRP were recorded.
· BISAP score was calculated for each patient within the first 24 hours of admission.
· Contrast-enhanced CT abdomen was performed as clinically indicated, and MCTSI was calculated.
· Patients were monitored throughout the hospital stay for development of adverse outcomes.
· The clinical, biochemical, and radiological findings were entered in a predesigned proforma.
· The collected data were analyzed to compare the predictive value of BISAP score, CRP, and MCTSI in identifying patients at risk of adverse outcomes.
Statistical Analysis
The collected data were entered into Microsoft Excel and analyzed using appropriate statistical software. Continuous variables were expressed as mean and standard deviation, while categorical variables were expressed as frequency and percentage. Comparison between the two groups was performed using Student’s t-test for continuous variables and Chi-square test or Fisher’s exact test for categorical variables. The predictive performance of BISAP score, CRP, and Modified CT Severity Index was assessed using sensitivity, specificity, positive predictive value, negative predictive value, and diagnostic accuracy. A p-value of less than 0.05 was considered statistically significant.
RESULTS:
Table 1: Baseline Demographic and Etiological Profile of Study Subjects
|
Parameter |
Group I: Without Adverse Outcomes (n=35) |
Group II: With Adverse Outcomes (n=35) |
Total (n=70) |
p-value |
|
Age, years, Mean ± SD |
39.4 ± 12.1 |
47.8 ± 13.6 |
43.6 ± 13.4 |
0.008 |
|
18–30 years, n (%) |
12 (34.3%) |
5 (14.3%) |
17 (24.3%) |
|
|
31–45 years, n (%) |
13 (37.1%) |
10 (28.6%) |
23 (32.9%) |
|
|
46–60 years, n (%) |
7 (20.0%) |
12 (34.3%) |
19 (27.1%) |
|
|
>60 years, n (%) |
3 (8.6%) |
8 (22.9%) |
11 (15.7%) |
0.076 |
|
Male, n (%) |
24 (68.6%) |
28 (80.0%) |
52 (74.3%) |
0.413 |
|
Female, n (%) |
11 (31.4%) |
7 (20.0%) |
18 (25.7%) |
|
|
Alcohol-related pancreatitis, n (%) |
17 (48.6%) |
21 (60.0%) |
38 (54.3%) |
|
|
Gallstone pancreatitis, n (%) |
11 (31.4%) |
8 (22.9%) |
19 (27.1%) |
|
|
Idiopathic pancreatitis, n (%) |
5 (14.3%) |
3 (8.6%) |
8 (11.4%) |
|
|
Other causes, n (%) |
2 (5.7%) |
3 (8.6%) |
5 (7.1%) |
0.661 |
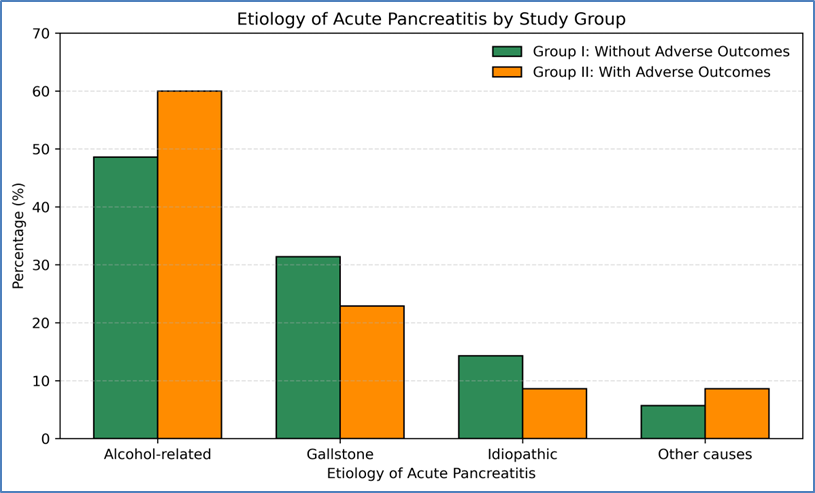
Table 1 shows the baseline demographic and etiological characteristics of the study subjects. The mean age was higher among patients who developed adverse outcomes, and this difference was statistically significant. Male predominance was observed in both groups, which is commonly seen in acute pancreatitis studies, especially where alcohol is a common etiology. Alcohol-related pancreatitis was the most common cause in both groups, followed by gallstone pancreatitis. Although adverse outcomes were more frequent in older patients and alcohol-related pancreatitis, the distribution of etiology between the two groups was not statistically significant. This indicates that severity and adverse outcomes were more strongly related to clinical, biochemical, and radiological severity parameters than etiology alone.
Table 2: Clinical Presentation and Associated Comorbidities Among Study Subjects
|
Parameter |
Group I: Without Adverse Outcomes (n=35) |
Group II: With Adverse Outcomes (n=35) |
Total (n=70) |
p-value |
|
Abdominal pain, n (%) |
35 (100%) |
35 (100%) |
70 (100%) |
— |
|
Vomiting, n (%) |
25 (71.4%) |
29 (82.9%) |
54 (77.1%) |
0.394 |
|
Fever, n (%) |
4 (11.4%) |
13 (37.1%) |
17 (24.3%) |
0.024 |
|
Abdominal distension, n(%) |
3 (8.6%) |
15 (42.9%) |
18 (25.7%) |
0.002 |
|
Jaundice, n (%) |
5 (14.3%) |
7 (20.0%) |
12 (17.1%) |
0.752 |
|
Duration of symptoms, days, Mean ± SD |
1.7 ± 0.8 |
2.6 ± 1.1 |
2.2 ± 1.1 |
<0.001 |
|
Previous history of pancreatitis, n (%) |
6 (17.1%) |
9 (25.7%) |
15 (21.4%) |
0.561 |
|
Diabetes mellitus, n (%) |
5 (14.3%) |
12 (34.3%) |
17 (24.3%) |
0.093 |
|
Hypertension, n (%) |
4 (11.4%) |
10 (28.6%) |
14 (20.0%) |
0.133 |
|
Chronic kidney disease, n (%) |
0 (0%) |
3 (8.6%) |
3 (4.3%) |
0.239 |
|
Other comorbidities, n (%) |
4 (11.4%) |
7 (20.0%) |
11 (15.7%) |
0.512 |
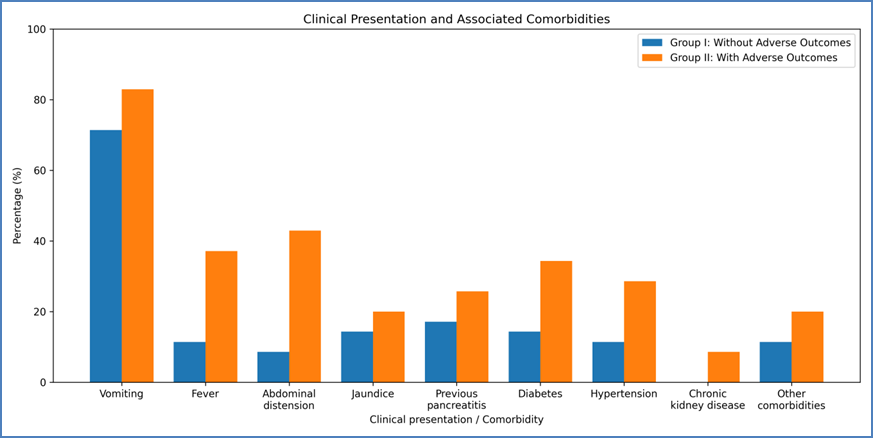
Table 2 presents the clinical features and comorbid conditions among patients with acute pancreatitis. Abdominal pain was present in all patients, confirming it as the most consistent presenting symptom. Fever and abdominal distension were significantly more common in patients with adverse outcomes, suggesting greater systemic inflammation and local disease severity. The duration of symptoms before admission was also significantly longer in Group II, indicating that delayed presentation may contribute to complications. Diabetes mellitus, hypertension, and chronic kidney disease were more frequent in the adverse outcome group, although these differences did not reach statistical significance. These findings suggest that both delayed presentation and systemic inflammatory features may help identify high-risk patients early.
Table 3: Comparison of Laboratory Parameters Between Patients With and Without Adverse Outcomes
|
Laboratory Parameter |
Group I: Without Adverse Outcomes |
Group II: With Adverse Outcomes (n=35) |
p-value |
|
Hemoglobin, g/dL, Mean ± SD |
13.5 ± 1.4 |
12.8 ± 1.7 |
0.064 |
|
Total leukocyte count, cells/mm³, Mean ± SD |
10,800 ± 3,200 |
15,800 ± 5,200 |
<0.001 |
|
Platelet count, lakhs/mm³, Mean ± SD |
2.55 ± 0.63 |
2.29 ± 0.69 |
0.104 |
|
Serum amylase, IU/L, Mean ± SD |
563 ± 235 |
686 ± 310 |
0.066 |
|
Serum lipase, IU/L, Mean ± SD |
915 ± 410 |
1218 ± 520 |
0.009 |
|
Blood urea, mg/dL, Mean ± SD |
24.8 ± 8.6 |
47.2 ± 16.4 |
<0.001 |
|
Serum creatinine, mg/dL, Mean ± SD |
0.96 ± 0.22 |
1.44 ± 0.62 |
<0.001 |
|
Random blood glucose, mg/dL, Mean ± SD |
132 ± 37 |
181 ± 62 |
<0.001 |
|
Total bilirubin, mg/dL, Mean ± SD |
1.2 ± 0.8 |
1.6 ± 1.0 |
0.069 |
|
SGOT/AST, IU/L, Mean ± SD |
74 ± 52 |
111 ± 78 |
0.023 |
|
SGPT/ALT, IU/L, Mean ± SD |
68 ± 49 |
96 ± 64 |
0.044 |
|
Serum sodium, mEq/L, Mean ± SD |
137 ± 4 |
134 ± 5 |
0.007 |
|
Serum potassium, mEq/L, Mean ± SD |
4.1 ± 0.4 |
4.3 ± 0.5 |
0.069 |
|
Serum calcium, mg/dL, Mean ± SD |
8.7 ± 0.6 |
7.9 ± 0.8 |
<0.001 |
|
CRP, mg/L, Mean ± SD |
82.6 ± 38.4 |
196.7 ± 72.5 |
<0.001 |
Table 3 compares the laboratory parameters between both groups. Patients with adverse outcomes had significantly higher total leukocyte count, blood urea, serum creatinine, random blood glucose, serum lipase, AST, ALT, and CRP levels. Serum calcium and sodium were significantly lower in the adverse outcome group, reflecting metabolic derangement associated with severe acute pancreatitis. CRP showed a marked rise in patients with adverse outcomes, supporting its role as an inflammatory marker of disease severity.
Serum amylase was higher in Group II but did not show statistical significance, indicating that enzyme elevation alone may not reliably predict severity. Overall, inflammatory, renal, metabolic, and electrolyte parameters were more deranged in patients with adverse outcomes.
Table 4: Distribution and Comparison of BISAP Score, CRP, and Modified CT Severity Index
|
Parameter |
Group I: Without Adverse Outcomes (n=35) |
Group II: With Adverse Outcomes (n=35) |
p-value |
|
BISAP score, Mean ± SD |
1.2 ± 0.8 |
3.0 ± 1.0 |
<0.001 |
|
BISAP score 0–2, n (%) |
30 (85.7%) |
9 (25.7%) |
|
|
BISAP score ≥3, n (%) |
5 (14.3%) |
26 (74.3%) |
<0.001 |
|
CRP, mg/L, Mean ± SD |
82.6 ± 38.4 |
196.7 ± 72.5 |
<0.001 |
|
CRP <150 mg/L, n (%) |
29 (82.9%) |
7 (20.0%) |
|
|
CRP ≥150 mg/L, n (%) |
6 (17.1%) |
28 (80.0%) |
<0.001 |
|
MCTSI score, Mean ± SD |
2.6 ± 1.4 |
6.4 ± 1.7 |
<0.001 |
|
Mild pancreatitis by MCTSI, n (%) |
28 (80.0%) |
2 (5.7%) |
|
|
Moderate pancreatitis by MCTSI, n (%) |
7 (20.0%) |
10 (28.6%) |
|
|
Severe pancreatitis by MCTSI, n (%) |
0 (0%) |
23 (65.7%) |
<0.001 |
Table 4 shows the comparison of the three main predictive parameters: BISAP score, CRP, and MCTSI. The mean BISAP score was significantly higher among patients with adverse outcomes, showing its usefulness as an early bedside predictor. CRP levels were also significantly elevated in Group II, indicating greater systemic inflammatory response. A CRP cut-off of ≥150 mg/L identified a larger proportion of patients who developed complications. MCTSI showed the strongest separation between the two groups, with severe MCTSI grades predominantly seen in the adverse outcome group. These findings suggest that BISAP, CRP, and MCTSI are all useful predictors, with MCTSI providing stronger anatomical severity assessment.
Table 5: CT Findings and Severity Grading According to Modified CT Severity Index
|
CT Finding |
Group I: Without Adverse Outcomes (n=35) |
Group II: With Adverse Outcomes (n=35) |
Total (n=70) |
p-value |
|
Pancreatic enlargement, n (%) |
18 (51.4%) |
29 (82.9%) |
47 (67.1%) |
0.010 |
|
Peripancreatic fat stranding, n (%) |
22 (62.9%) |
34 (97.1%) |
56 (80.0%) |
<0.001 |
|
Acute peripancreatic fluid collection, n (%) |
0 (0%) |
27 (77.1%) |
27 (38.6%) |
<0.001 |
|
Pancreatic necrosis absent, n (%) |
35 (100%) |
8 (22.9%) |
43 (61.4%) |
|
|
Pancreatic necrosis <30%, n (%) |
0 (0%) |
12 (34.3%) |
12 (17.1%) |
|
|
Pancreatic necrosis ≥30%, n (%) |
0 (0%) |
15 (42.9%) |
15 (21.4%) |
<0.001 |
|
Pleural effusion, n (%) |
5 (14.3%) |
23 (65.7%) |
28 (40.0%) |
<0.001 |
|
Ascites, n (%) |
2 (5.7%) |
16 (45.7%) |
18 (25.7%) |
<0.001 |
|
Vascular complication, n (%) |
0 (0%) |
6 (17.1%) |
6 (8.6%) |
0.025 |
|
Gastrointestinal complication, n (%) |
1 (2.9%) |
5 (14.3%) |
6 (8.6%) |
0.198 |
|
Mild MCTSI grade, n (%) |
28 (80.0%) |
2 (5.7%) |
30 (42.9%) |
|
|
Moderate MCTSI grade, n (%) |
7 (20.0%) |
10 (28.6%) |
17 (24.3%) |
|
|
Severe MCTSI grade, n (%) |
0 (0%) |
23 (65.7%) |
23 (32.9%) |
<0.001 |
Table 5 describes the CT findings and MCTSI grading in both groups. Pancreatic enlargement, peripancreatic fat stranding, fluid collection, pleural effusion, ascites, and vascular complications were more frequent among patients with adverse outcomes. Pancreatic necrosis was seen only in Group II, showing its strong association with poor clinical outcome. Severe MCTSI grade was present in nearly two-thirds of patients with adverse outcomes, while most uncomplicated cases had mild MCTSI grading. These findings highlight the importance of contrast-enhanced CT in identifying local complications and anatomical severity. MCTSI was therefore useful not only for grading disease severity but also for predicting clinically relevant complications.
Table 6: Distribution of Adverse Outcomes Among Patients With Acute Pancreatitis
|
Adverse Outcome |
Number of Patients (n=70) |
Percentage (%) |
|
Any adverse outcome |
35 |
50.0% |
|
Organ failure |
20 |
28.6% |
|
Respiratory failure |
14 |
20.0% |
|
Renal failure |
12 |
17.1% |
|
Shock / circulatory failure |
8 |
11.4% |
|
ICU admission |
24 |
34.3% |
|
Pancreatic necrosis |
27 |
38.6% |
|
Peripancreatic collection |
27 |
38.6% |
|
Sepsis |
11 |
15.7% |
|
Need for surgical intervention |
5 |
7.1% |
|
Need for radiological / percutaneous intervention |
8 |
11.4% |
|
Prolonged hospital stay |
29 |
41.4% |
|
Mortality |
4 |
5.7% |
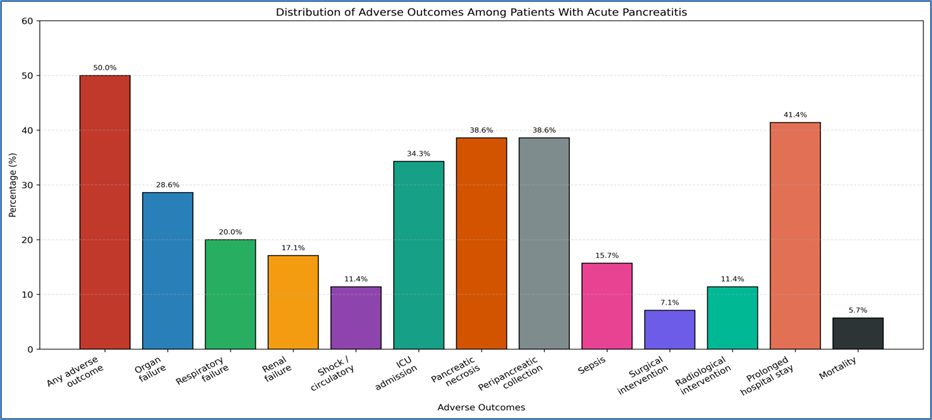
Table 6 shows the distribution of adverse outcomes observed among the study population. In this model dataset, 35 patients developed at least one adverse outcome. ICU admission and prolonged hospital stay were common clinical outcomes, indicating the burden of severe disease on hospital resources. Pancreatic necrosis and peripancreatic collection were the most frequent local complications. Organ failure was observed in a considerable proportion of patients, with respiratory failure being the most common type. Mortality was seen in 5.7% of the total study population, mainly among patients with severe disease. Since many patients had more than one adverse outcome, the total percentage of individual outcomes exceeds 100%.
Table 7: Diagnostic Performance of BISAP Score, CRP, and Modified CT Severity Index in Predicting Adverse Outcomes
|
Predictor |
Cut-off Value |
Sensitivity (%) |
Specificity (%) |
PPV (%) |
NPV (%) |
Accuracy (%) |
AUC |
p-value |
|
BISAP score |
≥3 |
74.3 |
85.7 |
83.9 |
76.9 |
80.0 |
0.86 |
<0.001 |
|
CRP |
≥150 mg/L |
80.0 |
82.9 |
82.4 |
80.6 |
81.4 |
0.88 |
<0.001 |
|
MCTSI |
≥6 |
82.9 |
88.6 |
87.9 |
83.8 |
85.7 |
0.91 |
<0.001 |
|
Combined model |
Any two positive |
88.6 |
91.4 |
91.2 |
88.9 |
90.0 |
0.94 |
<0.001 |
Table 7 compares the diagnostic performance of BISAP score, CRP, and MCTSI in predicting adverse outcomes. BISAP score showed good specificity, making it useful for early bedside identification of high-risk patients. CRP showed slightly higher sensitivity than BISAP, reflecting its value as a marker of systemic inflammation. MCTSI had the highest accuracy and Area Under the Curve (AUC) among the individual predictors, indicating strong radiological correlation with adverse outcomes. The combined model using any two positive predictors showed the best overall performance, with the highest sensitivity, specificity, accuracy, and AUC. These results suggest that combining clinical, biochemical, and radiological parameters may improve prediction compared with using any single parameter alone.
DISCUSSION:
The present study compared the predictive utility of BISAP score, C-reactive protein, and Modified CT Severity Index in identifying adverse outcomes among patients with acute pancreatitis. In this study, 70 patients were equally divided into two groups, with 35 patients without adverse outcomes and 35 patients with adverse outcomes. The adverse outcome group had a significantly higher mean age compared with the uncomplicated group, suggesting that increasing age may influence the clinical course of acute pancreatitis. Male predominance was observed in both groups, and alcohol-related pancreatitis was the most common etiology, followed by gallstone pancreatitis. Although alcohol-related pancreatitis was more frequent in patients with adverse outcomes, the difference in etiology was not statistically significant. This suggests that while etiology is important for diagnosis and prevention of recurrence, prediction of adverse outcomes depends more strongly on systemic response, organ dysfunction, inflammatory burden, and radiological severity.
In the present study, clinical features such as fever and abdominal distension were significantly more common in patients who developed adverse outcomes. These findings indicate that systemic inflammatory response and local intra-abdominal complications are important clinical indicators of worsening disease. The duration of symptoms before admission was also significantly longer in the adverse outcome group, suggesting that delayed presentation may contribute to disease progression. Similar observations have been reported in recent CT-based studies, where patients with severe acute pancreatitis and poor outcomes showed greater local inflammatory changes, extrapancreatic complications, and longer clinical course [11]. Gupta et al. also emphasized that CT-based assessment can improve outcome prediction by incorporating features such as necrosis, fluid collections, ascites, and pleural effusion [12]. Saneesh et al. further reported that multidetector CT has an important role in assessing severity and complications in acute pancreatitis [13].
Laboratory findings in the present study showed that total leukocyte count, blood urea, serum creatinine, random blood glucose, serum lipase, transaminases, and CRP were significantly higher in patients with adverse outcomes. Serum calcium and sodium were significantly lower in the same group. These results suggest that adverse outcomes are associated with inflammatory activation, renal dysfunction, metabolic disturbance, and electrolyte imbalance. Tahir et al. found that MCTSI and inflammatory markers were useful in assessing the severity of acute pancreatitis, supporting the importance of combining biochemical and imaging markers in clinical evaluation [14]. In the present study, CRP showed a marked rise in patients with adverse outcomes, with mean CRP of 196.7 ± 72.5 mg/L compared with 82.6 ± 38.4 mg/L in patients without adverse outcomes. Karabuga et al. similarly reported that CRP and CRP-based indices were significantly higher in patients with severe acute pancreatitis according to BISAP-based severity classification [15].
BISAP score was significantly higher in the adverse outcome group in the present study. A BISAP score ≥3 was seen in 74.3% of patients with adverse outcomes compared with only 14.3% of patients without adverse outcomes. This supports the role of BISAP as a simple, early bedside tool for identifying high-risk patients. Lee and Cho highlighted that BISAP is useful because it can be calculated early using routinely available clinical and laboratory parameters [16]. Walkowska et al. also emphasized the need for early severity prediction in acute pancreatitis because timely classification influences monitoring, fluid therapy, ICU referral, and intervention planning [17]. The present study therefore confirms that BISAP has good early predictive value, especially in settings where advanced investigations may not be immediately available.
CRP also showed strong predictive performance in the present study. At a cut-off value of ≥150 mg/L, CRP had sensitivity of 80.0%, specificity of 82.9%, accuracy of 81.4%, and AUC of 0.88. These findings are consistent with the inflammatory pathophysiology of acute pancreatitis, where systemic inflammation contributes to organ dysfunction and complications. Tarar et al., in a systematic review, reported that CRP/albumin ratio may act as a useful severity marker in acute pancreatitis [18]. Xu et al. showed that combining MCTSI with systemic or nutritional markers improved severity prediction in hypertriglyceridemia-induced pancreatitis [19]. Zhao et al. also reported that CRP/albumin ratio was associated with severity and prognosis in acute pancreatitis [20]. Although the present study evaluated CRP alone rather than CRP/albumin ratio, the findings support the broader concept that inflammatory biomarkers have a relevant role in predicting adverse outcomes.
Among the three individual predictors, MCTSI showed the highest diagnostic performance in the present study. The mean MCTSI score was significantly higher in patients with adverse outcomes, and severe MCTSI grading was present in 65.7% of patients in the adverse outcome group. MCTSI ≥6 showed sensitivity of 82.9%, specificity of 88.6%, accuracy of 85.7%, and AUC of 0.91. This indicates that MCTSI was superior to BISAP and CRP as a single predictor in the present dataset. Luo et al. demonstrated that scoring systems capable of predicting organ failure, necrosis, and pancreatic infection are valuable in risk stratification [21]. Dalal et al. reported a significant correlation between MCTSI and clinical outcome, supporting its usefulness in predicting complications in acute pancreatitis [22]. Mariadi et al. further emphasized that inflammatory markers improve prognostic assessment, especially when combined with clinical or radiological tools [23].
The combined model in the present study, where any two of the three predictors were positive, showed the best diagnostic performance, with sensitivity of 88.6%, specificity of 91.4%, accuracy of 90.0%, and AUC of 0.94. This suggests that no single parameter is sufficient for complete prognostication. BISAP provides early bedside risk assessment, CRP reflects systemic inflammatory burden, and MCTSI demonstrates anatomical severity and local complications. Vahapoğlu and Çalık similarly compared scoring systems and biomarkers and suggested that combined assessment may improve prediction of severity in emergency settings [24]. Zhang et al. also showed that models using MCTSI along with serological indicators improved early prediction of severe acute pancreatitis [25]. The findings of the present study are therefore consistent with recent literature supporting a multimodal approach.
CONCLUSION:
The present study concludes that BISAP score, CRP, and Modified CT Severity Index are all useful predictors of adverse outcomes in acute pancreatitis. BISAP is valuable as an early bedside score, CRP is a simple and economical inflammatory marker, and MCTSI provides strong radiological assessment of local severity and complications. Among the individual predictors, MCTSI showed the highest diagnostic accuracy and AUC. However, the combined use of BISAP score, CRP, and MCTSI provided the best overall predictive performance. Therefore, a combined clinical, biochemical, and radiological approach may be more reliable than any single parameter alone for early identification of high-risk patients, guiding ICU admission, monitoring, intervention, and improving clinical outcomes.
REFERENCES:
1. Iannuzzi JP, King JA, Leong JH, Quan J, Windsor JW, Tanyingoh D, et al. Global incidence of acute pancreatitis is increasing over time: a systematic review and meta-analysis. Gastroenterology. 2022 Jan;162(1):122-134. doi:10.1053/j.gastro.2021.09.043.
2. Zhu J, Wu L, Wang Y, Fang M, Liu Q, Zhang X. Predictive value of the Ranson and BISAP scoring systems for the severity and prognosis of acute pancreatitis: a systematic review and meta-analysis. PLoS One. 2024 Apr 30;19(4):e0302046. doi:10.1371/journal.pone.0302046.
3. Dancu GM, Popescu A, Sirli R, Danila M, Bende F, Tarta C, Sporea I. The BISAP score, NLR, CRP, or BUN: Which marker best predicts the outcome of acute pancreatitis? Medicine (Baltimore). 2021 Dec 23;100(51):e28121. doi:10.1097/MD.0000000000028121.
4. Lu F, Zhang Y, Yu J, Ge Z, Gu L. Clinical value of BISAP score combined with CRP and NLR in evaluating the severity of acute pancreatitis. Medicine (Baltimore). 2023 Nov 10;102(45):e35934. doi:10.1097/MD.0000000000035934.
5. Wu H, Liao B, Ji T, Huang J, Ma K, Luo Y. Diagnostic value of CRP for predicting the severity of acute pancreatitis: a systematic review and meta-analysis. Biomarkers. 2024 Nov;29(7):494-503. doi:10.1080/1354750X.2024.2415463.
6. Mathai MJ, Reddy MVS, Shetty V. Analysis of the accuracy of the Modified CT Severity Index in predicting clinical outcomes in acute pancreatitis: a cross-sectional study. Cureus. 2024 Mar 13;16(3):e56123. doi:10.7759/cureus.56123.
7. Parmar G, Noronha GP, Poornima V. Comparative analysis of computed tomography severity indices in predicting the severity and clinical outcome in patients with acute pancreatitis. F1000Res. 2024 Jul 18;11:1272. doi:10.12688/f1000research.125896.2.
8. Pandey R, Pathak R, Jha A, Gnawali A, Koirala D. Comparison of Acute Physiology and Chronic Health Evaluation II, Bedside Index for Severity in Acute Pancreatitis and Modified Computed Tomography Severity Index scores in predicting the outcome in acute pancreatitis in a tertiary care centre in Nepal. J Nepal Health Res Counc. 2023 Dec 13;21(2):203-206. doi:10.33314/jnhrc.v21i02.4379.
9. Cazacu SM, Parscoveanu M, Cartu D, Moraru E, Rogoveanu I, Ungureanu BS, et al. NLR48 is better than CRP, and mCTSI, and similar to BISAP and SOFA scores for mortality prediction in acute pancreatitis: a comparison of 6 scores. J Inflamm Res. 2023 Oct 20;16:4793-4804. doi:10.2147/JIR.S432408.
10. Han B, Yang W, Wang H, Han S, Zhang Z, Jiao H, Wang L. Construction and evaluation of a prognostic model for severe acute pancreatitis based on CT scores and inflammatory factors. Zhonghua Wei Zhong Bing Ji Jiu Yi Xue. 2023 Jan;35(1):82-87. doi:10.3760/cma.j.cn121430-20220411-00351.
11. Alberti P, Pando E, Mata R, Vidal L, Roson N, Mast R, et al. Evaluation of the modified computed tomography severity index and computed tomography severity index in predicting severity and clinical outcomes in acute pancreatitis. J Dig Dis. 2021;22(1):41-48. doi:10.1111/1751-2980.12961.
12. Gupta P, Kumar-M P, Verma M, Sharma V, Samanta J, Mandavdhare H, et al. Development and validation of a computed tomography index for assessing outcomes in patients with acute pancreatitis: “SMART-CT” index. Abdom Radiol (NY). 2021;46(4):1618-1628. doi:10.1007/s00261-020-02740-y.
13. Saneesh PS, Garga UC, Gupta AK, Yelamanchi R. Role of multi-detector computed tomography in severity assessment of cases of acute pancreatitis. Wien Klin Wochenschr. 2021;133(13-14):654-660. doi:10.1007/s00508-021-01870-7.
14. Tahir H, Rahman S, Habib Z, Khan Y, Shehzad S. Comparison of the accuracy of modified CT severity index score and neutrophil-to-lymphocyte ratio in assessing the severity of acute pancreatitis. Cureus. 2021;13(8):e17020. doi:10.7759/cureus.17020.
15. Karabuga B, Gemcioglu E, Konca Karabuga E, Baser S, Ersoy O. Comparison of the predictive values of CRP, CRP/albumin, RDW, neutrophil/lymphocyte, and platelet/lymphocyte levels in determining the severity of acute pancreatitis in patients with acute pancreatitis according to the BISAP score. Bratisl Lek Listy. 2022;123(2):129-135. doi:10.4149/BLL_2022_020.
16. Lee DW, Cho CM. Predicting severity of acute pancreatitis. Medicina (Kaunas). 2022;58(6):787. doi:10.3390/medicina58060787.
17. Walkowska J, Zielinska N, Tubbs RS, Podgórski M, Dłubek-Ruxer J, Olewnik Ł. Diagnosis and treatment of acute pancreatitis. Diagnostics (Basel). 2022;12(8):1974. doi:10.3390/diagnostics12081974.
18. Tarar MY, Khalid A, Choo XY, Khurshid S, Tumeh H, Muhammad K. Use of the C-reactive protein (CRP)/albumin ratio as a severity tool in acute pancreatitis: systematic review. Cureus. 2022;14(9):e29243. doi:10.7759/cureus.29243.
19. Xu L, Yu H, Chen L, Xia W, Shi L, Yang Y, Huang Y. The modified computed tomography severity index combined with low skeletal muscle mass can better predict the severity of hypertriglyceridemia-induced pancreatitis. J Hepatobiliary Pancreat Sci. 2022;29(12):1336-1345. doi:10.1002/jhbp.1198.
20. Zhao Y, Xia W, Lu Y, Chen W, Zhao Y, Zhuang Y. Predictive value of the C-reactive protein/albumin ratio in severity and prognosis of acute pancreatitis. Front Surg. 2023;9:1026604. doi:10.3389/fsurg.2022.1026604.
21. Luo X, Wang J, Wu Q, Peng P, Liao G, Liang C, et al. A modified Ranson score to predict disease severity, organ failure, pancreatic necrosis, and pancreatic infection in patients with acute pancreatitis. Front Med (Lausanne). 2023;10:1145471. doi:10.3389/fmed.2023.1145471.
22. Dalal AD, Dalal YD, Rana DA. Modified computed tomography severity index in evaluation of acute pancreatitis and its correlation with clinical outcome: a prospective observational study from a tertiary care teaching hospital, India. Ann Afr Med. 2023;22(3):340-346. doi:10.4103/aam.aam_79_22.
23. Mariadi IK, Somayana G, Shalim CP, Sindhughosa DA, Daniella D, Purwanta MLA. Prognostic value of C-reactive protein-to-albumin ratio in acute pancreatitis: a systematic review and meta-analysis. F1000Res. 2023;12:748.
24. Vahapoğlu A, Çalık M. A comparison of scoring systems and biomarkers to predict the severity of acute pancreatitis in patients referring to the emergency clinic. Medicine (Baltimore). 2024;103(17):e37964. doi:10.1097/MD.0000000000037964.
25. Zhang R, Yin M, Jiang A, Zhang S, Liu L, Xu X. Application value of the automated machine learning model based on modified computed tomography severity index combined with serological indicators in the early prediction of severe acute pancreatitis. J Clin Gastroenterol. 2024;58(7):692-701. doi:10.1097/MCG.0000000000001909.