A comparison of clinical profiles, risk factors and outcomes in normoglycemic, prediabetic, insulin resistant and diabetic patients of acute ischemic stroke.
- Prerna Dogra , Associate Consultant, Department of Neurology, Medanta Hospital.
- Jyoti Bala Sharma , Director and Head, Department of Neurology, Fortis Hospital, Noida.
Article Information:
Abstract:
Background: Aim: To compare the clinical profiles, risk factors, and outcomes among normoglycemic, insulin-resistant, prediabetic, and diabetic patients presenting with acute ischemic stroke. Materials and Methods: This prospective observational study was conducted in the Department of Neurology at Fortis Hospital, Noida, from August 2023 to August 2024. A total of 194 patients with acute ischemic stroke were enrolled and categorized into four groups: normoglycemic (n=47), insulin resistant (n=49), prediabetic (n=47), and diabetic (n=51). Glycaemic status was determined using HbA1c and HOMA-IR criteria. Clinical characteristics, vascular risk factors, stroke subtype, laboratory parameters, and functional outcomes were evaluated. Stroke severity and recovery were assessed using the National Institutes of Health Stroke Scale (NIHSS), Modified Rankin Scale (MRS), and Barthel Index (BI) at admission, discharge, and one-month follow-up. Statistical analysis was performed using SPSS version 26.0, with p<0.05 considered statistically significant. Results: Diabetic and insulin-resistant patients were older and predominantly male. Hypertension, coronary artery disease, obesity, dyslipidemia, and large artery atherosclerosis were more frequent among prediabetic and diabetic patients. Diabetic patients demonstrated the highest NIHSS scores at admission and discharge, longer ICU and hospital stay, poorer functional outcomes, and highest mortality (7.8%). Normoglycemic patients showed the best recovery with lower MRS scores and higher BI scores at discharge and one month. Insulin-resistant patients also exhibited significantly worse neurological and functional outcomes compared to normoglycemic individuals, including higher NIHSS and MRS scores, lower BI scores, and prolonged ICU stay. Diabetic patients had the most adverse lipid profile and highest homocysteine levels. Significant differences were observed primarily between normoglycemic patients and those with insulin resistance, prediabetes, or diabetes. Conclusion: Abnormal glycaemic states, including insulin resistance and prediabetes, are associated with poorer outcomes in acute ischemic stroke. Insulin-resistant patients demonstrated outcomes comparable to diabetic patients, emphasizing the importance of early identification and management of insulin resistance even before the onset of overt diabetes. Comprehensive glycaemic assessment and metabolic risk stratification may help improve stroke prognosis and functional recovery.
Keywords:
Article :
INTRODUCTION:
The global adult diabetes prevalence rate in 1995 was 4.0%. [1] A study from the International Diabetes Federation Diabetes Atlas 9th edition showed that the global burden of diabetes in 2019 was found to be approximately 9.3%, representing 463 million people with diabetes worldwide, and it is predicted that the prevalence will rise to 10.2 % (578 million) and 10.9 % (700 million) in 2030 and 2045, respectively. Half (50.1%) of people do not even know if they are diabetic, which greatly increases the burden of global disease. [2] Out of the 463 million diabetics in the world, South East Asia has approximately 80 million and 70 percent live in developing countries. India is a hotbed for non-communicable diseases and is currently home to 69.2 million diabetics, second only to China. (3,4)
Diabetes is a lifestyle disease with a plethora of debilitating consequences. It not only makes a person question one’s lifestyle but puts additional burden on patients and caregivers for long term management of the disease and its complications. Patients are required to maintain controlled levels of glycosylated hemoglobin (HbA1c). But up to 50 percent fail to do so and land up with multiple complications. (5) One among these many complications is the comorbidity of ischemic stroke.
Steady increase in the incidence of T2DM spurred on by poor eating habits, increasing obesity and sedentary lifestyles have resulted in a steep rise of diabetes-related cardiovascular comorbidities all over the world. This trend is expected to escalate further with the lengthening of life expectancies from advancements in technology, medical science and healthcare resources that resulted in a sharp rise in the proportion of older individuals in the global population with higher burden of diabetes and hypertension. World Health Organization’s recent statistics of 900 million people over 60 years (12% of world population in 2015) may surpass 2 billion by 2050 (22% of global population), with 80% of these individuals in the low- and middle-income countries would catalyse the explosiveness of this alarming situation. Not only is diabetes a significant risk factor for stroke: it is known that one third of the patients with stroke have diabetes, (6) but it also increases the stroke associated morbidity and mortality. Studies have shown increased morbidity and mortality, coupled with lengthy hospitalization, as well as recurrent hospitalisation, and abysmal recuperation outcomes after stroke in patients with coexisting diabetes.(7-11)
Patients with diabetes have nearly 1.5 times increased risk of stroke than their normoglycemic counterparts and approximately 33% of all stroke patients have diabetes. (5) Tanaka et al showed that there was a worse early 30 day prognosis after ischemic stroke in both diabetic and prediabetic patients. (14) Additionally, several studies indicate lengthier duration of hospital stay coupled with higher readmissions along with worse rehab results after stroke in diabetic individuals. It has also been seen that resistant insulin states correlated with worse functional outcome in non-diabetic stroke patients in a few studies. This brings us to the question – even in patients with normal blood sugar levels, whether or not it is beneficial to correct insulin resistance.(15) The objectives of the study are as below:
1. To compare clinical profiles and risk factors in normoglycemic, insulin resistant, prediabetic and diabetic patients
2. To compare outcome of normoglycemic, insulin resistant, prediabetic an diabetic patient of acute ischemic stroke on the basis of outcome measures:
• MRS scoring at discharge and at 1 month of follow up
• Barthel index at discharge and 1 month of follow up
• NIHSS score at admission and at discharge.
MATERIALS AND METHODS:
This prospective observational study was carried out in Department of Neurology at Fortis Hospital, Noida from August 2023 to August 2024. The patients were enrolled in this study after taking free and informed consent. Indoor patients belonging to rural as well as urban areas suffering from acute ischemic stroke were included in the study.
Sample size: The sample size calculation using the following formula:
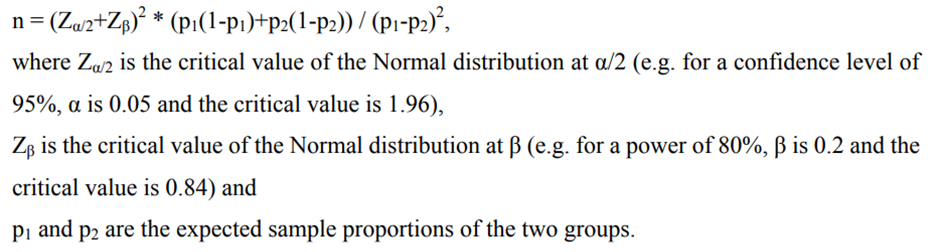
Sample size = 47 per group
The sample size was a minimum of 47 per group (prediabetic/ diabetic/ insulin resistant/ normoglycemic patients).
Inclusion criteria: Patients included in this study were all male/female patients with age >18 years with acute ischemic stroke.
Exclusion criteria
1. Patient or attendant not giving consent for inclusion in the study.
2. Patients with previously diagnosed chronic kidney disease (CKD)
3. Patients with haemorrhagic stroke
4. Patients with previous ischemic stroke
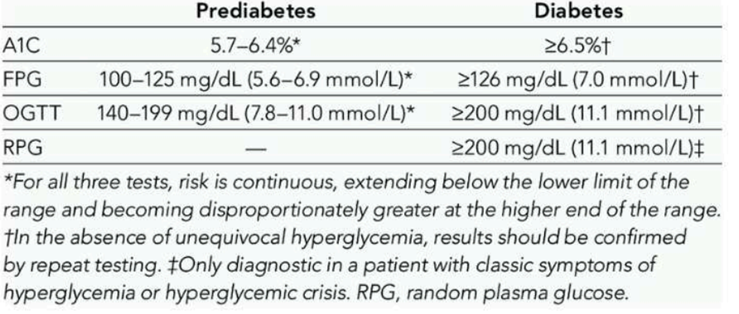
Diagnostic criteria’s for diabetes and prediabetes
Diagnostic criteria for diagnosis of insulin resistance: Homeostatic model assessment (HOMA) is a method for assessing β-cell function and insulin resistance (IR) from insulin or C-peptide concentrations and fasting glucose. Compared with the “gold” standard euglycemic clamp method for quantifying insulin resistance quantification using HOMA-IR is more convenient. It is calculated multiplying fasting plasma insulin (FPI) by fasting plasma glucose (FPG), then dividing by the constant 22.5, i.e. HOMA-IR=(FPI×FPG)/22.5. This method has been applied across all ethnic groups.(20)
Data collection: The data was collected on printed proforma which included various patient variables which may be associated with the prognosis and outcome of patient. In the data collection, we included age, gender, co-morbid conditions, risk factors for stroke, weight, BMI, signs of insulin resistance, Glasgow Coma Scale (GCS) at admission, NIHSS score, data regarding thrombolysis and radiological findings on NCCT Head/MRI and other routine blood investigations. The patient PROFORMA is attached at the end of this document. Data collection also included data regarding course in the hospital which included number of days of ICU stay, number of days of ventilator support, MRS scoring and other functional scoring systems.(20)
Outcome: The outcome of the study was assessed using Modified Rankin Scale (MRS), NIHSS score, BI, duration of ICU stay and duration of hospital stay.
Statistical analysis: The data was entered into Microsoft Excel and analysed using SPSS (Statistical Package for Social Sciences) package 26.0 for relevant statistical comparisons. Descriptive statistics were performed by calculating mean and standard deviation for the Continuous variables. Categorical variables were summarized as frequencies and percentages. Non parametric tests like Mann Whitney test and Kruskal Wallis test were used to check whether the 4 groups are comparable or not in terms of outcome scores. Parametric parameters were evaluated with the t tests. Level of statistical significance was set at p-value less than or equal to 0.05.
RESULTS:
203 patients were diagnosed as acute ischemic stroke within the study period, however 9 patients had to be excluded as they had previous history of cancer or vasculitic syndromes. We included 194 patients of acute ischemic stroke in our study who presented to our center from 2023 August to August 2024. In our study sample of N = 194 patients, 47 (24.22%) were normoglycemic, 49 (25.25%) were insulin resistant with elevated HOMA-IR. 47(24.22%) were prediabetic with elevated HOMA-IR and HbA1c in prediabetic range and 51 (26.28%) were diabetics. The diabetic and insulin-resistant groups had a higher proportion of males and older mean age compared to the normoglycemic and prediabetic groups. Mean BMI and waist–hip ratio progressively increased from normoglycemic to diabetic patients, indicating a greater burden of obesity and central adiposity among patients with abnormal glucose metabolism (table 1).
Table 1: Baseline demographic and anthropometric characteristics of study groups
|
Variable |
Normoglycemic (n=47) |
Insulin Resistant (n=49) |
Prediabetic (n=47) |
Diabetic (n=51) |
|
Mean age (years) |
55.96±18.44 |
61.43±15.52 |
55.70±16.10 |
64.24±13.30 |
|
Male, n (%) |
21 (44.7) |
34 (69.4) |
32 (68.1) |
36 (70.6) |
|
Female, n (%) |
26 (55.3) |
15 (30.6) |
15 (31.9) |
15 (29.4) |
|
Mean BMI (kg/m²) |
23.18 ± 2.12 |
23.62 ± 3.92 |
23.79 ± 2.28 |
24.08 ± 3.32 |
|
Mean waist–hip ratio |
1.12 ± 0.18 |
1.16 ± 0.27 |
1.18 ± 0.21 |
1.23 ± 0.32 |
Hypertension and coronary artery disease were more common in prediabetic and diabetic patients. Large artery atherosclerosis was the predominant stroke subtype in prediabetic and diabetic groups, whereas small vessel occlusion was more frequent in insulin-resistant patients. Diabetic patients had lower thrombolysis rates, longer hospital and ICU stay, and the highest mortality (table 2).
Table 2: Clinical profile, stroke subtype and hospital outcomes
|
Parameter |
Normoglycemic |
Insulin Resistant |
Prediabetic |
Diabetic |
|
Hypertension, n (%) |
14 (29.8) |
16 (32.7) |
22 (46.8) |
27 (52.9) |
|
CAD, n (%) |
3 (6.4) |
5 (10.2) |
6 (12.7) |
8 (15.7) |
|
LAA stroke subtype, n (%) |
19 (40.4) |
19 (38.8) |
24 (51.0) |
26 (50.9) |
|
Small vessel occlusion, n (%) |
12 (25.5) |
23 (46.9) |
16 (34.0) |
18 (35.2) |
|
Thrombolysed patients, n (%) |
28 (59.6) |
22 (44.9) |
27 (57.4) |
20 (39.2) |
|
Mean hospital stay (days) |
8.13 ± 8.10 |
9.98 ± 11.68 |
10.47 ± 14.11 |
12.14 ± 16.54 |
|
Mean ICU stay (days) |
4.83 ± 7.80 |
4.84 ± 3.60 |
5.49 ± 3.01 |
7.37 ± 10.88 |
|
Mortality, n (%) |
1 (2.1) |
2 (4.2) |
2 (4.1) |
4 (7.8) |
Table 3 compares neurological severity using NIHSS scores at admission, 24 hours, and discharge among the study groups. Higher NIHSS scores were observed in insulin-resistant, prediabetic, and diabetic patients compared to normoglycemic patients, suggesting more severe neurological impairment and poorer recovery. Diabetic patients demonstrated the highest admission NIHSS scores and persistently elevated scores during follow-up.
Table 3: Comparison of NIHSS scores according to glycaemic status
|
Group |
NIHSS at Admission |
NIHSS at 24 Hours |
NIHSS at Discharge |
|
Normoglycemic |
6.26 ± 3.29 |
2.06 ± 2.59 |
1.07 ± 2.39 |
|
Insulin Resistant |
6.98 ± 3.19 |
4.53 ± 4.52 |
2.92 ± 3.03 |
|
Prediabetic |
7.32 ± 3.44 |
2.83 ± 2.49 |
2.06 ± 2.48 |
|
Diabetic |
7.45 ± 5.03 |
3.92 ± 3.80 |
2.43 ± 2.71 |
Normoglycemic patients had the best functional recovery with higher BI and lower MRS scores. In contrast, diabetic and insulin-resistant groups showed poorer functional outcomes, reflecting greater disability and dependence during recovery (table 4).
Table 4: Functional outcome measures among study groups
|
Outcome Measure |
Normoglycemic |
Insulin Resistant |
Prediabetic |
Diabetic |
|
Barthel Index at discharge |
62.45 ± 20.84 |
57.04 ± 16.60 |
56.17 ± 18.65 |
54.90 ± 18.99 |
|
Barthel Index at 1 month |
86.09 ± 16.92 |
71.46 ± 20.88 |
79.15 ± 21.95 |
72.61 ± 21.33 |
|
MRS at discharge |
1.45 ± 1.11 |
1.59 ± 1.70 |
2.06 ± 1.38 |
2.06 ± 1.62 |
|
MRS at 1 month |
0.49 ± 1.15 |
1.49 ± 1.30 |
1.04 ± 1.39 |
1.55 ± 1.86 |
Diabetic patients demonstrated the most adverse lipid profile, with higher total cholesterol, LDL, triglycerides, VLDL, and lower HDL levels. Homocysteine levels were also highest among diabetic patients, suggesting increased vascular and atherosclerotic risk in this group (table 5).
Table 5: Lipid profile and homocysteine levels according to glycaemic status
|
Outcome Measure |
Normoglycemic |
Insulin Resistant |
Prediabetic |
Diabetic |
|
Total cholesterol (mg/dL) |
182.76±30.17 |
174.44±46.48 |
187.87±40.25 |
193.80±41.31 |
|
LDL (mg/dL) |
87.34±35.63 |
88.18±43.30 |
96.76±39.48 |
99.22±15.40 |
|
HDL (mg/dL) |
47.66±15.18 |
46.32±14.22 |
49.38±14.04 |
43.22±15.14 |
|
Triglycerides (mg/dL) |
128.59±38.57 |
148.06±61.80 |
160.11±70.66 |
205.35±90.98 |
|
VLDL (mg/dL) |
33.18±12.48 |
30.18±11.08 |
34.43±13.31 |
43.35±14.80 |
|
Homocysteine (µmol/L) |
16.01±11.98 |
14.77±11.42 |
17.31±14.83 |
18.53±14.60 |
Table 6 summarizes statistically significant differences between glycaemic groups using the Mann–Whitney test. Compared to normoglycemic patients, insulin-resistant, prediabetic, and diabetic groups had significantly worse neurological and functional outcomes, including higher NIHSS and MRS scores, lower Barthel Index scores, and longer ICU stay. These findings indicate that altered glycaemic status is associated with poorer stroke prognosis.
Table 6: Significant intergroup comparisons using Mann–Whitney test
|
Comparison |
Significant Findings |
p-value |
|
Normoglycemic vs Insulin Resistant |
Higher NIHSS at 24 h and discharge in IR group |
0.002, 0.001 |
|
|
Lower BI at 1 month in IR group |
0.001 |
|
|
Higher MRS at 1 month in IR group |
0.001 |
|
|
Increased ICU stay in IR group |
0.035 |
|
Normoglycemic vs Prediabetic |
Higher NIHSS at discharge in prediabetics |
0.005 |
|
|
Higher MRS at discharge and 1 month |
0.001, 0.008 |
|
|
Increased ICU stay in prediabetics |
0.001 |
|
Normoglycemic vs Diabetic |
Higher NIHSS at 24 h and discharge in diabetics |
0.017, 0.004 |
|
|
Lower BI at discharge and 1 month in diabetics |
0.037, 0.001 |
|
|
Higher MRS at discharge and 1 month in diabetics |
0.039, 0.001 |
|
|
Increased ICU stay in diabetics |
0.030 |
Stroke severity, disability, ICU stay, and mortality were greatest among diabetic patients, whereas normoglycemic patients showed the best recovery outcomes. Prediabetic and insulin-resistant patients also demonstrated significantly poorer outcomes compared to normoglycemic individuals, emphasizing the clinical importance of early recognition and management of dysglycaemia in acute ischemic stroke patients (table 7).
Table 7: Overall summary of major findings
|
Observation |
Key Finding |
|
Stroke severity |
NIHSS scores were highest among diabetic and insulin-resistant groups |
|
Functional recovery |
Normoglycemic patients had best BI and MRS outcomes |
|
ICU and hospital stay |
Diabetic patients had longest ICU and hospital stay |
|
Mortality |
Highest mortality observed in diabetic group (7.8%) |
|
Stroke subtype |
Large artery atherosclerosis predominated in prediabetic and diabetic groups |
|
Metabolic profile |
Diabetic patients had worst lipid profile and highest homocysteine levels |
|
Statistical significance |
Significant worse outcomes noted mainly in insulin-resistant, prediabetic and diabetic groups compared to normoglycemic patients |
DISCUSSION:
In this study, 63.0% patients were male and rest 37.0% patients were female gender. In our study, mean age was 55.96±18.44 years, 61.43±15.52 years, 55.70±16.1 years and 64.24±13.3 years in normoglycemic, insulin resistant, prediabetic and diabetic group respectively. Similar to our study, Chang Y et al44 reported that the mean age of the patients was 65.3±13.5 years, and 65.2% were male in their study in which they tried to correlate insulin resistance to poor outcomes in stroke patients. Kumar NSS et al45 reported 71.6% were males and 28.4% were females in their study where they attempted to correlate insulin resistance and poor stroke outcomes. Males were outnumbered females with the ratio of 4.8:1. The mean age of the patient was 55.98 years (range 26-85 years). In a previous study Chebrolu P et al46 reported that the median age was 40.6 years (IQR 35.3–45.6), and a majority (52.3%) were female in constrast to our study where a majority of the participants were males.
In our study the mean BMI was 23.185±2.1 Kg/m2, 23.79±2.28 Kg/m2, 23.6±3.9 Kg/m2 and 24.08±3.32 Kg/m2 in the normoglycemic, insulin resistant, prediabetic and diabetic group respectively. BMI values in the Japanese study by Tanaka et al47 were comparable i.e. 24.2±3.3, 24.5±2.4 and 24.2±4.1 in diabetic, prediabetic and normal glucose tolerance group respectively.
In present study hypertension was the main present comorbidity in 29.78% of normoglycemics, 32.65% of insulin resistant, 46.8% of prediabetics and 52.94% of diabetics’ groups. Similar comorbidity data were found in the study from Tanaka et al47. Coronary artery disease (CAD), hypothyroidism, atrial fibrillation and chronic kidney disease was documented higher in prediabetic and diabetic groups. Kumar NSS et al45 reported that the most common risk factor found was hypertension in 60.5% patients, followed by smoking in 46.29% patients and 39.51% patients were alcoholics. Chen R et al48 too reported that the major modifiable risk factors for stroke include hypertension, diabetes, smoking and dyslipidemia.
Among the normoglycemic group, 19 (40.42%) were large artery atherosclerosis (LAA), 12 (25.53%) were small vessel occlusion, 7 (14.89%) were embolic and 8 (17.02%) were of unknown etiology. In the Insulin resistant group 19 (38.78%) were large artery atherosclerosis (LAA), 23 (46.94%) were small vessel occlusion, 2 (4.08%) were embolic and 6 (12.24%) were of unknown etiology. Among the Prediabetic group, 24 (51%) were large artery atherosclerosis (LAA), 16 (34.04%) were small vessel occlusion, 6 (12.77%) were embolic and 1 (2.1 %) were of unknown etiology. Among the diabetic group 26 (50.9 %) were large artery atherosclerosis (LAA), 18 (35.20%) were small vessel occlusion, 2 (3.92%) were embolic and 5 (9.8 %) were of unknown etiology. In the study by Tanaka et al47, within the normoglycemic group 8% patients had atherothrombotic stroke (ATI), 6% had branch atheromatous disease (BAD), 32% had lacunar infarction (LI), 20% had cardioembolic stroke (CE) and 14% had stroke of unknown etiology (UI). In the prediabetic group, 9.6 % were ATI, 15.4% were BAD, 17% were LI, 20% were CE and 28% were UI. In the diabetic group, 21% were ATI, 7% were BAD, 17% were LI, 20% were CE and 25% were UI. There were higher percentage of large artery atherosclerosis in all the groups of study probably due to the known propensity of intracranial atherosclerotic disease (ICAD) in Indian population.49
The diabetic group had the highest LDL levels (99.22±15.4 mg/dL), while the normoglycemic group had the lowest (87.34±35.63 mg/dL). HDL levels were relatively consistent across groups. Triglyceride levels were highest in the diabetic group (205.35±90.98 mg/dL) and lowest in the normoglycemic group (121.043±38.573 mg/dL). VLDL levels were similar across groups (range: 32-34 mg/dL). These findings suggest subtle differences in lipid profiles among individuals with varying glycaemic status, with the prediabetic and diabetic groups exhibiting potentially unfavorable lipid profiles. Kumar NSS et al45 reported that the deranged lipid profiles were observed in most of the patients. 39.5% patients had total cholesterol ≥ 200 mg/dL, 65.4% patients had LDL > 100 mg/dL, and 58.64% patients had triglycerides ≥ 150 mg/dL. Similarly, in the Japanese study by Tanaka et al47, LDL levels were reported to be 124 ± 41.4, 117.5 ± 26.8 and 118.9 ± 31.8 respectively in diabetic, prediabetic and normal glucose tolerance group which were higher than the patients in our study.
NIHSS score 24 hours after onset was found to be comparable between the prediabetic and the normoglycemic group. Whereas NIHSS score at 24 hours was found to be significantly worse in insulin resistant and diabetic groups as compared to their normoglycemic counterparts with a p value of 0.002 and 0.017 respectively. This apparent improved NIHSS score in the prediabetic group is probably owed to the increased rated of thrombolysis in current study where in the prediabetic group 27 patients (57.45 %) were thrombolysed in comparison to the diabetic group where 20 patients (39.22 %) were thrombolysed and the insulin resistant group where 44% patients were thrombolysed. As compared to the normoglycemic group NIHSS score at 24 hours was found to be significantly worse in insulin resistant and diabetic groups as compared to their normoglycemic counterparts indicating a worse NIHSS outcomes for not only overtly diabetic patients but also with insulin resistant patients prior to the onset of frank diabetes. Tanaka et al47 too found similar results – with mean NIHSS at discharge 2.9 ,1.3, 1.2 respectively in diabetic, prediabetic and diabetic groups and found significantly worse outcomes in both prediabetics and diabetic groups as compared to normoglycemic counterparts. Chang et al44 too found similar worsening of outcome parameters with increasing levels of insulin resistance.
At discharge as well, NIHSS was found to be significantly higher in insulin resistant group and diabetic patients when, compared to the normoglycemic group with a p value of 0.001 and, 0.004 respectively. The prediabetic group also had a marginally higher NIHSS than the normoglycemic group with a p value of 0.005 almost approaching significance. Again, this better performance of the prediabetics may be correlated to the high numbers of thrombolysed patients in this group. No statistically significant difference in NIHSS scores was found in the comparison between the IR and diabetic or the IR and prediabetic groups. Kumar NSS et al45 reported that the majority of the patients were with NIHSS score of 9-18 and high serum insulin > 9 μU/mL and high HOMA-IR ≥ 2.5 were strongly associated with high NIHSS score > 18, with corresponding P values of 0.002 and 0.0001, respectively, compared to other traditional risk factors like hypertension and obesity.
Our study noted that at discharge, normoglycemic patients showed the highest functional independence as per Barthel Index on discharge 62.45 (SD = 20.84), followed by insulin resistant patients 57.04 (SD = 16.6) followed by prediabetic group 56.17 (SD = 18.656) and then the diabetics (54.90 (SD = 18.998). Similarly, on evaluating the Barthel index one-month post-discharge, normoglycemic patients demonstrated the greatest functional recovery (86.09 (SD=16.928), while prediabetic patients showed good improvement 79.15(SD=21.952). Insulin resistant and diabetic patients exhibited intermediate functional outcomes at one month 71.46 (SD = 20.884) and 72.61 (SD = 21.33), respectively. These findings suggest that normoglycemic patients tend to have better functional outcomes and recovery compared to those with abnormal glycaemic status. Exception was the prediabetic group which showed better than expected BI at 1 month scores, possibly because of the high thrombolysis rate in these patients.
There was 1(2.1%) death in the normoglycemic group, 2 (4.2%) deaths within the insulin resistant group, 2 (4.08%) deaths within the prediabetic group and 4 (7.8%) deaths in the diabetic group. No statistically significant difference was found due to small sample size in this outcome measure. Similar to our study, Tanaka et al44 found that there were 7.1% deaths in the diabetic group, 0% deaths in the prediabetic and normoglycemic group. they too found this result to be statistically insignificant. The study by Chang et al 44 too did not find any statistically significant difference between their HOMA IR quartiles and risk of early neurological deterioration.
The insulin resistant group in our study showed worse NIHSS scores at 24 hours and at discharge, worse MRS at 1 month scores, worse barthel index at 1 month, longer days of ICU and than the normoglycemic group. All these parameters were found to be statistically significant with a p-value of <0.05. This may be due to the various adverse metabolic effects of insulin resistance on various end organs increasing inflammation and atherogenesis even in the absence of flank hyperglycemic status.
We found similar outcome measures in the insulin resistant, prediabetic and diabetic group with no statistical significant difference between them. Studies have already shown poorer outcomes in prediabetic and diabetic patients with acute ischemic infarcts. However, our group of insulin resistant patients showed a comparable outcome result as compared to our diabetic and prediabetic groups signifying the poor outcomes in IR group. Changes in neuronal synaptic plasticity, muscular insulin resistance and free radical production have been postulated to be the cause of these poor outcomes in IR patients.50 A Chinese study conducted by Ago et al also showed the same – increased HOMA-IR scores were associated with worse neurological outcomes after adjusting for confounding factors such as BMI, obesity or frank diabetes. However, they also found that increased HOMA-IR did not have any association with mortality or recurrence of stroke.51 Another Chinese study by Jing et al followed up 1245 patients and measured their HOMA–IR. They found increased HOMA –IR was associated with stroke recurrence, poor outcome and increased recurrence of stroke. 52
All these results might point us towards the fact that insulin resistance even in the absence of overt prediabetes or diabetes has some biological mechanisms that can influence the causation and outcome of stroke. Studies done by Rundek et al53 and Nakamura et al54 have found an increased incidence of acute ischemic stroke in populations with insulin resistance. The mechanisms of causation still require further elucidations. We, from our study have found poorer outcome measures in insulin resistant, prediabetic and diabetic individuals as compared to normoglycemic individuals which are similar to the results found in studies conducted by Tanaka et al, Chang et al and Kumar et al. 44,45,47
However, we had a limitation that we measured HOMA –IR only once in the course of the admission post stroke episode. This limitation may have caused us to miss the dynamic nature of insulin resistance and how it can change post an event such as stroke. Much research has been done upon this and there is currently strong evidence to prove the bidirectional effect of glucose metabolism disorders and stroke events.
CONCLUSION:
This study investigated the clinical profiles, risk factors, and outcomes of acute ischemic stroke patients with varying glycaemic statuses. The results showed significant differences in clinical profiles and outcomes among normoglycemic, prediabetic, insulin resistant, and diabetic patients. Specifically, insulin-resistant and diabetic patients exhibited worse stroke severity, functional outcomes, longer ICU and hospital stays. The modified Rankin Scale (MRS), Barthel Index, and National Institutes of Health Stroke Scale (NIHSS) scores at discharge and one-month follow-up consistently demonstrated poorer outcomes in patients with abnormal glycaemic status. The insulin resistant group showed a similar outcome profile to that of the diabetic and prediabetic patients with no statistically significant difference between their outcome management. These findings underscore the importance of glycaemic control in stroke management and suggest that timely identification and management of not only diabetes and prediabetes but also insulin resistance may improve stroke outcomes. The study highlights the need for comprehensive stroke care, including glycaemic management, to optimize patient recovery and reduce morbidity and it raises the question – what is the right time to treat insulin resistance?
REFERENCES:
1. King H, Aubert RE, Herman WH. Global burden of diabetes, 1995-2025: Prevalence, numerical estimates, and projections. Diabetes Care. 1998;21:1414–1431.
2. Saeedi P, Petersohn I, Salpea P, Malanda B, Karuranga S, Unwin N, et al. Global and regional diabetes prevalence estimates for 2019 and projections for 2030 and 2045: Results from the International Diabetes Federation Diabetes Atlas, 9(th) edition. Diabetes Res. Clin. Pract. 2019;157:107843.
3. International Diabetes Federation. IDF Diabetes Atlas, 7th ed. Brussels, Belgium: International Diabetes Federation; 2015:12-17.
4. Anjana RM, Pradeepa R, Deepa M, Datta M, Sudha V, Unnikrishnan R, et al. Prevalence of diabetes and prediabetes (impaired fasting glucose and/or impaired glucose tolerance) in urban and rural India: Phase I results of the Indian Council of Medical Research–India Diabetes (ICMRINDIAB) study. Diabetologia. 2011;54(12):3022-7.
5. Dodd AH, Colby MS, Boye KS, Fahlman C, Kim S, Briefel RR. Treatment approach and HbA1c control among US adults with type 2 diabetes: NHANES 1999–2004. Curr Med Res Opinion. 2009;25(7):1605-13.
6. Lau LH, Lew J, Borschmann K, Thijs V, Ekinci EI. Prevalence of diabetes and its effects on stroke outcomes: A meta-analysis and literature review. J Diabetes Investig. 2019 May;10(3):780-792.
7. Eriksson M, Carlberg B, Eliasson M. The disparity in long-term survival after a first stroke in patients with and without diabetes persists: the Northern Sweden MONICA study. Cerebrovasc Dis 2012; 34: 153–160.
8. Lei C, Wu B, Liu M, et al Association between hemoglobin A1C levels and clinical outcome in ischemic stroke patients with or without diabetes. J Clin Neurosci 2015; 22: 498–503.
9. Wu S, Wang C, Jia Q, et al HbA1c is associated with increased all-cause mortality in the first year after acute ischemic stroke. Neurol Res 2014; 36: 444–452.
10. Papazafiropoulou A, Tentolouris N, Bousboulas S, et al In-hospital mortality in a tertiary referral hospital: causes of death and comparison between patients with and without diabetes. Exp Clin Endocrinol Diabetes 2010; 118: 315–319.
11. Li HW, Yang MC, Chung KP. Predictors for readmission of acute ischemic stroke in Taiwan. J Formos Med Assoc 2011; 110: 627–633.
12. Chang Y, Kim CK, Kim MK, Seo WK, Oh K. Insulin resistance is associated with poor functional outcome after acute ischemic stroke in non-diabetic patients. Sci Rep. 2021 Jan 13;11:1229.
13. Kumar NSS, Vanamala N, Vallampalli G, Thatikonda AK, Padal R. Insulin Resistance as an Inflammatory Marker for Ischemic Stroke Severity Among Non-Diabetics: A Prospective Study. J Neurol Res. 2016;6(2-3):46-50.
14. Chebrolu P, Sangle S, Nimkar S, Salvi S, Chavan A, Kulkarni V. Inflammatory profile associated with insulin resistance in non-overweight versus overweight people living with HIV in Pune, Western India. Diabetes Metab Syndr. 2022 Jun 18;16(7):102551.
15. Tanaka R, Ueno Y, Miyamoto N, Yamashiro K, Tanaka Y, Shimura H, Hattori N, and Urabe T: Impact of diabetes and prediabetes on the short-term prognosis in patients with acute ischemic stroke. J Neurol Sci, 2013; 332: 45-50.
16. Chen W, Wang S, Lv W, Pan Y. Causal associations of insulin resistance with coronary artery disease and ischemic stroke: a Mendelian randomization analysis. BMJ Open Diabetes Res Care. (2020) 8:e001217.
17. Khan M, Rasheed A, Hashmi S, Zaidi M, Murtaza M, Akhtar S, et al. Stroke radiology and distinguishing characteristics of intracranial atherosclerotic disease in native South Asian Pakistanis. Int J Stroke. 2013;8(Suppl A100):14–20.
18. Grillo CA. Hippocampal insulin resistance impairs spatial learning and synaptic plasticity. Diabetes 2015;64:3927–3936.
19. Ago T. Insulin resistance and clinical outcomes after acute ischemic stroke. Neurology 2018;90:e1470–e1477.
20. Jing J. Insulin resistance and prognosis of nondiabetic patients with ischemic stroke: The ACROSS-China Study (abnormal glucose regulation in patients with acute stroke across China). Stroke 2017;48:887–893.
21. Rundek T, Gardener H, Xu Q, Goldberg RB, Wright CB, Boden-Albala B, Disla N, et al. Insulin resistance and risk of ischemic stroke among nondiabetic individuals from the northern Manhattan study. Arch Neurol. 2010;67(10):1195-1200.
22. Nakamura K, Sakurai M, Miura K, Morikawa Y, Ishizaki M, Yoshita K, Kido T, et al. Homeostasis model assessment of insulin resistance and the risk of cardiovascular events in middle-aged non-diabetic Japanese men. Diabetologia. 2010;53(9):1894-1902.