Spectrum of Haemoglobinopathies in Paediatric and Preadolescent Age Group (8-12) in Northern Odisha - An institutional Based Pilot Study
- Laxmi Triya , Assistant Professor, Department of Pathology, PRM Medical College and Hospital, Baripada, Odisha, India.
- Pramita Sahu , Associate Professor & Head, Department of Pathology, PRM Medical College and Hospital, Baripada, India.
- Paramita Dey , Assistant Professor, Department of Biochemistry, PRM Medical College and Hospital, Baripada, Odisha, India.
Article Information:
Abstract:
Background: Haemoglobinopathies are one of the major public health problems in the world with an estimated 7% of the world population being carriers of thalassemia and haemoglobinopathies and that 3, 00,000-4, 00,000 babies with severe forms of these diseases are born each year. Sickle cell disease along with beta-thalassaemia’s are the major abnormal haemoglobins in Odisha. Premarital and antenatal screenings are important measures to prevent birth of children with severe haemoglobin disorders. Early diagnosis in the form of parental screening and marriage counselling among couples would lower the risk of offsprings suffering from Beta Thalassemia Major. Detection of asymptomatic carriers by reliable laboratory methods is the cornerstone of prevention of this serious health problem. We wanted to determine the spectrum of haemoglobinopathies in paediatric population diagnosed by High Performance Liquid Chromatography (HPLC) Bio-Rad Variant II. Methods: A Total of 136 blood samples were analysed on the BIORAD variant II HPLC system by b-thal short program. This study was a pilot study/prospective study done in the department of pathology PRM Medical college & hospital, Baripada from 4 May 2024 to 4 May 2025. Results: Sickle cell anaemia homozygous constituted the most prevalent form followed by Beta Thalassemia Trait in this study. Conclusions: Out of 136 cases studied, 30 cases were of haemoglobinopathies (21.8%). out of which 6.6 % were of sickle cell anaemia. Multi-disciplinary approach along with screening, creating public awareness by counselling and mass education can reduce both mortality and morbidity of haemoglobinopathies.
Keywords:
Article :
INTRODUCTION:
Haemoglobin comprises of four globin chains: foetal haemoglobin (Hb F) has two alpha and two gamma chains (α2ϒ2) and adult haemoglobin (HbA) has two alpha and two beta chains. (α2β2). Genes in the α globin and β globin gene clusters (on chromosomes 16 and 11) control globin -chain production.[1]
They fall into two broad groups – structural variants that change the amino acid sequence and produce an unusual haemoglobin, and Thalassemia’s that lower or abolish production of globin chains.[2] The clinical spectrum of these disorders varies from asymptomatic conditions (beta- thalassemia minor) to serious disorders such as thalassemia major that require blood transfusions and extensive medical care.[3]
It has been estimated that approximately 7 % of the world population are carriers of thalassemia and haemoglobinopathies and that 3,00,000-4,00,000 babies with severe form of these diseases are born each year.[4] The prevalence of beta thalassemia trait and sickle cell in various regions of India is around 3%-17% and 1%-44%, respectively, because of consanguity ,caste ,and area endogamy.[3] Every year , around ten thousand children with beta -thalassemia major born in India, which constitutes about 10% of the total global load of beta-thalassemia.[5] The frequency of carriers of haemoglobinopathies varies from 3-17% in different population groups of india.[6]
World Health Organization figures estimate that 5% of the world populations are carriers of a potentially pathological haemoglobin (Hb) gene.[7] Haemoglobinopathies are one of the major public health problems in the state of Odisha, India. They are generally not curable but can be prevented by mass screening, genetic counselling and prenatal diagnosis. Accurate and timely detection of various known and unknown Hb variants can prevent the occurrence of serious Hb disorders such as thalassemia major in the newborns.[3]
The Bio – Rad Variant Haemoglobin Testing system (Bio – Rad Labs, Hercules, CA), is a totally automated CE – HPLC instrument for routine quantification of HbA2, HbF and any other abnormal Hb variant. The Bio Rad variant “Beta Thalassaemia Short” program uses cation exchange HPLC to separate and elucidate the relative percentages of haemoglobin variants in whole blood. We have used HPLC as a routine method for diagnosis of haemoglobinopathies in this centre. We also evaluated if this method has advantages over the conventional techniques.[8]
MATERIALS AND METHODS:
The present study was carried out over a one-year period in the department of pathology PRM medical college hospital. A total of 136 patients of anaemia with suspected haemoglobinopathies were investigated. The age group of patients ranged from 1 month to 12 years. CBC, red blood cell (RBC) indices and peripheral blood examination were done in all cases. Sickling test was performed by using freshly prepared sodium meta-bisulphite solution as reducing agent. CE- HPLC was performed in all cases.
Specimens were drawn into tubes containing dipotassium EDTA. All specimens were assessed by the Bio – Rad Variant HPLC system with the use of the Variant Beta – Thalassaemia Short Program Recorder Pack (Bio – Rad Laboratories, Hercules, CA) as described in the instrument manual for the assay. After collection, the samples were stored at 2-8°C and tested within one week of collection. Each analytical cycle, from sampling to printing of results takes about 6.5 minutes. The instrument calibration was done by loading the method parameter via a read – only memory (ROM) card provided with each set of reagent kit together with a matched set of calibrators and reagents. Care was taken to keep the RT of HbA2 as 3.65 + 0.05 minutes and total area between 10,00,000 – 30,00,000 microvolt seconds.[9] The software delivers a printed report showing the chromatogram, with all the haemoglobin fractions eluted. The integrated peaks are assigned to manufacturer-defined "windows" derived from specific retention time (RT). This RT is the time that elapses from the sample injection to the apex of the elution peak, of normal haemoglobin fraction and common variants.[10] (Table 1)
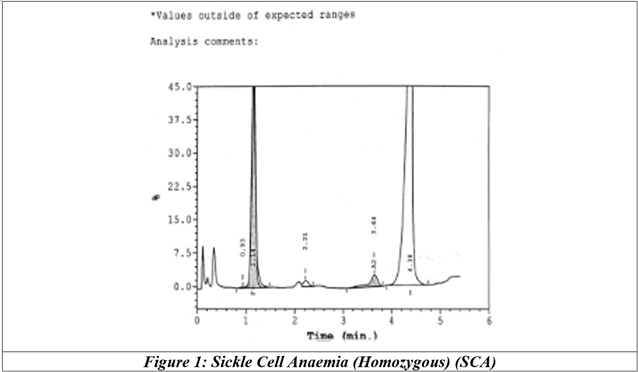
The "windows" are established ranges in which common variants have been observed to elute using the variant beta-thalassemia short program. The printed chromatogram shows all the haemoglobin fractions eluted, the RT, the areas of the peaks, and the values (%) of different haemoglobin components (Figure 1). If a peak elutes at a RT that is not predefined, it is labelled as an unknown. Each analytical cycle, from sampling to printing of results takes about 6.5 min.[10]
Table 1: Manufacture Assigned Windows for Bio-Rad Variant HPLC System
|
Window |
Retention time |
Window (min.) |
Haemoglobins that may overlap |
|
F |
1.10 |
0.98-1.22 |
Okayama |
|
P2 |
0.11 |
1.28-1.50 |
Glycosylated HbA |
|
P3 |
1.70 |
1.50-1.90 |
J-Meerut |
|
A |
2.50 |
1.90-3.10 |
A, Glycosylated, S, New York |
|
A2 |
3.60 |
3.30-3.90 |
E, Lepore, D-Iran |
|
D |
4.10 |
3.90-4.30 |
D-Punjab, G-Philadelphia |
|
S |
4.50 |
4.30-4.70 |
Q-Thailand |
|
C |
5.10 |
4.90-5.30 |
C, Siriraj, Consultant Spring |
RESULTS:
Table 2: Incidence of diseased cases
|
Duration |
Clinically suspected cases |
Haematological proven cases |
Normal |
Diseased (+) |
Percentage |
|
May 3 2024 |
136 |
30 |
106 |
30 |
22% |
A Total of 136 cases were included in the present study. The age group of the patients ranged from 1 month to 12 years among which 106 cases were diseased. Table 2
Out of these, 30 cases displayed abnormal haemoglobin fractions on HPLC constituting of 12 females and 18 males with a Male: Female ratio of 1.5:1. Maximum number of cases were seen in 1-6-year age group followed by age group of 6-12 years. The youngest patient was 15 months old. The pattern of abnormal Hb distribution observed in the present study is depicted in Table 3.
Table 3. Spectrum of haemoglobinopathies
|
Sl. No. |
Abnormal. Hemoglobin Pattern |
Total Diseased Case (Patients) |
Percentage |
|
1 |
Sickle cell anaemia |
09 |
6.6% |
|
2 |
Sickle cell trait |
04 |
2.9% |
|
3 |
Beta thalassemia trait |
08 |
5.8% |
|
4 |
Beta thalassemia major |
02 |
1.4% |
|
5 |
Sickle-beta thalassemia |
07 |
5.1% |
OBSERVATION
In the present study, 09 (6.6%) cases came up with sickle cell anaemia, 04 (2.9%) cases had sickle cell trait, 08 (5.8%) had beta-thalassemia trait, 07 (5.1%) s-b thalassemia and 02 (1.4%) beta thalassaemia major respectively. Remaining 100 (78.2%) cases had a normal HPLC pattern.
In our study, most common abnormal haemoglobin fraction observed was HbS, seen in 20 (14.6%) patients. Sickling test was positive in all of these cases.
Red cell morphology for these cases were mostly normocytic normochromic type. HbF was normal in half of the cases, with 10 (50%) patients having a raised HbF (>5.0%). In sickle cell homozygous (SS) group Hb ranged from 6.68±2.23 g/dL. Most of the patients had either normocytic normochromic or microcytic hypochromic blood picture with anisopoikilocytosis. Cases were showing total leukocyte counts to be raised reason being increased nucleated RBC’S and associated infections.
All patients of compound heterozygous for HbS and β-thalassaemia (Sβ) were anaemic (Hb=7.73±2.63 g/dL). PBS showed moderate to marked anis poikilocytosis. Seven cases with mild- moderate anaemia were diagnosed to have compound heterozygous for HbS and hereditary persistent of foetal haemoglobin (HPFH). Parental study of one case confirmed the diagnosis for s-b thalassemia, while in the other cases parents did not turn around.
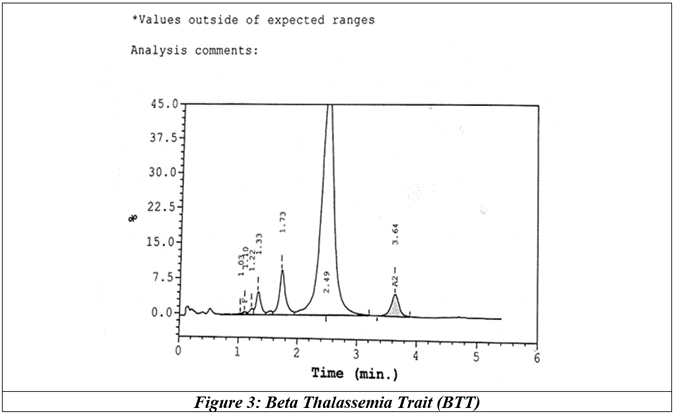
HbA2 levels of 3.6-9% are diagnostic of β-thalassaemia trait (BTT) in an asymptomatic individual with no or mild anaemia. We got this range of increased HbA2 in 08 patients without any other significant abnormality in chromatogram. Most of them had microcytic hypochromic blood picture. Total 08 patients were diagnosed as BTT among which 06 patients had Hb <9 gm%.
Two cases were diagnosed as β-thalassaemia major (BTM). All presented in their 1st year of life with Hb level ≤6.5 g%. PBS showed marked degree of anisopoikilocytosis with raised RDW, hypochromasia, target cells, polychromatic cells and Nucleated RBC’s. HbF levels were found to be significantly high.
HPLC-CHROMATOGRAMS-
|
Peak Name |
Calibrated Area % |
Area % |
Retention Time (min.) |
Peak Area |
|
Unknown |
--- |
0.1 |
0.93 |
865 |
|
F |
23.4 |
--- |
1.14 |
183803 |
|
AO |
--- |
0.9 |
2.21 |
6607 |
|
A2 |
2.7 |
--- |
3.64 |
21496 |
|
S-window |
--- |
72.3 |
4.38 |
555261 |
|
|
|
|
Total Area |
768,031* |
F Concentration – 23.4*%
A2 Concentration – 2.7%
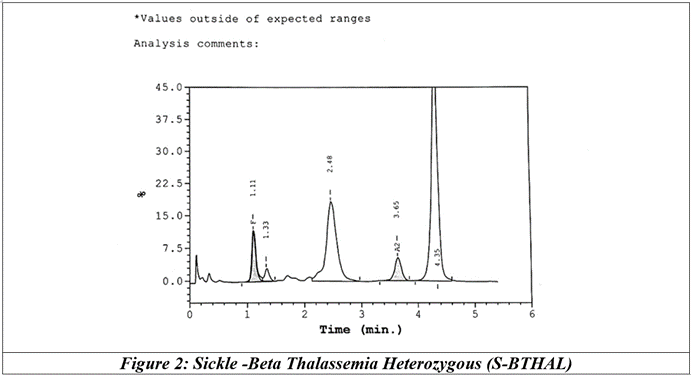
|
Peak Name |
Calibrated Area % |
Area % |
Retention Time (min.) |
Peak Area |
|
F |
7.6% |
--- |
1.11 |
33283 |
|
P2 |
--- |
2.0 |
1.33 |
8810 |
|
AO |
--- |
31.0 |
2.48 |
136869 |
|
A2 |
5.3 |
--- |
3.65 |
25625 |
|
S-window |
--- |
53.7 |
4.35 |
237609 |
|
|
|
|
Total Area |
442,195* |
F Concentration – 7.6*%
A2 Concentration – 5.3%
|
Patient Data |
|
Analysis Data |
|
|
Sample Id: |
Unknown–1-171 |
Analysis performed: |
10/29/2024 15:39:54 |
|
Patient Id: |
BW 53 |
Injection Number: |
171U |
|
Name: |
Shibani |
Run Number: |
11 |
|
Physician: |
|
Rack Id: |
0010 |
|
Sex: |
|
Tube Number: |
2 |
|
DOB: |
|
Report Generated: |
10/29/2024 15:52:10 |
|
Comments: |
|
Operator Id |
|
|
Peak Name |
Calibrated Area % |
Area % |
Retention Time (min.) |
Peak Area |
|
Unknown |
--- |
0.1 |
1.03 |
992 |
|
F |
0.3 |
--- |
1.10 |
2754 |
|
Unknown |
--- |
0.7 |
1.22 |
5475 |
|
P2 |
|
3.1 |
1.33 |
25039 |
|
P3 |
|
7.8 |
1.73 |
63994 |
|
A0 |
--- |
83.1 |
2.49 |
679461 |
|
A2 |
4 |
53.7 |
3.64 |
39996 |
|
|
4.6* |
--- |
Total Area |
817,701* |
F Concentration – 0.3%
A2 Concentration – 4.6*%
DISCUSSIONS:
India is an ethnically diverse country with marked regional variation. This diversity is reflected in the presence of different haemoglobin variants in different ethnic groups. Moreover, due to migration, there is constant mixing of people from different regions. Many of these abnormal variants are of little clinical significance in heterozygous state, but when combined with other variants they may give rise to severe disease, especially the compound heterozygous disorders (HbSD – Punjab, HbSE, HbS - β thalassaemia) or unusual variants (HbQ India, HbD Punjab, HbD Iran), are all clinically significant with varying degrees of severity, making precise identification important.[11,12]
The identification of haemoglobin variants by conventional techniques are often presumptive, based on the electrophoretic mobility of the band, quantification and/or ethnic origin of the parents.
HPLC has the advantage of quantifying abnormal HbF and HbA2 levels along with detecting other variants in a single screening test.
In any given population, it is the children that are most vulnerable as well as most suitable for timely intervention and efficacious treatment. It is also this paediatric age group that genuinely reflects the challenges we are facing as a society from haemoglobinopathies.
In the present study which was a pilot study out of 136 clinically suspected cases, the prevalence of Hb disorders was found to be 21.8 %. This is almost similar to 31 cases out of 105 (29.5%) in the series of cases studied by Mahapatra et al.[13] in Odisha. Previous two institutional based studies from Odisha reported prevalence of 44.2% and 65.7% of Hb disorders.[14,15] Sarojini et al.[16] (KIIMS ODISHA) in their study came up with 37.18% of abnormal haemoglobin fractions which is higher in prevalence as compared with our study.
However, there is a wide range of variation in prevalence of Hb disorders in different parts of India. Madan et al reported a prevalence of 11.43% in a study from West Bengal.[17] Two hospital based studies from Western India got 8.6% and 11.36% of abnormal haemoglobin variants. In the North Indian population, incidence of haemoglobinopathies was found to be 12.5%.[18] Behera S K, Mohanty S R et al (78.5%) noted a highest prevalence in southern region of Odisha[19] and Baruah et al. noted a high prevalence (59.11%) next to it compared to northern Odisha in North-East region.[20]
HbS was detected in 14.6 % patients in our study, which was lower than as reported by Behera S K, Mohanty S R et al (78.5%), Balgir et al. (39.3%)[14] Sarojini et al.[16] (28.17%) and Dash et al. (29.0%)[15] From Odisha.
Most common abnormal Hb pattern detected in our study was sickle cell anaemia (SS) as 6.6 % followed by BTT (5.8%) and SBT (5.1%). The two above said studies from Odisha found SA to be the most common variant followed by SS and BTT.[14,15] However, most of the other studies across the country reported BTT as the most common variant.[17,18,21-25]
As this was a hospital-based PILOT study which depends upon presenting complaints and signs and symptoms, number of children affected with sickle cell disease catastrophe outnumbered other haemoglobin disorders and thalassemia cases in this study. In contrast, population-based studies would show the actual prevalence of various Hb disorders. In spite of these variations, the high incidence of both SS and BTT highlights the need for antenatal screening for prevention of more severe form like BTM, SS and Sβ in offsprings.
The present study also showed a microcytic hypochromic blood picture in SA group, which could be due to associated iron deficiency. High incidence of iron deficiency has been reported in patients with sickle cell disease from India as reported by Balgir RS et al[26] and Sarojini Raman et al.[16]
The finding of a raised HbF in some sickle cell patients was difficult to explain showing increased HbF levels in this region. Many sickle cell homozygous patients had HbF >30%. Agarwal et al. said that in Indian subcontinent HbSS patients has slightly higher HbF level, than the other parts of the world. The reason for this is that the haplotype of HbS gene, which is prevalent in India, is the Saudi Arabia/Indian haplotype, that reduces the clinical severity of the disease.[18,27]
BTT was the 2ND most common abnormal haemoglobin variant we got which was in concordance with the study conducted by Sarojini et al[16] 2017.Most of the cases had characteristic microcytic hypochromic red cells with normal or slightly reduced Hb and raised RBC count. Raised HbA2 level is the most important abnormal chromatogram finding helpful for its diagnosis.
However, conditions with borderline HbA2 need careful interpretation. Nutritional anaemia must always be taken into account. A low level of HbA2 may be induced by iron deficiency. Similarly, cobalamin or folate deficiency may raise HbA2 level. However, Rao s et al. study shows no significant difference in HbA2 level in patients of BTT with or without concomitant iron deficiency. Thus, elevation in HbA2 level can be used with reliability for diagnosis of BTT even in the presence of iron deficiency.[28,29]
In the present study, the peripheral red cell morphology was of help in cases of borderline elevation of HbA2. In cases of cobalamin and folate deficiency repeat HPLC were advised after nutritional supplement whenever feasible. Cases with normal Hb A2 level on repeat HPLC were taken as normal and cases still having raised HbA2 after correction of iron deficiency anaemia were diagnosed as BTT. Similarly, milder forms of thalassemia or a co-inheritance of delta thalassaemia may also lead to borderline A2 levels. Genetic studies should be hence advised in cases of dilemma for a conclusive opinion.[18]
BTM was seen in 02 (1.4 %) patients. This was lower in prevalence in ours to that of the studies conducted by J Singh et al. 2016 (4%), Rao s et al. (2.9%).[28]
In 2008 Patel j et al. stated Thalassaemia intermedia is suspected when a patient presents after 3 years of age or needs fewer blood transfusion.[30]
In our study, the prevalence of HbE gene was 0% (nil case of E-B thalassemia) which is totally absent as compared to the finding observed by Sarojini et al. 2017 (1.63%) and Balgir et al. (1.90%) in the other regions of Odisha.[14,16]
HbE is the most frequent variant Hb in Asia, with a significant prevalence in North-East India and Bangladesh. It is a β-chain variant that tends to elute in A2 window on HPLC. HbE homozygous usually presents with HbE values >70-75% and heterozygous with HbE values <40%.[18] Biswas Ak et al.[21] said Clinical effects are more severe when HbE is coinherited with β-thalassaemia (Eβ).[18,21]
In our study 04 cases of sickle cell disorder and thalassemia patients presented with organomegaly and one case of BTM with typical haemolytic facies.
In the present study, history of consanguineous marriage found in 05 cases was the predominant cause for the occurrence of double heterozygous cases. 19 cases of double heterozygous was reported by Patel D.K et al[31] and 24 by Tariq H.A et al.[32] stating that the main reason for increased incidence of double heterozygous cases in particular communities like Scheduled caste and Muslims is consanguinity.
Colah R et al. stated that thalassaemic individuals have a reduced MCV, and other studies have suggested that an MCV of <72 is maximally sensitive and specific for the presumptive diagnosis of thalassemia.[33,34] As per the study by Chopra b s Nair et al. low MCH and MCV are the clues for the diagnosis of thalassemia.[35]
In the present study three patients, who were suspected to have associated IDA and borderline HbA2 levels with HbA2 values >3.9%, were advised for re-evaluation on HPLC after iron therapy. 3 of them showed normal A2 values and were included in normal group. 8 cases with persistent raised HbA2 (>4%) were diagnosed as BTT. In a study by Madan et al. a significant decrease in HbA2 levels in thalassemia trait patients are associated with IDA.[29]
Analysis of geographical distribution shows that maximum incidence of haemoglobinopathies were noted in the district of Ganjam (39.6%), which can be explained by this hospital being located in the centre of the district and catering to the whole of Ganjam district.[36] Next districts were Gajapati (31.5%), Mayurbhanj (21.8%) and Kandhamal (18.5%), followed by Phulbani (5.85%) and Rayagda (5.05%) showing least incidences.
The incidence of sickle cell haemoglobinopathies in India ranges from 1-44%.3 The highest frequency of sickle cell gene in India is reported in Orissa (9%), followed by Assam (8.3%), Madhya Pradesh (7.4%), Uttar Pradesh (7.1%), Tamil Nadu (7.1%) and Gujarat (6.4%).11 But in light of population migration it is becoming a worldwide phenomenon.[37]
Tambse et al showed 70.36% cases having sickle cell haemoglobinopathies in their study in northern Maharashtra, another high prevalence zone.[38]
Although Hb electrophoretic technique has several advantages like its being very cost effective, HPLC techniques score over electrophoresis in many aspects.[39] It is a rapid method for quantitative haemoglobin analysis. This technique is uncomplicated and helpful in identifying haemoglobins which have the same mobility on electrophoresis and can run multiple batches of sample in a small span of time.
CONCLUSIONS:
Haemoglobinopathies form a significant proportion of hereditary disorders in paediatric population leading to a range of myriad complication, leading to mortality in large number of afflicted patients.
Sickle cell homozygous cases (39.3%) were more frequently encountered compared to Sickle cell heterozygous (30.3%). This could have been because this study was a hospital-based study in a low economic area where people visit a hospital only when they have severe symptoms. We believe that if population-based studies is carried out it might have showed other haemoglobin disorders outnumbering the sickle cell disorders in particular.
In India, where β-thalassaemia trait is so rampant, premarital and antenatal screening should be mandatory to prevent birth of children with β-thalassaemia major. The simplicity and rapidity of sample preparation, accurate quantification of Hb concentration combined with complete automation, makes HPLC an ideal methodology for the routine diagnosis of Hb disorders.
REFERENCES:
1. Livingstone FB. Frequencies of haemoglobin variants. New York: Oxford University Press 1985.
2. Huisman THJ, Carver MFH, Baysal E. A syllabus of thalassemia mutations. Augusta, GA: The Sickle Cell Anemia Foundation 1997.
3. Mondal SK, Mandal S. Prevalence of thalassemia and haemoglobinopathy in eastern India: a 10‑year high performance liquid chromatography study of 119,336 cases. Asian J Transfus Sci 2016;10(1):105‑110.
4. Guidelines for the control of haemoglobin disorders. In Report of the VIth Annual Meeting of the WHO Working Group on Haemoglobinopathies, Cagliari, Sardinia, Geneva: World Health Organization 1989.
5. Patel AP, Naik MR, Shah NM, et al. Prevalence of common haemoglobinopathies in Gujarat: an analysis of a large population screening programme. Natl J Community Med 2012;3(1):112‑6.
6. Balgir RS. Control and prevention of the genetic load of haemoglobinopathies in India. Natl Med J India 1999;12(5):234-8.
7. WHO-Executive Board EB118/5, 118th Session Report by the Secretariat on thalassemia and other hemoglobinopathies: Prevalence of hemoglobinopathies. 11 May 2006:1-8.
8. Gupta PK, Kumar H, Kumar S, et al. Cation Exchange High Performance Liquid Chromatography for Diagnosis of Haemoglobinopathies. Med J Armed Forces India 2009;65(1):33-7.
9. Mohanty D, Colah RB, Gorakshakar AC, et al. Prevalence of ß-thalassemia and other haemoglobinopathies in six cities in India: a multicentre study. J Community Genet 2013;4(1):33-42.
10. Balgir RS, Dash BP, Murmu B. Blood groups, haemoglobinopathy and G-6-PD deficiency investigations among fifteen major scheduled tribes of Orissa, India. Anthropologist 2004;6(1):69-75.
11. Steinberg MH. Compound heterozygous and other sickle hemoglobinopathies. Disorders of hemoglobin: genetics, pathophysiology, and clinical management 2001:786-810.
12. Dash S. HbA2 in subjects with HbD. Clin Chem 1998;44;2381-2.
13. Suratkar V, Mahapatra S. Solubilization site of organic perfume molecules in sodium dodecyl sulfate micelles: new insights from proton NMR studies. Journal of Colloid and Interface Science 2000;225(1):32-8.
14. Balgir RS. Spectrum of hemoglobinopathies in the state of Orissa, India: a ten years cohort study. JAPI 2005;53:1021-6.
15. Dash NR, Mohanty B. Spectrum of haemoglobinopathies at a tertiary care hospital in Bhubaneswar, Orissa, India. J of Evidence Based Med & Hlthcare 2015;2(34):5101-6.
16. Raman S, Sahu N, Senapati U. A study of haemoglobinopathies and haemoglobin variants using high performance liquid chromatography (HPLC) in a teaching hospital of Odisha. J Evolution Med Dent Sci 2017;6(11):842-9.
17. Mondal SK, Dasgupta S, Mondal S, et al. Spectrum of thalassemias and hemoglobinopathies in West Bengal: A study of 90,210 cases by cation exchange high-performance liquid chromatography method over a period of 8 years. Journal of applied Hematology 2014;5(3):91.
18. Sachdev R, Dam AR, Tyagi G. Detection of Hb variants and haemoglobinopathies in Indian population using HPLC: report of 2600 cases. Indian J Pathol Microbiol 2010;53(1):57-62.
19. Behera SK, Mohanty SR, Nayak J, et al. Spectrum of haemoglobinopathies in paediatric population in southern Odisha. J Evid Based Med Healthc 2019;6(38):2543-6.
20. Baruah MK, Saikia M, Baruah A. Pattern of haemoglobinopathies and thalassaemias in upper Assam of north eastern India: high performance liquid chromatography studies in 9000 patients. Indian J Pathol Microbiol 2014;57(2):236-43.
21. Biswas AK, Philip J. Incidence of hemoglobinopathies and hemoglobin variants using HPLC as a diagnostic tool in 6500 anemic patients in a tertiary care center in Western India. Indian J Appl Res 2016;6:214-8.
22. Banerjee S, Singh RK, Shrivastava RK, et al. Study of haemoglobinopathies in patients of anaemia using High Performance Liquid Chromatography (HPLC) in rims (a premier institute of Jharkhand). J Evolution Med Dent Sci 2016;5(46):3029-33.
23. Gupta PK, Kumar H, Kumar S, et al. Cation exchange high performance liquid chromatography for diagnosis of haemoglobinopathies. Medical Journal Armed Forces India 2009;65(1):33-7.
24. Chaudhury SR, Roy H, Bhattacharyya NK, et al. Spectrum of hemoglobin variants in Eastern Indian population; a study of 14,145 cases. Al Ameen J Med Sci 2013;6(3):243-8.
25. Mondal SK, Mandal S. Prevalence of thalassemia and hemoglobinopathy in eastern India: a 10-year high-performance liquid chromatography study of 119,336 cases. Asian Journal of Transfusion Science 2016;10(1):105.
26. Balgir RS. The burden of haemoglobinopathies in India and the challenges ahead. Curr Sci 2000;79(11):153647.
27. Agarwal MB. The burden of haemoglobinopathies in India-Time to wake up? Journal Association of Physicians of India 2005;53(C):1017.
28. Rao S, Kar R, Gupta SK, et al. Spectrum of haemoglobinopathies diagnosed by cation exchange-HPLC & modulating effects of nutritional deficiency anaemias from north India. The Indian Journal of Medical Research 2010;132(5):513.
29. Madan N, Sikka M, Sharma S, et al. Haematological parameters and HbA2 levels in beta-thalassaemia trait with coincident iron deficiency. Indian Journal of Pathology & Microbiology 1998;41(3):309-13.
30. Patel J, Patel A, Patel J, et al. Prevalence of haemoglobinopathies in Gujarat, India: A cross-sectional study. Int J Hematol 2009;5(1):91-7.
31. Patel DK. Epidemiology & clinical aspects of sickle cell disease in India (online) Available from URL: http://www.cehmob.org.br/simposio/imagens/download/palestras/PATEL D Kumar.pdf
32. Tariq HA Sickle cell trait; prevalence among primary school children in makkah city. The Professional 2004;11:197-202.
33. Colah R, Surve R, Wadia M, et al. Carrier screening for β-thalassemia during pregnancy in India: a 7-year evaluation. Genetic Testing 2008;12(2):181-5.
34. Tyagi S, Dass J, Sharma M. Diagnosis of thalassemia and hemoglobinopathies. In: Agarwal MB, ed. Hematology Today. Mumbai: Agarwal Publisher 2010:91-101.
35. Chopra BS, Nair V, Gupta PK, et al. Spectrum of hemoglobinopathies in a tertiary care hospital of Armed Forces. Med J Armed Forces India 2008;64(4):311-4.
36. Mishra DP, Triya L, Silal S. HPLC: An Ideal Methodology and Screening Tool for Diagnosis of Haemoglobinopathies in Paediatric Age Group in Southern Odisha. Sch J App Med Sci 2018;6(6):2316-32.
37. Verma IC, Choudhry VP, Jain PK. Prevention of thalassemia: a necessity in India. Indian J Pediatr 1992;59(6):649-54.
38. Tambse MP, Vasaikar MS, Chavan SC. Haemoglobin patterns in sickle cell haemoglobinopathies-a large prospective study in north Maharashtra. MVP Journal of Medical Sciences 2017;4(1):84-8.
39. De’Gruchy’s clinical haematology in medical practice.