Evaluation and Comparison of Platelet Indices in Diabetic and Non-Diabetic Individuals: A Comparative Cross-Sectional Study
- Rarima Purushothaman , Third Year Postgraduate, Department of Pathology, Srinivas Institute of Medical Sciences and Research Centre, Mangaluru, Karnataka, India.
- Madhukara Devadiga , Assistant Professor, Department of Pathology, Srinivas Institute of Medical Sciences and Research Centre, Mangaluru, Karnataka, India.
- Sukesh , Professor & HOD, Department of Pathology, Srinivas Institute of Medical Sciences and Research Centre, Mangaluru, Karnataka, India.
- Kuladeepa Ananda Vaidya , Professor, Department of Pathology, Srinivas Institute of Medical Sciences and Research Centre, Mangaluru, Karnataka, India.
- Vibha Aithal A , Assistant Professor, Department of Pathology, Srinivas Institute of Medical Sciences and Research Centre, Mangaluru, Karnataka, India..
Article Information:
Abstract:
Background: Diabetes mellitus is a chronic metabolic disorder associated with both microvascular and macrovascular complications. Platelet dysfunction is increasingly recognized as a contributor to vascular complications seen in diabetic patients. Platelet indices such as mean platelet volume (MPV), platelet distribution width (PDW) and plateletcrit (PCT) serve as readily available surrogate markers for platelet activity and thrombotic risk. Objective: To measure and compare platelet indices (Mean platelet volume, Platelet distribution width, Plateletcrit and Platelet count, Platelet Large Cell Count(P-LCC), Platelet Large Cell Ratio(P-LCR) in diabetic and non- diabetic individuals. Methods: A comparative cross-sectional study was conducted including 160 participants (80 diagnosed cases of diabetes and 80 non- diabetic controls) from January 2026 to March 2026. Venous blood samples were analyzed using an automated hematology analyzer to assess platelet indices. Results: Diabetic patients demonstrated significantly higher MPV and PDW values compared to non-diabetic controls, indicating increased platelet activation. Elevated platelet indices correlated with poor glycemic status suggesting enhanced thrombotic tendency in diabetic individuals. Conclusion: Diabetic mellitus is associated with significant alterations in platelet indices, particularly elevated platelet count and reduced PDW, suggesting increased platelet production and activity that contributes to thrombotic risk and vascular complications in diabetic individuals.
Keywords:
Article :
INTRODUCTON:
Diabetes mellitus (DM) is a chronic metabolic disorder associated with both microvascular and macrovascular complications that significantly contribute to morbidity and mortality worldwide.[1] Among the many pathophysiological mechanism implicated in the development of vascular complications, platelet dysfunction occupies a central role. Activated and morphological altered platelets contribute to a prothrombotic state that underlies the cardiovascular and cerebrovascular events frequently observed in diabetic patients.[2] Type 1 diabetes often starts during childhood or the teen years, while type 2 develop at any age.
Platelet indices including mean platelet volume (MPV), platelet distribution width (PDW) and Plateletcrit (PCT) are routinely generated by automated hematology analyzers as a part of a complete blood count. These indices serve as a reliable indicator of platelet size and activity. MPV reflects platelet size and reactivity and has been consistently reported to be elevated in diabetes mellitus making it a significant cardiovascular risk factor.[3] PDW reflects heterogeneity in platelet size, indicative of active platelet production and release whereas the platelet large cell ratio (P-LCR) shows a strong correlation with both MPV and PDW. In contrast, MPV, PDW and P-LCR can be obtained through routine automated hemograms at minimal cost enabling easy identification of patients and facilitating timely interventions.[4]
Fasting blood sugar level of 126mg/dl or higher on two separate tests indicate diabetes. Unlike fasting blood sugar test, RBS can be measured at any time of the day, making it a practical tool for assessing blood glucose.[5]
Multiple studies have demonstrated that diabetic patients have significantly elevated MPV levels relative to non- diabetic individuals. Recent investigations suggest these indices as surrogate marker for endothelial dysfunction and systemic inflammation. Increased value of MPV and PDW may indicate greater thrombotic risk and their monitoring may facilitate identification of patients at increased risk of vascular events.[5]
Chronically elevated level of circulating free fatty acids and glucose contribute to both insulin resistance and β-cell dysfunction. Chronic hyperglycemia leads to microvascular and macrovascular complication due to advanced glycation end products, oxidative stress and endothelial dysfunction.[5,6]
OBJECTIVES
• To measure platelet indices (MPV, PDW, PCT, Platelet count, P-LCC, P-LCR) in diabetic patients.
• To compare the platelet indices in diabetic and non-diabetic groups.
• To evaluate the clinical utility of platelet indices as a marker of platelet dysfunction in diabetic mellitus.
MATERIALS AND METHODS:
A comparative cross- sectional study was conducted at Srinivas Institute of Medical Science and Research Centre, Mukka, Mangalore over a period of three months from January 2026 to March 2026. The study comprised a total of 160 participants, consisting of 80 diagnosed cases of diabetes mellitus(cases) and 80 non- diabetic individuals with normal blood glucose parameters (controls).
Venous blood samples were collected from all participants under aseptic precautions into EDTA – containing vacutainers. Samples were processed within two hours of collection using an automated hematology analyzer. Parameters included are platelet count, MPV, PDW, PCT, P-LCC and P-LCR. Data were entered and analyzed using SPSS software. Continuous variables were expressed as mean + standard deviation. The independent samples t-test and Mann-Whitney U test (Z statistic) were used to compare parameters between the two groups as appropriate. Chi- square test was used for categorical variables. A p-value of less than 0.05 was considered statistically significant..
RESULTS:
A total of 160 participants were enrolled in the present study, comprising 80 diabetic cases and 80 non- diabetic controls. MPV, PDW, P-LCC, P-LCR and platelet count were evaluated and compared between the two groups.
Table 1: Comparison of gender distribution among diabetic and non- diabetic cases
|
Gender |
Diabetic (n=80) |
Non-diabetic (n=80) |
Total |
|
Male |
60(75.0%) |
61(76.3%) |
121(75.6%) |
|
Female |
20(25.0%) |
19(23.8%) |
39(24.4%) |
|
Total |
80(100%) |
80(100%) |
160(100%) |
|
p=0.818 (not significant) |
|||
The total number of males including both cases and control was 121 (75.6%) and females were 39(24.4%). In the diabetic group, males constituted 60 (75%) compared to 61 (76.3%) in the non-diabetic group. Females accounted for 20(25%) in the diabetic group compared to 19(23.8%) in the non- diabetic group. Gender distribution was comparable between the two groups with no statistically significant difference (p=0.818).
Table 2: Comparison of mean and standard deviation of age distribution among diabetic and non- diabetic cases
|
Group |
N (Number) |
Mean Age (years) |
Standard Deviation (SD) |
|
Diabetic |
80 |
51.595 |
15.557 |
|
Non- diabetic |
80 |
30.550 |
12.156 |
A total of 80 diabetic cases and 80 non- diabetic controls with normal blood glucose parameters were included in the present study. The age of participants ranged from 18 to 60 years. The means age of diabetic patients was significantly higher (51.6 + 15.6 years) compared to non- diabetic controls (30.6 + 12.2 years), with a statistically significant difference (t =9.5, p <0.001).
Table 3: Comparison of mean and standard deviation of platelet count among diabetic and non- diabetic cases
|
Group |
N (Number) |
Mean platelet count |
Standard Deviation (SD) |
|
Diabetic |
79 |
255712.658 |
96796.718 |
|
Non-diabetic |
80 |
229103.750 |
71968.209 |
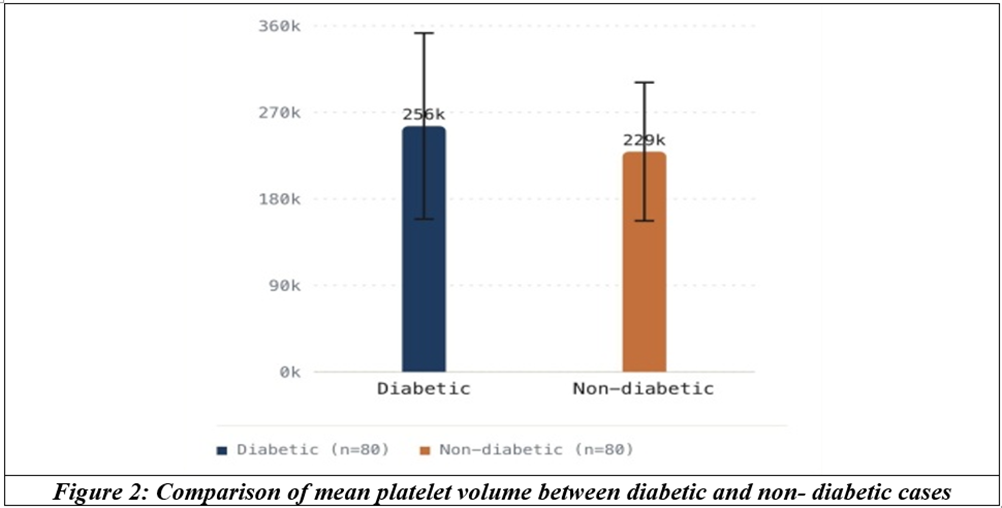
The mean platelet count in diabetic cases was 255712.66 compared to 229103.75 in non- diabetic controls. This difference was statistically significant (t=1.97, p=0.05), suggesting higher platelet production in diabetic patients.
Table 4: Comparison of mean and standard deviation of PDW among diabetic and non-diabetic cases
|
Parameter |
Group |
N (Number) |
Mean (fl) |
Standard Deviation (SD) |
|
PDW |
Diabetic |
80 |
14.424 |
3.622 |
|
|
Non-diabetic |
80 |
16.018 |
5.237 |
The mean PDW in diabetic cases was 14.42+ 3.6 fl compared to 16.0+ 5 fl in non-diabetic controls. This difference was statistically significant (z=2.05, p=0.041), with diabetic patients demonstrating lower PDW values, suggesting more uniform platelet size distribution.
Table 5: Comparison of mean and standard deviation of MPV among diabetic and non- diabetic cases
|
Parameter |
Group |
N (Number) |
Mean (fl) |
Standard Deviation (SD) |
|
MPV |
Diabetic |
80 |
8.816 |
1.117 |
|
|
Non-diabetic |
80 |
9.405 |
1.591 |
The mean MPV in diabetic cases was 8.816+ 1.1 fl compared to 9.045 + 1.6 fl in non- diabetic patients. Although diabetic patients showed lower MPV values, the difference was not statistically significant (z=1.89, p=0.06).
Table 6: Comparison of mean and standard deviation of PCT among diabetic and non-diabetic cases
|
Parameter |
Group |
N (Number) |
Mean (ng/ml) |
Standard Deviation (SD) |
|
PCT |
Diabetic |
80 |
0.229 |
0.089 |
|
|
Non-diabetic |
80 |
0.203 |
0.048 |
Mean PCT in diabetic cases was 0.229 + 0.08 ng/ml compared to 0.203 + 0.048 ng/ml in non-diabetic controls. The difference showed a borderline trend (z= 1.89, p=0.06).
Table 7: Comparison of mean and standard deviation of P-LCC among diabetic and non-diabetic cases
|
Parameter |
Group |
N (Number) |
Mean (%) |
Standard Deviation (SD) |
|
P-LCC |
Diabetic |
80 |
62.633 |
24.117 |
|
|
Non-diabetic |
80 |
61.666 |
20.725 |
Mean P-LCC in diabetic cases was 62.6+ 24% compared to 61.67 + 20% in non- diabetic controls, with no statistically significant difference (z= 0.067, p= 0.946).
Table 8: Comparison of mean and standard deviation of P-LCR among diabetic and non-diabetic cases
|
Parameter |
Group |
N (Number) |
Mean (%) |
Standard Deviation (SD) |
|
P-LCR |
Diabetic |
80 |
25.443 |
9.549 |
|
|
Non-diabetic |
80 |
28.980 |
12.765 |
Mean P-LCR in diabetic cases was 25.4 + 9.6% compared to 28.9+ 12.8 % in non- diabetic controls. The difference was not statistically significant (z= 1.652, p=0.099).
DISCUSSIONS:
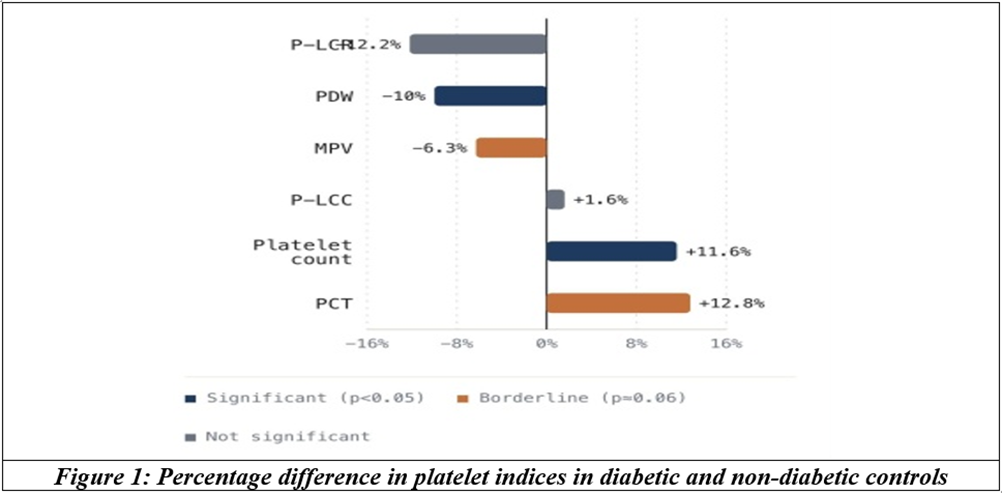
The present study evaluated key platelet indices in diabetic and non-diabetic individuals to identify hematological markers associated with the prothrombotic state in diabetes mellitus. The findings revealed statistically significant differences in platelet count and PDW between the two groups, with borderline difference observes in MPV and PCT.[7]
The significantly elevated platelet count observed on diabetic patients on the present study is consistent suggesting enhanced megakaryopoiesis and platelet turnover in DM. Chronic hyperglycaemia is known to stimulate thrombopoietin production and promote platelet production resulting in highest circulating platelet numbers that contribute to the thrombotic milieu of diabetes.[8]
PDW was significantly lower in diabetic patients compared to non-diabetic controls (14.42 and 16.0 fl respectively, p=0.041). Lower PDW values may reflect a more uniform platelet size distribution, possibly indicative of a population of uniformly activated larger platelets rather than heterogeneous platelet production.[9]
MPV showed a borderline lower value in diabetic patients compared to controls (8.816 and 9.405 fl respectively, p =0.06). However, it is important to note that MPV values can vary with glycemic controls, duration of diabetes, and comorbidities. The borderline p-value suggests a trend that may reach significance in larger study populations. This suggests that MPV serve as a simple and cost effective marker to assess thrombotic risk in diabetic patients during routine hematological assessment.[9,10] This finding is consistent with Lippi et al[10] who reported significantly lower MPV alongside higher platelet count. In type 1 and type 2 diabetes compared to controls. In their cohort study of 691 type 1 diabetes and 459 type 2 diabetes with 943 controls, MPV was consistently reduced in diabetes regardless of glycemic control status.
PCT was also borderline higher in diabetic patients (p.229 and 0.203 ng/ml respectively, p =0.06), consistent with the elevated platelet count observed. PCT reflects the overall platelet mass and is considered an indicator of total platelet activity.[11] No significant differences were observed in P-LCC and P-LCR, suggesting that while platelet numbers and size distribution are altered, the proportion of large cell count may not differ significantly between groups.[12] This finding is consistent with Buch et al[13] which was a case control study of 300 type 2 diabetes versus 200 non-diabetes that found no statistically significant difference in P-LCR between diabetic and non-diabetic groups.
The mean platelet count in diabetic cases was 255712.6 compared to 229103.6 in non- diabetic controls. This finding is consistent with akinsegun et al[14] who reported a significant higher mean platelet volume in diabetic patients compared to non-diabetic patients. In this platelet count in diabetes was 235.29± 76.81×10⁹/L versus control was 211.32±66.44×10⁹/L.
The findings of the present study suggest the concept that diabetes is associated with altered platelet indices, contributing to enhanced thrombotic potentials. The evaluation of simple, readily available platelet indices from routine complete blood counts may provide a cost- effective screening tool for identifying diabetic patients at higher vascular risk.
CONCLUSIONS:
The present study evaluated key platelet indices in diabetic and non-diabetic populations with 80 participants in each group. Diabetes mellitus was associated with statistically significant alterations in two parameters namely elevated platelet count and reduced PDW. Borderline differences were observed in MPV and PCT, while no significant difference was seen in P-LCC or P-LCR. These changes collectively indicate that diabetes linked with increased platelet production contributing to the thrombotic risk and vascular complications characteristic of DM. Platelet indices derived from routine automated hemograms represent inexpensive and practical tools for early identification of increased thrombotic risk in diabetic patients.
REFERENCES:
1. DeFronzo RA, Ferrannini E, Groop L. Type 2 diabetes mellitus. Nature reviews Disease Primers 2015;1(1):1-22.
2. Spandana T, Yerragolla S, Swaroopa MJ, et al. Role of platelet indices in type 2 diabetes mellitus patients in a tertiary care hospital. JCDR 2022;13(4).
3. Magliano DJ, Boyko EJ. What is diabetes. In IDF Diabetes ATLAS: 10th edn. International Diabetes Federation 2021.
4. Chatterjee S, Khunthi K, Davies MJ. Type 2 diabetes. The Lancet 2017;389:2239-51.
5. Bastaki S. Diabetes mellitus and its treatment. International Journal of Diabetes and Metabolism 2005;13(3):111-34.
6. Jindal S, Gupta S, Kakkar A. Platelet indices in diabetic mellitus: indicator of diabetic microvascular complications. Hematology 2011;16(2):86-9.
7. Chen X, Fang L, Lin H, et al. The Relationship between Type 2 Diabetes and Platelet Indicators. Iran J Public Health 2017;46(9):1211-6.
8. Kraakman MJ, Lee MK, Al-Sharea A, et al. Neutrophil derived S100 calcium binding proteins A8/A9 promote thrombocytosis and atherogenesis in diabetes. J Clin Invest 2017;127(6):2133-47.
9. Kshirsagar RM, Deoke S, Akhtar S. Platelet indices in type 2 diabetes mellitus and their association with microvascular complications. Pak J Med Sci 2019;9(1):23-8.
10. Verdoia M, Schaffer A, Barbieri L, et al. Diabetes, glucose control and mean platelet volume: a single-centre cohort study. Diabetes Res Clin Pract 2014;104(2):288-94.
11. Chandrashekar V. Plateletcrit as a screening tool for detection of platelet quantitative disorder. J Hematol 2013;2(1): 22-6.
12. Bhavana V. Platelet volume indices as predictive biomarker for diabetic complication in Type 2 diabetic patients.2017;9(1):22-6.
13. Buch A, Kaur S, Nair R, et al. Platelet volume indices as a predictive biomarker for diabetic complications in type 2 diabetic patients. J Lab Physicians 2017;9(2):84-8.
14. Akinsegun A, Akinola D, Sarah JO, et al. Mean platelet volume and platelet count in type 2 diabetes mellitus on treatment and non diabetes controls in lagos. Pan Afr Med J 2014;18:42.