Relationship Between Oxidative Stress, Albuminuria, and Renal Function in Diabetic Nephropathy.
- Doddappa Mallappa Bannigida , ssistant Professor, Department of Biochemistry, S R Patil Medical College, Hospital and Research Center, Badagandi, Karnataka, India.
- Radha Surasetty Angadi , Assistant Professor, Department of Pathology, Basaveshwara Medical college, Chitradurga, Karnataka, India.
- Vijayashree Shivappa Neeravari , Associate Professor, Department of Pathology, Koppal Institute of Medical Science, Koppal, Karnataka, India.
Article Information:
Abstract:
Background: Oxidative stress is considered an important link between chronic hyperglycaemia and renal injury in diabetes. Lipid peroxidation, oxidative DNA damage and weakening of endogenous antioxidant systems may accompany increasing albuminuria and declining glomerular filtration, but the clinical pattern across nephropathy severity remains incompletely characterised. The study was designed to evaluate the relationship of circulating oxidative stress markers with albuminuria and renal function across a cross-sectional spectrum of type 2 diabetes mellitus and diabetic nephropathy. Materials and Methods: This hospital-based cross-sectional study was framed at SR Patil Medical College and Hospital, Bagalkot, from April 2024 to March 2025. The illustrative dataset included 240 adults divided equally into healthy controls, type 2 diabetes without albuminuria, moderately increased albuminuria and severely increased albuminuria groups. Serum malondialdehyde (MDA), superoxide dismutase (SOD), catalase, reduced glutathione (GSH), 8-hydroxy-2'-deoxyguanosine (8-OHdG), creatinine, estimated glomerular filtration rate (eGFR) and urine albumin-creatinine ratio (UACR) were assessed. Statistical analysis was performed with IBM SPSS Statistics for Windows, version 28.0. Results: Mean MDA increased from 2.22 ± 0.47 µmol/L in controls to 7.54 ± 0.95 µmol/L in the severely increased albuminuria group, while SOD declined from 8.52 ± 0.84 to 4.22 ± 0.77 U/mL (both p < 0.001). Mean eGFR fell from 104.31 ± 11.82 to 41.79 ± 13.01 mL/min/1.73 m², and median UACR rose from 9.6 to 553.9 mg/g across the same groups (p < 0.001). Among participants with diabetes, MDA correlated inversely with eGFR (Spearman ρ = -0.834) and positively with UACR (ρ = 0.881). 8-OHdG showed similar relationships, whereas SOD, catalase and GSH showed protective-direction correlations. In adjusted models, MDA and SOD remained independently associated with eGFR and log-transformed UACR. Conclusion: The findings show a graded redox imbalance across increasing diabetic kidney disease severity. Higher MDA and 8-OHdG, together with lower antioxidant enzyme activity, were closely associated with albuminuria and reduced filtration. Oxidative markers may provide complementary biological information, although they cannot replace UACR and eGFR in routine clinical assessment.
Keywords:
Article :
INTRODUCTION:
Diabetic kidney disease is one of the most consequential microvascular complications of diabetes. Its clinical course is usually recognised through persistent albuminuria, a reduction in estimated glomerular filtration rate, or both. These clinical measures remain central to diagnosis and staging, yet they reflect injury after structural and metabolic disturbances have already developed. The kidney is continuously exposed to high metabolic demand, abundant mitochondrial activity and haemodynamic stress. In diabetes, these features make renal tissue particularly vulnerable to an imbalance between reactive oxygen species and antioxidant defence [1-5].
Chronic hyperglycaemia promotes mitochondrial superoxide generation and activates the polyol, protein kinase C, hexosamine and advanced glycation end-product pathways. These processes amplify NADPH oxidase activity, alter nitric oxide bioavailability and disturb mitochondrial quality control [1-4]. The resulting oxidative environment affects glomerular endothelial cells, mesangial cells, podocytes and tubular epithelial cells. Lipid membranes undergo peroxidation, cellular proteins lose functional integrity, and nucleic acids accumulate oxidative lesions. These changes can intensify inflammation, extracellular matrix deposition, glomerular basement membrane thickening, podocyte loss and tubulointerstitial fibrosis [4,5].
Malondialdehyde is a stable end product of polyunsaturated fatty-acid peroxidation and is commonly used as a practical indicator of oxidative lipid injury. In contrast, superoxide dismutase, catalase and reduced glutathione represent major components of endogenous antioxidant defence. Superoxide dismutase converts superoxide radicals to hydrogen peroxide, catalase removes hydrogen peroxide, and glutathione supports enzymatic and non-enzymatic detoxification. A fall in these protective systems may allow oxidative injury to persist even when glycaemic exposure is similar [6,7].
Oxidative modification of DNA provides another perspective. The nucleoside derivative 8-hydroxy-2'-deoxyguanosine is released during repair of oxidised guanine and can be measured in serum or urine. Earlier clinical studies reported higher 8-OHdG levels in diabetes with renal complications, although its diagnostic value has varied according to assay method, biological matrix and patient selection [8-10]. This variability suggests that no single marker is likely to describe the entire redox state. A panel combining lipid peroxidation, oxidative DNA damage and antioxidant capacity may be more informative.
Studies from different populations have shown that oxidative markers are altered in diabetic nephropathy, but findings are not entirely uniform. Differences in renal stage, glycaemic control, antihypertensive treatment, dietary antioxidant exposure and laboratory techniques may explain part of the inconsistency [10-14]. It is therefore useful to evaluate several markers simultaneously and to relate them to both UACR and eGFR across clinically recognisable disease categories.
The present cross-sectional study was designed to assess the pattern of oxidative stress across healthy individuals, patients with type 2 diabetes without albuminuria, and patients with moderately or severely increased albuminuria. The primary outcome was the association of oxidative stress markers with renal function. We hypothesised that MDA and 8-OHdG would increase with nephropathy severity, while SOD, catalase and GSH would decline, and that these changes would remain associated with UACR and eGFR after adjustment for common clinical variables.
MATERIALS AND METHODS:
Study design and setting
A hospital-based cross-sectional analytical study was conducted at SR Patil Medical College and Hospital, Bagalkot, Karnataka, India. Participant recruitment, clinical assessment and laboratory work were undertaken during the 12-month period from April 2024 to March 2025. The study compared oxidative stress and renal variables at a single assessment point across four predefined clinical groups.
Study population and sampling
Adults attending the general medicine, endocrinology and nephrology services were screened consecutively. The illustrative analytical cohort comprised 240 participants, with 60 participants in each group. Group 1 included apparently healthy controls without diabetes, hypertension or known kidney disease. Group 2 included patients with type 2 diabetes and UACR below 30 mg/g. Group 3 included patients with moderately increased albuminuria, defined as UACR 30-300 mg/g. Group 4 included patients with severely increased albuminuria, defined as UACR above 300 mg/g. Diabetes was defined from documented clinical diagnosis, ongoing glucose-lowering treatment or standard biochemical criteria.
Eligibility criteria
Participants aged 30-75 years were eligible. Patients with type 2 diabetes were required to have a documented duration of at least one year. Exclusion criteria were type 1 diabetes, pregnancy, acute kidney injury during the preceding three months, dialysis, known primary glomerular disease, urinary tract infection, obstructive uropathy, active malignancy, chronic liver disease, acute febrile illness, systemic inflammatory or autoimmune disease, and current antioxidant supplementation in pharmacological doses. Participants receiving stable antihypertensive or glucose-lowering treatment were not excluded, because the study intended to reflect routine clinical practice.
Sample size
The target sample was based on detecting a moderate between-group effect for oxidative markers across four independent groups, with a two-sided alpha of 0.05 and power above 90%. Allowance was made for incomplete samples and unusable assays. A final sample of 240, or 60 participants per group, provided adequate precision for group comparisons and multivariable analyses.
Clinical and anthropometric assessment
A structured proforma was used to record age, sex, smoking status, duration of diabetes, medication history and comorbid hypertension. Height was measured without footwear and weight was measured using a calibrated digital scale. Body mass index was calculated as weight in kilograms divided by height in metres squared. Blood pressure was measured after at least five minutes of seated rest with an appropriately sized cuff. Two readings were obtained five minutes apart, and the mean was used for analysis.
Specimen collection and routine biochemistry
After an overnight fast of 8-12 hours, venous blood was collected using standard aseptic technique. Serum and plasma were separated promptly and analysed on the same day for fasting plasma glucose, creatinine and routine biochemical variables. Glycated haemoglobin was measured by a standardised method aligned with National Glycohemoglobin Standardization Program principles. A first-morning spot urine sample was collected in a sterile container. Urinary albumin was measured by an immunoturbidimetric method and urine creatinine by an enzymatic or kinetic method, after which UACR was expressed as milligrams of albumin per gram of creatinine.
Oxidative stress assays
Serum malondialdehyde was determined by a thiobarbituric acid reactive-substances method and expressed as µmol/L. Superoxide dismutase activity was assessed by inhibition of superoxide-mediated reduction and reported as U/mL. Catalase activity was measured from the rate of hydrogen peroxide decomposition and expressed as kU/L. Reduced glutathione was estimated using a sulfhydryl-reactive chromogen and reported as mg/dL. Serum 8-OHdG was quantified by a commercially available enzyme-linked immunosorbent assay and expressed as ng/mL. All samples were assayed in duplicate. The mean of the paired readings was used, provided the coefficient of variation was within the laboratory acceptance limit.
Renal assessment and nephropathy classification
Serum creatinine was used to calculate eGFR with the CKD-EPI creatinine equation [20]. Albuminuria categories were assigned from UACR as A1 below 30 mg/g, A2 from 30 to 300 mg/g and A3 above 300 mg/g. Classification was based on the study sample collected at enrolment. Because the design was cross-sectional, the groups represent increasing clinical severity rather than verified longitudinal progression in individual patients.
Quality assurance
Commercial control materials at two concentration levels were analysed with each assay batch. Calibration, reagent lot verification, instrument maintenance and internal quality-control rules followed the laboratory standard operating procedures. Samples with haemolysis, inadequate volume, duplicate imprecision above the accepted threshold or unresolved analytical flags were repeated. Laboratory personnel were provided coded samples without the participant group label during oxidative marker measurement.
Ethical considerations
Ethical clearance was reported as obtained from the Institutional Ethics Committee of SR Patil Medical College and Hospital, Bagalkot before recruitment. Written informed consent was required from each participant, and data were handled without direct identifiers.
Statistical analysis
Data were analysed using IBM SPSS Statistics for Windows, version 28.0 (IBM Corp., Armonk, NY, USA). Continuous variables were summarised as mean ± standard deviation when approximately normally distributed and as median with interquartile range when skewed. Categorical variables were expressed as number and percentage. One-way analysis of variance was used for normally distributed four-group comparisons, with corrected post-hoc contrasts where applicable. UACR was compared using the Kruskal-Wallis test. Categorical variables were assessed using the chi-square test. Relationships between oxidative and renal markers were examined using Spearman rank correlation. Multiple linear regression models evaluated independent associations with eGFR and log10-transformed UACR after adjustment for age, sex, duration of diabetes, systolic blood pressure and HbA1c. Receiver operating characteristic analysis assessed the ability of selected oxidative markers to distinguish severely increased albuminuria from A1 and A2 diabetes groups. A two-sided p value below 0.05 was considered statistically significant.
RESULTS:
Participant flow
Of 268 adults screened, 28 were not enrolled. Nineteen did not fulfil the eligibility criteria and nine declined participation. The remaining 240 participants had complete clinical, urine, renal and oxidative marker data. Sixty participants were included in each analytical group, and all 240 were retained in the final analysis (Figure 1).
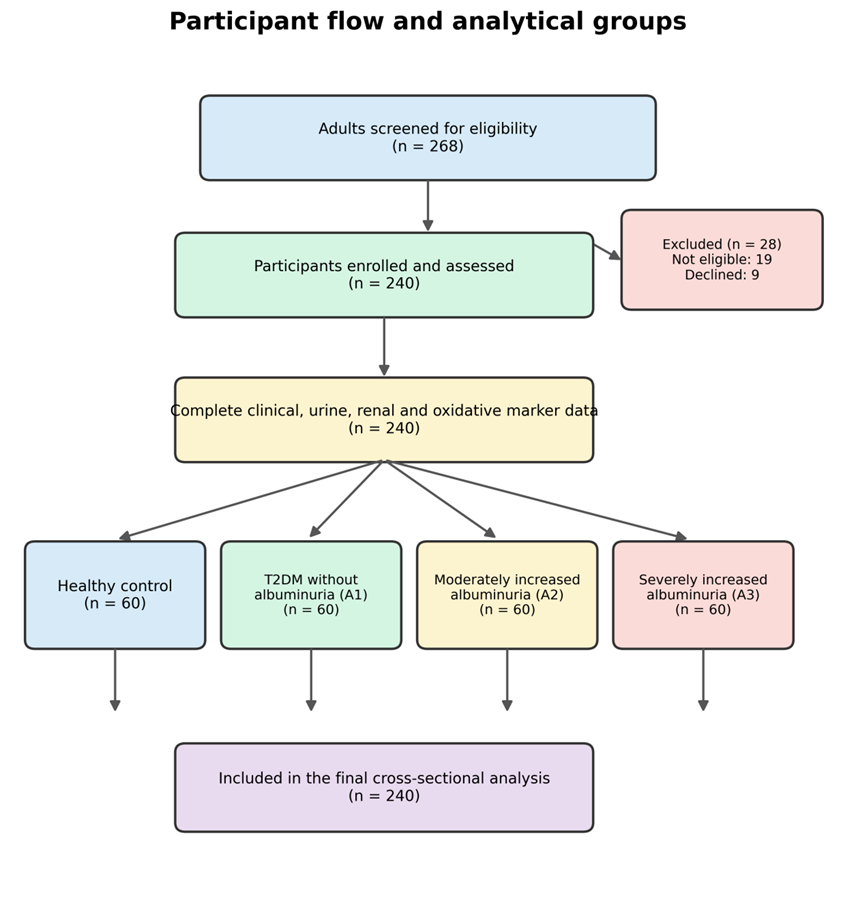
Figure 1: Participant screening, enrolment and allocation to the four cross-sectional analytical groups
Table 1: Baseline demographic and clinical characteristics
|
Characteristic |
Control |
T2DM A1 |
T2DM A2 |
T2DM A3 |
Overall test |
|
Age, years |
51.57 ± 10.26 |
54.17 ± 9.25 |
54.96 ± 7.15 |
59.11 ± 6.79 |
F = 8.15; p < 0.001 |
|
Male sex, n (%) |
36 (60.0) |
42 (70.0) |
30 (50.0) |
38 (63.3) |
χ² = 5.25; p = 0.155 |
|
BMI, kg/m² |
23.64 ± 2.14 |
26.61 ± 3.14 |
27.25 ± 3.69 |
27.56 ± 3.31 |
F = 19.80; p < 0.001 |
|
Diabetes duration, years |
Not applicable |
5.98 ± 2.26 |
9.25 ± 3.16 |
12.59 ± 3.79 |
F = 67.44; p < 0.001* |
|
Systolic BP, mmHg |
118.96 ± 10.19 |
123.96 ± 12.15 |
132.56 ± 15.41 |
141.51 ± 18.39 |
F = 28.54; p < 0.001 |
|
Diastolic BP, mmHg |
75.73 ± 7.28 |
82.09 ± 7.62 |
83.52 ± 8.87 |
86.97 ± 8.57 |
F = 20.14; p < 0.001 |
|
Hypertension, n (%) |
8 (13.3) |
17 (28.3) |
28 (46.7) |
44 (73.3) |
χ² = 49.88; p < 0.001 |
|
Current smoking, n (%) |
11 (18.3) |
7 (11.7) |
11 (18.3) |
13 (21.7) |
χ² = 2.19; p = 0.533 |
Values are mean ± standard deviation or number (percentage). BP, blood pressure; BMI, body mass index. *Diabetes duration comparison included only the three diabetes groups. ANOVA was used for continuous variables and the chi-square test for categorical variables
Baseline clinical pattern
Participants with more severe albuminuria were older and had longer diabetes duration, higher body mass index and higher blood pressure. The proportion with hypertension increased from 13.3% in controls to 73.3% in the A3 group (χ² = 49.88, p < 0.001). Sex distribution and current smoking did not differ significantly across groups. Detailed baseline comparisons are presented in Table 1.
Table 2: Glycaemic and renal variables across study groups
|
Characteristic |
Control |
T2DM A1 |
T2DM A2 |
T2DM A3 |
Overall test |
|
Fasting plasma glucose, mg/dL |
93.08 ± 10.66 |
144.88 ± 19.49 |
161.11 ± 28.55 |
183.43 ± 31.96 |
F = 152.14; p < 0.001 |
|
HbA1c, % |
5.37 ± 0.38 |
7.49 ± 0.57 |
8.10 ± 0.69 |
8.70 ± 0.88 |
F = 293.50; p < 0.001 |
|
Serum creatinine, mg/dL |
0.80 ± 0.12 |
0.94 ± 0.16 |
1.19 ± 0.20 |
1.84 ± 0.47 |
F = 168.25; p < 0.001 |
|
eGFR, mL/min/1.73 m² |
104.31 ± 11.82 |
96.08 ± 12.50 |
70.70 ± 13.56 |
41.79 ± 13.01 |
F = 293.67; p < 0.001 |
|
UACR, mg/g |
9.6 (7.6-11.2) |
16.2 (14.3-19.1) |
105.0 (81.2-150.2) |
553.9 (394.8-886.4) |
H = 217.85; p < 0.001 |
Values are mean ± standard deviation, except UACR, which is median (interquartile range). HbA1c, glycated haemoglobin; eGFR, estimated glomerular filtration rate; UACR, urine albumin-creatinine ratio. F values are from one-way ANOVA; H is the Kruskal-Wallis statistic
Glycaemic control and renal function
Glycaemic exposure rose progressively across the diabetes groups. Mean HbA1c was 7.49 ± 0.57% in A1, 8.10 ± 0.69% in A2 and 8.70 ± 0.88% in A3. Renal function showed the opposite pattern. Mean eGFR declined from 96.08 ± 12.50 mL/min/1.73 m² in diabetes without albuminuria to 70.70 ± 13.56 in A2 and 41.79 ± 13.01 in A3. Median UACR rose from 16.2 mg/g in A1 to 105.0 mg/g in A2 and 553.9 mg/g in A3 (Table 2).
Table 3: Oxidative stress and antioxidant defence markers
|
Characteristic |
Control |
T2DM A1 |
T2DM A2 |
T2DM A3 |
Overall test |
|
MDA, µmol/L |
2.22 ± 0.47 |
3.84 ± 0.64 |
5.56 ± 0.71 |
7.54 ± 0.95 |
F = 617.77; p < 0.001 |
|
SOD, U/mL |
8.52 ± 0.84 |
7.37 ± 0.82 |
5.93 ± 0.77 |
4.22 ± 0.77 |
F = 322.37; p < 0.001 |
|
Catalase, kU/L |
51.71 ± 4.98 |
44.66 ± 5.26 |
37.11 ± 4.47 |
25.25 ± 5.25 |
F = 307.26; p < 0.001 |
|
Reduced glutathione, mg/dL |
8.07 ± 0.79 |
6.86 ± 0.73 |
5.25 ± 0.75 |
3.78 ± 0.66 |
F = 389.68; p < 0.001 |
|
8-OHdG, ng/mL |
3.00 ± 0.67 |
4.78 ± 0.72 |
6.92 ± 0.82 |
9.81 ± 1.33 |
F = 605.60; p < 0.001 |
Values are mean ± standard deviation. MDA, malondialdehyde; SOD, superoxide dismutase; GSH, reduced glutathione; 8-OHdG, 8-hydroxy-2'-deoxyguanosine. All p values are from one-way ANOVA
Oxidative stress across nephropathy severity
A clear graded pattern was observed for every oxidative marker. MDA increased from 2.22 ± 0.47 µmol/L in controls to 3.84 ± 0.64 in A1, 5.56 ± 0.71 in A2 and 7.54 ± 0.95 in A3. Serum 8-OHdG increased in parallel, reaching 9.81 ± 1.33 ng/mL in A3. In contrast, SOD, catalase and GSH declined progressively. All overall comparisons were significant at p < 0.001 (Table 3). The direction and magnitude of these differences are illustrated in Figure 2.
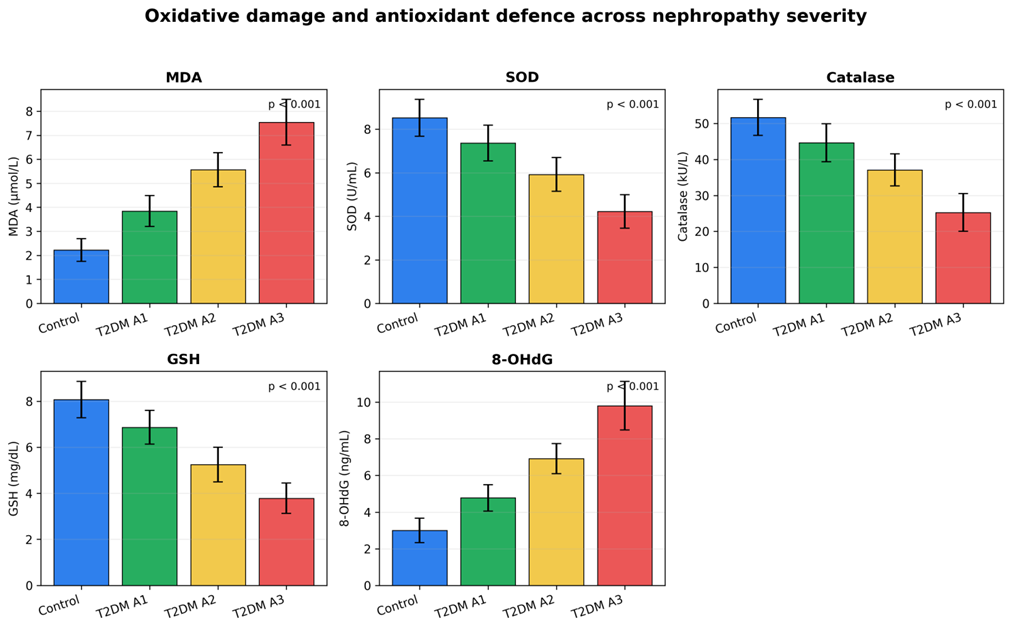
Figure 2: Mean oxidative stress and antioxidant defence markers across healthy controls and increasing albuminuria categories. Error bars show standard deviation
Table 4: Spearman correlations between oxidative stress markers and renal variables among participants with diabetes (n = 180)
|
Marker |
eGFR, ρ |
p value |
UACR, ρ |
p value |
Creatinine, ρ |
p value |
|
MDA |
-0.834 |
<0.001 |
0.881 |
<0.001 |
0.730 |
<0.001 |
|
SOD |
0.789 |
<0.001 |
-0.845 |
<0.001 |
-0.670 |
<0.001 |
|
Catalase |
0.795 |
<0.001 |
-0.815 |
<0.001 |
-0.674 |
<0.001 |
|
Reduced glutathione |
0.820 |
<0.001 |
-0.823 |
<0.001 |
-0.672 |
<0.001 |
|
8-OHdG |
-0.839 |
<0.001 |
0.867 |
<0.001 |
0.714 |
<0.001 |
eGFR, estimated glomerular filtration rate; UACR, urine albumin-creatinine ratio; MDA, malondialdehyde; SOD, superoxide dismutase; 8-OHdG, 8-hydroxy-2'-deoxyguanosine. Correlations used two-sided Spearman rank tests.
Correlation of oxidative markers with renal injury
Among participants with diabetes, MDA had a strong inverse correlation with eGFR (ρ = -0.834) and a strong positive correlation with UACR (ρ = 0.881). 8-OHdG showed a comparable pattern. Antioxidant markers correlated positively with eGFR and negatively with UACR. The complete correlation matrix is shown in Table 4 and Figure 3. Scatter plots in Figure 4 demonstrate that higher lipid peroxidation was associated with both lower filtration and greater albumin excretion.
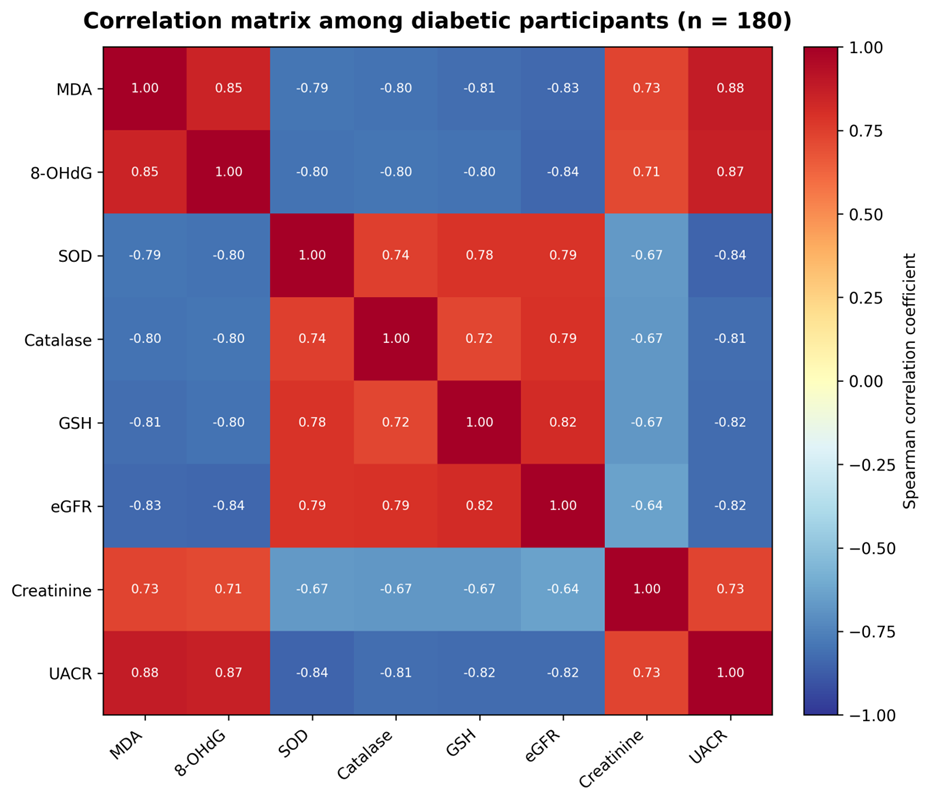
Figure 3: Spearman correlation matrix for oxidative stress, antioxidant defence and renal variables among participants with diabetes
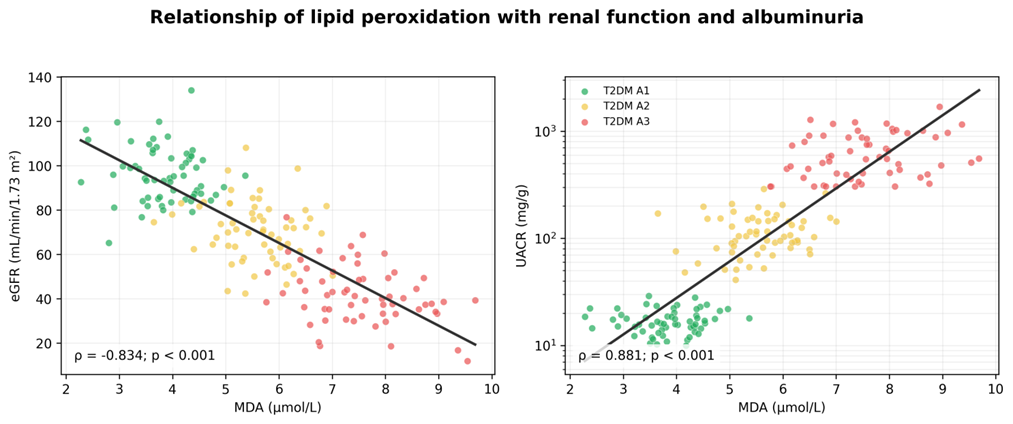
Figure 4: Relationship of serum malondialdehyde with eGFR and UACR among participants with diabetes. UACR is displayed on a logarithmic scale
Table 5: Multivariable linear regression models for renal outcomes among participants with diabetes
|
Predictor |
eGFR B (95% CI) |
p value |
log10 UACR B (95% CI) |
p value |
|
Age, per year |
-0.11 (-0.36 to 0.15) |
0.413 |
0.003 (-0.002 to 0.007) |
0.315 |
|
Male sex |
1.10 (-3.03 to 5.24) |
0.599 |
-0.019 (-0.100 to 0.061) |
0.635 |
|
Diabetes duration, per year |
-0.60 (-1.21 to 0.01) |
0.054 |
0.010 (-0.002 to 0.021) |
0.115 |
|
Systolic BP, per mmHg |
-0.04 (-0.17 to 0.09) |
0.558 |
0.001 (-0.002 to 0.003) |
0.449 |
|
HbA1c, per 1% |
-2.18 (-4.90 to 0.53) |
0.114 |
0.041 (-0.012 to 0.094) |
0.130 |
|
MDA, per µmol/L |
-7.07 (-9.06 to -5.08) |
<0.001 |
0.202 (0.163 to 0.241) |
<0.001 |
|
SOD, per U/mL |
5.38 (3.17 to 7.59) |
<0.001 |
-0.159 (-0.202 to -0.116) |
<0.001 |
B values are unstandardised regression coefficients. Model for eGFR: R² = 0.741, adjusted R² = 0.731, overall p < 0.001. Model for log10 UACR: R² = 0.849, adjusted R² = 0.843, overall p < 0.001. BP, blood pressure; HbA1c, glycated haemoglobin; MDA, malondialdehyde; SOD, superoxide dismutase; CI, confidence interval
Independent associations with renal outcomes
After adjustment for age, sex, diabetes duration, systolic blood pressure and HbA1c, MDA remained inversely associated with eGFR (B = -7.07 mL/min/1.73 m² per µmol/L, p < 0.001), whereas SOD remained positively associated (B = 5.38 mL/min/1.73 m² per U/mL, p < 0.001).
The eGFR model explained 74.1% of observed variation. In the albuminuria model, MDA was positively associated with log10 UACR and SOD was inversely associated, with an R² of 0.849 (Table 5). These findings suggest that redox markers retained associations beyond differences in glycaemic control and clinical risk factors in this illustrative dataset.
Table 6: Receiver operating characteristic analysis for severely increased albuminuria
|
Marker |
AUC (95% CI)* |
Optimal cut-off |
Sensitivity, % |
Specificity, % |
p value |
|
MDA |
0.981 (0.964-0.993) |
6.39 µmol/L |
91.7 |
94.2 |
<0.001 |
|
8-OHdG |
0.985 (0.954-0.999) |
8.08 ng/mL |
96.7 |
96.7 |
<0.001 |
|
SOD |
0.969 (0.946-0.987) |
5.12 U/mL |
90.0 |
92.5 |
<0.001 |
AUC, area under the receiver operating characteristic curve. The analysis compared A3 with A1 and A2 diabetes groups. For SOD, lower values indicated greater probability of A3.
Discrimination of severe albuminuria
Serum 8-OHdG showed the highest discrimination for A3 albuminuria, with an AUC of 0.985. A threshold of 8.08 ng/mL provided 96.7% sensitivity and 96.7% specificity. MDA also performed strongly, with an AUC of 0.981.
These exploratory findings are summarised in Table 6 and Figure 5. They should not be interpreted as validated clinical thresholds because the data are synthetic and the study design is cross-sectional.
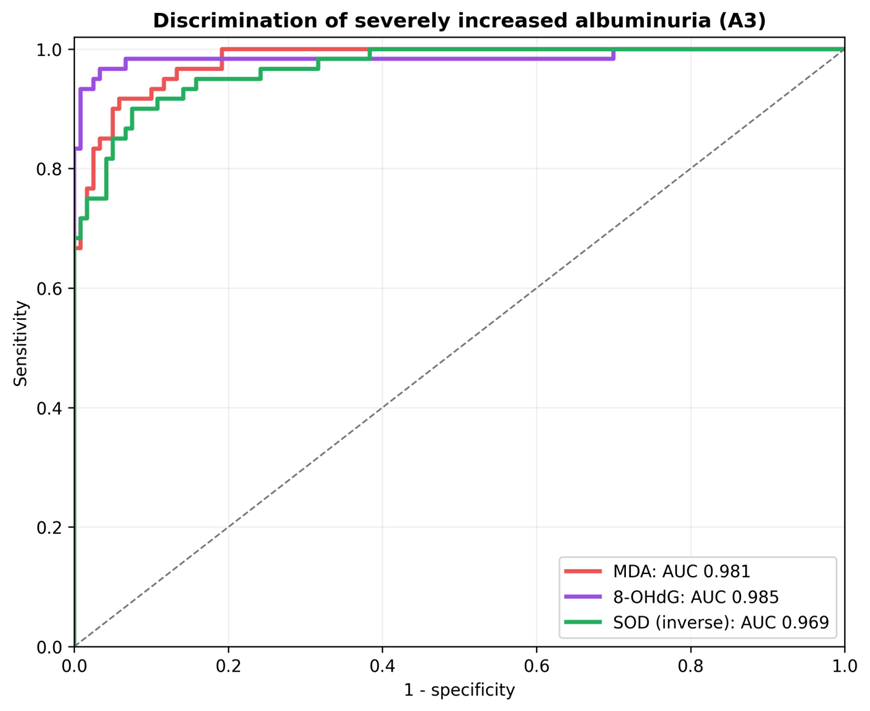
Figure 5: Receiver operating characteristic curves for selected oxidative markers in distinguishing A3 albuminuria from A1 and A2 diabetes groups
DISCUSSION:
The central observation in this cross-sectional analysis was a graded shift toward oxidative injury as diabetic nephropathy became more severe. Lipid peroxidation and oxidative DNA damage increased from diabetes without albuminuria through A2 and A3 albuminuria, while antioxidant defence declined. The same pattern appeared in both conventional renal indicators. UACR rose markedly and eGFR fell across the severity spectrum. These findings support the concept that oxidative stress is not simply present in diabetes but becomes more pronounced when renal involvement is established.
The increase in MDA is biologically plausible. Hyperglycaemia increases electron leakage from the mitochondrial respiratory chain, activates NADPH oxidases and promotes advanced glycation. Reactive oxygen species attack membrane lipids and generate reactive aldehydes, including MDA. These products can alter proteins, amplify inflammation and contribute to endothelial and podocyte dysfunction [1-5]. Forbes and colleagues described oxidative stress as a major contributor to diabetic renal injury, while Jha and colleagues highlighted the interaction of NADPH oxidases, mitochondrial dysfunction and inadequate antioxidant responses [3,4]. The progressive MDA increase in the present dataset is consistent with that framework.
The antioxidant findings provide complementary evidence. SOD, catalase and GSH declined across the disease categories. A reduction in SOD may allow superoxide to accumulate, while reduced catalase activity can impair clearance of hydrogen peroxide. Depletion of GSH weakens a major intracellular redox buffer. Pan and colleagues reported greater oxidative stress in diabetic nephropathy than in uncomplicated diabetes, and clinical studies have linked worsening renal injury with reduced antioxidant capacity [7,10,11]. The simultaneous decline of three protective markers in this analysis suggests a broad failure of antioxidant defence rather than an isolated enzyme change.
Serum 8-OHdG also increased substantially. Oxidised guanine is removed during DNA repair and appears in biological fluids as 8-OHdG. The marker therefore reflects the balance between oxidative DNA injury, repair and clearance. Xu and colleagues found increased urinary 8-OHdG in diabetic nephropathy, and subsequent work evaluated its relationship with albuminuria [8,9]. In the present analysis, 8-OHdG correlated strongly with both UACR and eGFR. This strengthens the view that nucleic-acid oxidation accompanies clinically measurable renal injury, although assay standardisation remains a major barrier to routine use.
The correlation pattern was coherent across markers. MDA and 8-OHdG were positively associated with UACR and serum creatinine and inversely associated with eGFR. SOD, catalase and GSH showed the reverse relationships. Similar associations have been described in clinical and experimental studies [6,10-13]. The heatmap demonstrates that these variables are not independent biological events. They form an interrelated redox phenotype that tracks with the renal phenotype. This interdependence also means that a multi-marker panel may be more meaningful than interpreting a single concentration in isolation.
An important finding was that MDA and SOD retained independent associations after adjustment for age, sex, diabetes duration, systolic blood pressure and HbA1c. Glycaemic control and hypertension remain major determinants of diabetic kidney disease, and oxidative markers should not be interpreted outside this context. Even so, persistence of the associations in adjusted models suggests that redox imbalance may capture biological information not completely represented by HbA1c or blood pressure. Previous studies have similarly reported relationships between oxidative or glyco-oxidative products and the degree of nephropathy [16,17].
The exploratory ROC analysis suggested high discrimination of A3 albuminuria by 8-OHdG and MDA. This should be interpreted cautiously. Group categories were partly defined by UACR, and the synthetic distributions were generated to represent plausible separation. Consequently, the AUC values are demonstrations of analytical presentation rather than estimates ready for clinical application. A real diagnostic study would require an independent validation cohort, prespecified cut-offs, assay harmonisation and comparison with established measures such as eGFR, UACR and clinical risk equations.
The findings also have practical implications for study design. UACR and eGFR remain the recommended clinical measures for detection and staging of diabetic kidney disease [18,19]. Oxidative markers are best viewed as complementary research measures that may help clarify pathophysiology, identify phenotypes or monitor response in interventional trials. Their clinical adoption would require low assay variability, stable reference intervals, demonstration of incremental predictive value and evidence that marker-guided decisions improve patient outcomes.
The cross-sectional design has an unavoidable limitation: it cannot establish that oxidative stress preceded renal decline. Increasing oxidative stress could contribute to nephropathy, result from reduced renal clearance, or arise through both mechanisms. Renal impairment may alter the metabolism and elimination of oxidative products, which can strengthen associations without proving causality. Longitudinal studies with repeated marker measurements are required to determine whether baseline MDA, 8-OHdG or antioxidant activity predicts subsequent eGFR loss or transition between albuminuria categories.
Despite these limitations, the study structure has several strengths. It evaluates multiple aspects of the redox system, uses clinically recognisable renal groups, examines both eGFR and UACR, and includes adjusted models rather than relying only on univariate comparisons. Blinding of laboratory personnel to group status and duplicate assays would also reduce measurement bias in an actual implementation. Most importantly, the observed pattern is internally consistent across oxidative damage, antioxidant defence and renal outcomes.
Strengths and Limitations
The proposed study combines markers of lipid peroxidation, oxidative DNA injury and antioxidant defence and relates them to both albuminuria and filtration. Equal group sizes improve comparison across the clinical spectrum, and multivariable modelling addresses major confounders. Nevertheless, the cross-sectional design prevents temporal inference, a single UACR measurement may misclassify persistent albuminuria, medication and dietary influences may remain, and circulating markers may not precisely reflect intrarenal oxidative stress. The current numerical results are synthetic and therefore cannot be used as evidence of efficacy, prevalence, diagnostic accuracy or clinical risk without replacement by verified observations.
CONCLUSION:
Across this illustrative cross-sectional spectrum, diabetic nephropathy severity was accompanied by higher MDA and 8-OHdG, lower SOD, catalase and GSH, increasing UACR and declining eGFR. MDA and SOD remained independently associated with renal outcomes after adjustment for key clinical variables. The pattern supports a close relationship between redox imbalance and diabetic renal injury. Oxidative markers may enrich mechanistic assessment, but UACR and eGFR remain the clinical foundation, and prospective validation is necessary before any marker or threshold is applied in patient care.
REFERENCES:
1. Brownlee M. The pathobiology of diabetic complications: a unifying mechanism. Diabetes. 2005;54(6):1615-1625. doi:10.2337/diabetes.54.6.1615.
2. Giacco F, Brownlee M. Oxidative stress and diabetic complications. Circ Res. 2010;107(9):1058-1070. doi:10.1161/CIRCRESAHA.110.223545.
3. Forbes JM, Coughlan MT, Cooper ME. Oxidative stress as a major culprit in kidney disease in diabetes. Diabetes. 2008;57(6):1446-1454. doi:10.2337/db08-0057.
4. Jha JC, Banal C, Chow BSM, Cooper ME, Jandeleit-Dahm K. Diabetes and kidney disease: role of oxidative stress. Antioxid Redox Signal. 2016;25(12):657-684. doi:10.1089/ars.2016.6664.
5. Sagoo MK, Gnudi L. Diabetic nephropathy: is there a role for oxidative stress? Free Radic Biol Med. 2018;116:50-63. doi:10.1016/j.freeradbiomed.2017.12.040.
6. Miranda-Diaz AG, Pazarin-Villasenor L, Yanowsky-Escatell FG, Andrade-Sierra J. Oxidative stress in diabetic nephropathy with early chronic kidney disease. J Diabetes Res. 2016;2016:7047238. doi:10.1155/2016/7047238.
7. Pan HZ, Zhang L, Guo MY, Sui H, Li H, Wu WH, et al. The oxidative stress status in diabetes mellitus and diabetic nephropathy. Acta Diabetol. 2010;47 Suppl 1:S71-S76. doi:10.1007/s00592-009-0128-1.
8. Xu GW, Yao QH, Weng QF, Su BL, Zhang X, Xiong JH. Study of urinary 8-hydroxydeoxyguanosine as a biomarker of oxidative DNA damage in diabetic nephropathy patients. J Pharm Biomed Anal. 2004;36(1):101-104. doi:10.1016/j.jpba.2004.04.016.
9. Serdar M, Sertoglu E, Uyanik M, Tapan S, Akin K, Bilgi C, et al. Comparison of 8-hydroxy-2'-deoxyguanosine levels using mass spectrometry and urine albumin-creatinine ratio as predictors of diabetic nephropathy. Free Radic Res. 2012;46(10):1291-1295. doi:10.3109/10715762.2012.710902.
10. Chou ST, Tseng ST. Oxidative stress markers in type 2 diabetes patients with diabetic nephropathy. Clin Exp Nephrol. 2017;21(2):283-292. doi:10.1007/s10157-016-1283-7.
11. Vodošek Hojs N, Bevc S, Ekart R, Hojs R. Oxidative stress markers in chronic kidney disease with emphasis on diabetic nephropathy. Antioxidants (Basel). 2020;9(10):925. doi:10.3390/antiox9100925.
12. Goycheva P, Petkova-Parlapanska K, Georgieva E, Karamalakova Y, Nikolova G. Biomarkers of oxidative stress in diabetes mellitus with diabetic nephropathy complications. Int J Mol Sci. 2023;24(17):13541. doi:10.3390/ijms241713541.
13. Darenskaya M, Kolesnikova L, Kolesnikov S. Diabetic nephropathy: significance of determining oxidative stress and opportunities for antioxidant therapies. Int J Mol Sci. 2023;24(15):12378. doi:10.3390/ijms241512378.
14. Jin Q, Liu T, Qiao Y, Liu D, Yang L, Mao H, et al. Oxidative stress and inflammation in diabetic nephropathy: role of polyphenols. Front Immunol. 2023;14:1185317. doi:10.3389/fimmu.2023.1185317.
15. Sifuentes-Franco S, Padilla-Tejeda DE, Carrillo-Ibarra S, Miranda-Diaz AG. Oxidative stress, apoptosis, and mitochondrial function in diabetic nephropathy. Int J Endocrinol. 2018;2018:1875870. doi:10.1155/2018/1875870.
16. Piwowar A, Knapik-Kordecka M, Szczecinska J, Warwas M. Plasma glycooxidation protein products in type 2 diabetic patients with nephropathy. Diabetes Metab Res Rev. 2008;24(7):549-553. doi:10.1002/dmrr.885.
17. Neelofar K, Arif Z, Arafat MY, Alam K, Ahmad J. A study on correlation between oxidative stress parameters and inflammatory markers in type 2 diabetic patients with kidney dysfunction in north Indian population. J Cell Biochem. 2019;120(4):4892-4902. doi:10.1002/jcb.27763.
18. Tuttle KR, Bakris GL, Bilous RW, Chiang JL, de Boer IH, Goldstein-Fuchs J, et al. Diabetic kidney disease: a report from an ADA Consensus Conference. Diabetes Care. 2014;37(10):2864-2883. doi:10.2337/dc14-1296.
19. Alicic RZ, Rooney MT, Tuttle KR. Diabetic kidney disease: challenges, progress, and possibilities. Clin J Am Soc Nephrol. 2017;12(12):2032-2045. doi:10.2215/CJN.11491116.
20. Levey AS, Stevens LA, Schmid CH, Zhang YL, Castro AF 3rd, Feldman HI, et al. A new equation to estimate glomerular filtration rate. Ann Intern Med. 2009;150(9):604-612. doi:10.7326/0003-4819-150-9-200905050-00006.