Pattern of Blood Donation in a Tertiary Care Hospital : A One-Year Study.
- Parin Chaudhari , 2nd year resident doctor, department of pathology, pdu hospital Rajkot.
- Amit Agravat , professor, department of pathology, pdu hospital rajkot.
- Krupal Pujara , Assistant professor, department of pathology, pdu hospital Rajkot.
- Gauravi Dhruva , Head of department, department of pathology, pdu hospital Rajkot.
- hreya Desai , 2nd year resident doctor, department of pathology, pdu hospital Rajkot.
Article Information:
Abstract:
Background: Blood donation is a vital component of healthcare services, ensuring an adequate supply of safe blood and blood products for patients requiring transfusion. Understanding the demographic and donation characteristics of blood donors is essential for planning donor recruitment and retention strategies. Objectives: To determine the demographic profile of blood donors. To analyze the distribution of donors according to age and gender. To assess the proportion of voluntary and replacement donors. To evaluate the contribution of first-time and repeat donors. Materials and Methods: A retrospective cross-sectional study was conducted in the blood centre of a PDU civil Hospital, Rajkot. Data from all blood donors registered between May 2025 and April 2026 were reviewed. Variables analyzed included age, gender, frequency of donation (first-time/repeat), blood group distribution, and donor deferral status. Data were analyzed using descriptive statistics and presented as frequencies and percentages. Results: A total of 21567 blood donations were recorded during the study period. The majority of donors were males (94.43%), while females constituted (5.56%) of donors. Most donors belonged to the age group of 18–30 years (58.2%). First-time donors represented 61.5% of donations, while repeat donors constituted 38.5%. The most common blood group was O positive (34.1%), followed by B positive (29.5%), A positive (22.3%), and AB positive (8.4%). The overall donor deferral rate was 6.8%, with low haemoglobin being the leading cause of deferral. Conclusion: Young adult males constituted the majority of blood donors. Voluntary blood donation predominated over replacement donation. Strategies to increase female participation and donor retention may further strengthen the blood supply system.
Keywords:
Article :
INTRODUCTION:
Blood transfusion services play a crucial role in healthcare delivery by ensuring the availability of safe and adequate blood and blood components. The demand for blood continues to rise due to increasing surgical procedures, trauma cases, obstetric emergencies, hematological disorders, and other medical conditions requiring transfusion support.
Voluntary non-remunerated blood donors are considered the safest source of blood because they are associated with a lower prevalence of transfusion-transmitted infections compared to replacement donors. Understanding donor demographics and donation patterns helps blood centers formulate strategies for donor recruitment, retention, and quality improvement. The present study was undertaken to evaluate the pattern of blood donation and donor characteristics in a tertiary care hospital over a one-year period.
MATERIALS AND METHODS:
The Retrospective cross sectional descriptive study was conducted in Blood Bank, PDU Civil hospital, Rajkot, Gujarat, India,over a period of One Year (May 2025 to April 2026). All eligible blood donors who donated blood during the study period were included in the study.
Inclusion Criteria
-Individuals meeting the standard donor eligibility criteria.
-Donors aged 18–65 years.
-Both voluntary and replacement donors.
Exclusion Criteria
-Deferred donors.
-Incomplete donor record
Data Collection
Data were collected from donor registration records and blood bank software. Variables analyzed included:
-Age
-Gender
-First-time or repeat donor status
-ABO and Rh blood group
-Monthly donation trends.
RESULTS:
Demographic Characteristics of Blood Donors
Male and Female Distribution of Donors
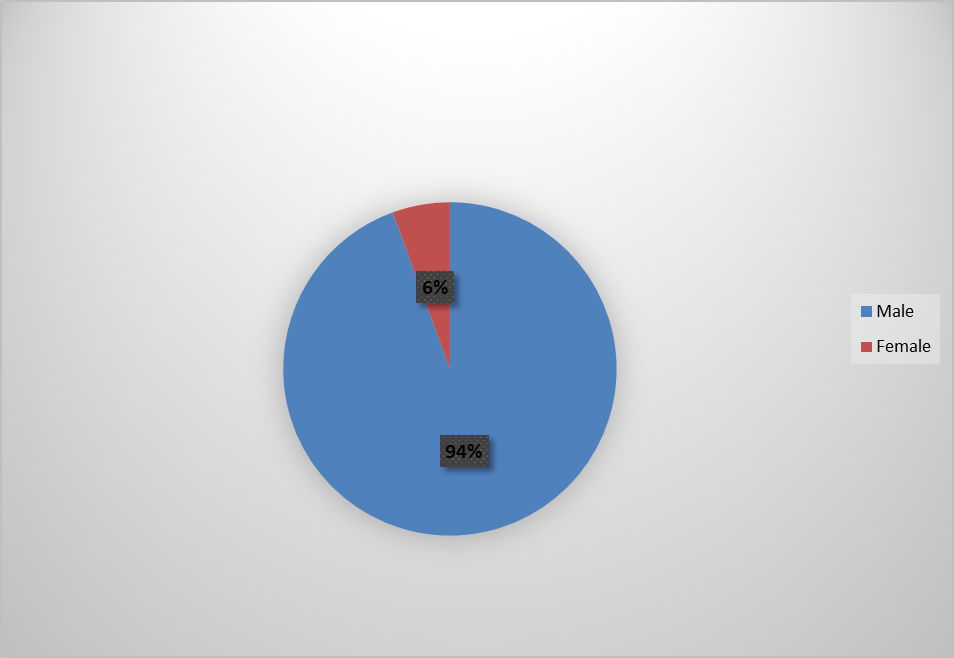
Based on Gender Distribution of Donors, Among the Total blood donations of 21567 donors the majority of Donors were Male which constituted 20366 (94.43%) and Female donors constituted 1201(05.56%) of Donors. The main cause of low blood donations in female is due to lower Hemoglobin in female due to frequent menstrustion and women those in child bearing age.
Age wise distribution of Donors
|
Age Group (Years) |
Number (%) |
|
18-30 |
12251 (56.8%) |
|
31-40 |
5607 (26.0%) |
|
41-50 |
2588 (12.0%) |
|
>50 |
1121 (5.2%) |
As observed from the above table it is seen that majority of donors were from age group 18-30 (younger population) as they can be nicely motivated to become regular donors and they will be providing good number of donors for a long duration. It is followed by 31-40 , 41-50 and then >50 age group
Blood Group Distribution of Donors
|
Blood Group |
Percentage |
|
O Positive |
35.1% |
|
B Positive |
31.1% |
|
A Positive |
19.5% |
|
AB Positive |
8.4% |
|
Rh Negatives group |
5.9% |
Among the blood group distribution O positive was found to more frequent (35.1%) followed by B positive (31.1%), A positive (19.5%) and AB positive (8.4%).
Rh negatives blood groups constituted total of 5.9% .Among Rh negatives blood groups most frequent were O negatives and B negatives which constituted about 75 % among Rh negatives followed by A negative which accounts for about 18% and AB negatives which accounts for about 7% making it rarest of all Blood Groups.
-Monthly Distribution of Donors
|
Months |
Male |
Female |
Total |
|
May |
3240 |
124 |
3364 |
|
June |
1382 |
55 |
1437 |
|
July |
1386 |
78 |
1464 |
|
August |
2120 |
125 |
2245 |
|
September |
1141 |
59 |
1200 |
|
October |
1016 |
30 |
1046 |
|
November |
1296 |
54 |
1350 |
|
December |
2799 |
228 |
3027 |
|
January |
1978 |
221 |
2199 |
|
February |
811 |
39 |
850 |
|
March |
1216 |
25 |
1241 |
|
April |
1981 |
163 |
2144 |
|
Total |
20366 |
1201 |
21567 |
|
Percentage (%) |
94.43 (%) |
5.56 (%) |
100 (%) |
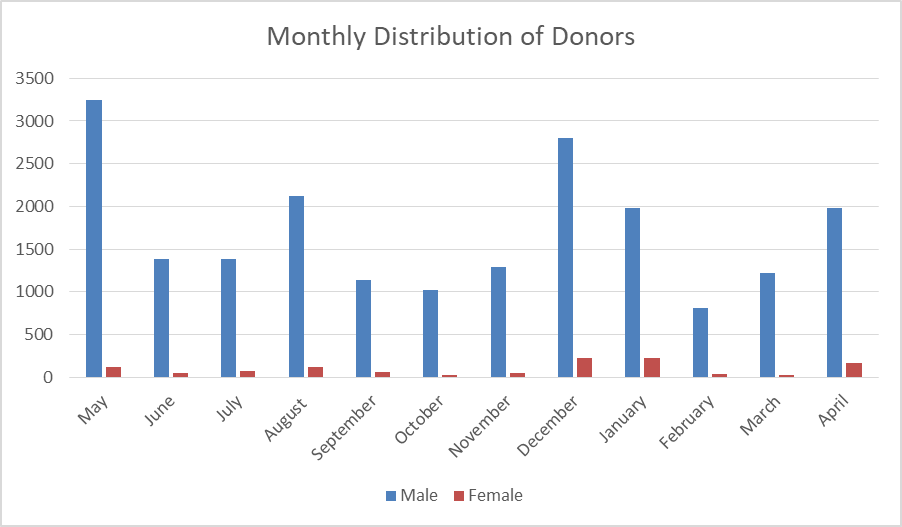
Among the study period the highest blood donation was in the month of May (3364), followed by December (2799), August (2120), the least donation was recorded during the month of February (811)
-Place of Donation
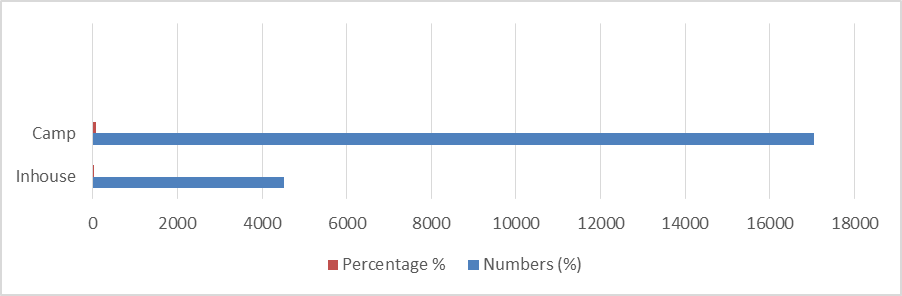
As seen from the above data successful Camp organisations has played a vital and important role in blood donation. Organizing blood donation camps has contributed significantly more in comparison with inhouse donation. The contribution of blood donation camps is 17046 (79.03%) in comparison to Inhouse blood donation which is about 4521 (20.97%).
-Donor status
|
Category |
Number (%) |
|
First time Donors |
8304 (38.5%) |
|
Repeat Donors |
13263 (61.5%) |
|
Total |
21567 (100%) |
The awareness and importance among Repeated donors for blood donation has lead to increased % of repeated donors.
DISCUSSION:
In the present study, the majority of blood donors belonged to the young adult age group (18–30 years). Young adults generally constitute the largest donor pool because they are healthier, more socially active, and are frequently recruited through educational institutions and voluntary blood donation camps.[1,2]. This observation is comparable to studies by Parveen et al. and Sehgal et al., who also reported that donors aged 18–35 years constituted the largest proportion of blood donors in Indian tertiary care hospitals.[2,3] Similarly, studies from Europe and North America have demonstrated that while first-time donors are predominantly young adults, repeat blood donation is more common among middle-aged individuals due to structured donor retention programmes and reminder systems.[4,5 ]. The predominance of younger donors in the present study therefore reflects successful donor recruitment but also indicates the need for strategies that improve long-term donor retention.
Gender distribution
The present study demonstrated marked male predominance among blood donors, whereas female participation was considerably lower. Similar observations have been reported in several Indian studies where males constituted more than 90% of the donor population.[2,3,6]
The low proportion of female donors in India has been attributed to a higher prevalence of iron deficiency anaemia, lower average body weight, pregnancy and lactation, cultural beliefs, fear of blood donation, and higher temporary deferral rates.[6,7] In contrast, studies from Europe, Australia, and Canada have reported female donor participation approaching 40–50%, reflecting improved nutritional status, better health awareness, effective donor counselling, and gender-inclusive donor recruitment programmes.[4,5] Consequently, increasing female participation remains an important challenge for blood transfusion services in India.
Table 1. Comparison of gender distribution
|
Study |
Male (%) |
Female (%) |
Remarks |
|
Present study |
94.43 |
5.57 |
- |
|
Parveen et al.² |
89.0 |
11.0 |
Male predominance |
|
Singh et al.¹⁰ |
97.6 |
2.4 |
Very low female participation |
|
North India Survey |
73.4 |
26.6 |
Higher female participation than blood bank studies |
|
Europe |
50–55 |
45–50 |
Nearly equal participation |
|
Australia |
52 |
48 |
Balanced donor profile |
Voluntary versus replacement donation
The present study showed predominance of voluntary blood donation over replacement donation. This finding is encouraging because voluntary non-remunerated blood donation is considered the safest source of blood and is strongly recommended by the World Health Organization (WHO).[8]
Comparable findings have been reported by Sehgal et al. and Parveen et al., who observed a progressive increase in voluntary blood donation following implementation of awareness campaigns and community-based blood donation drives.[2,3]
WHO has consistently reported that voluntary repeat donors have significantly lower prevalence of transfusion-transmitted infections than replacement donors because voluntary donors generally belong to low-risk populations and donate altruistically rather than under compulsion.[8,9]
In contrast, several countries in sub-Saharan Africa and parts of Southeast Asia continue to depend substantially on replacement donors because of inadequate voluntary donor pools and limited awareness regarding voluntary blood donation.[9]
Table 2. Comparison of voluntary blood donation
|
Study |
Voluntary Donation (%) |
Replacement Donation (%) |
Remarks |
|
Present study |
100 |
00 |
- |
|
Parveen et al.² |
66.8 |
33.2 |
Increasing voluntary donation |
|
Singh et al.¹⁰ |
88 |
12 |
Majority voluntary donors |
|
WHO Report⁹ |
Recommends 100% voluntary donation |
— |
Gold standard for blood safety |
|
Developed countries |
>95 |
<5 |
Strong donor retention programmes |
First-time versus repeat donors
The present study demonstrated predominance of Repeat Donors, the findings are not consistent with recent Indian reports where first-time donors constituted nearly three-fourths of the donor population.[10]
However, studies from Germany, the Netherlands, Australia, and the United States have shown substantially higher repeat donation rates owing to computerized donor registries, digital reminder systems, donor recognition programmes, and convenient appointment scheduling.[4,5] Improving repeat donor retention should therefore be considered a major objective because repeat voluntary donors contribute to a more stable and safer blood supply.[8]
Table 3. Comparison of age distribution
|
Study |
Predominant Age Group |
Observation |
|
Present study |
18-30 years |
- |
|
Parveen et al.² |
18–35 years |
Young adults predominate |
|
Singh et al.¹⁰ |
18–34 years (87.9%) |
Similar findings |
|
Germany |
25–45 years |
More repeat donors |
|
USA |
25–50 years |
Better donor retention |
|
Australia |
25–44 years |
Higher proportion of repeat donors |
Blood group distribution
In the present study, O Rh-positive was the commonest blood group, followed by B Rh-positive, A Rh-positive, and AB Rh-positive, while Rh-negative blood groups constituted only a small proportion.
These findings are comparable with studies conducted across different regions of India by Patil et al., Parveen et al., and recent studies from Uttar Pradesh, all of which reported B-positive as the predominant blood group among blood donors.[2,10,11]
However, international studies have demonstrated geographical variation in blood group distribution. In Europe, A-positive is generally the most prevalent blood group, whereas O-positive predominates in North America and Latin America.[4,12] Furthermore, Rh-negative blood groups account for approximately 15–17% of the European population compared with only 4–7% in India.^12 These differences primarily reflect ethnic and genetic diversity.
Public health implications
The findings of the present study indicate that the blood bank has developed a satisfactory voluntary donor base. Nevertheless, further efforts are required to improve female participation, enhance repeat voluntary donation, strengthen donor retention, and maintain adequate stocks of rare blood groups. WHO recommends regular donor education, donor recognition programmes, computerized donor registries, and reminder systems as effective strategies for improving voluntary blood donation and ensuring an adequate blood supply.[8,9]
Table 4. Comparison of demographic characteristics with Indian studies
|
Study |
Study Period |
Male Donors (%) |
Female Donors (%) |
Predominant Age Group |
Voluntary Donors (%) |
Replacement Donors (%) |
Common Blood Group |
Comparison with Present Study |
|
Present study |
One year |
94.4 |
5.56 |
18–30 years |
100 |
0 |
O+ |
— |
|
Parveen et al. (2021)² |
5 years |
89.0 |
11.0 |
18–35 years |
66.8 |
33.2 |
B+ |
Similar male predominance |
|
Singh et al. (2025)¹⁰ |
2018–2023 |
97.6 |
2.4 |
18–34 years (87.9%) |
88 |
12 |
B+ (33.7%) |
Similar predominance of young male voluntary donors |
|
Patil et al. (2012)¹¹ |
1 year |
>95 |
<5 |
18–40 years |
Majority |
Minority |
B+ |
Different blood group distribution and donor profile |
|
Sehgal et al. (2017)³ |
Retrospective |
>90 |
<10 |
18–35 years |
Majority |
Minority |
B+ |
Similar increase in voluntary donation |
Table 5. Comparison of blood group distribution with international studies
|
Region/Country |
Most Common Blood Group |
Rh-negative (%) |
Major Observation |
Comparison with Present Study |
||
|
Present study |
O+ |
5.9% |
Indian donor profile |
- |
||
|
India²,¹⁰ |
B+ |
4-7 |
B+ predominates |
Different from present study |
||
|
Europe |
A+ |
15-17 |
Higher frequency of A group |
Different due to ethnic variation |
||
|
North America |
O+ |
15 |
O+ most common |
Different from present study |
||
|
Middle East |
O+ |
8-10 |
|
Slightly different |
||
|
East Asia |
B+/O+ |
1-3 |
B and O groups common |
Comparable |
CONCLUSION:
The study highlights that blood donation in the tertiary care center at PDU civil hospital Rajkot was predominantly contributed by young male voluntary donors. Blood group O positive was the most common blood group. Enhanced awareness programs targeting women and promotion of repeat voluntary donation are recommended to ensure a safe and adequate blood supply.
REFERENCES:
1. Saha S, Chandra B. Understanding the underlying motives and intention among Indian blood donors towards voluntary blood donation. Transfus Clin Biol. 2018;25(2):109-117.
2. Parveen K, Khan AF, Khan AS. A study to evaluate the demographic profile of voluntary and replacement blood donors at a tertiary care hospital in Mumbai, India: a 5-year retrospective comparative analysis. Int J Res Med Sci. 2021;9(3):866-870.
3. Sehgal PK, Garg D. Patterns of voluntary and replacement blood donors in a tertiary care center: a retrospective study. Int J Res Med Sci. 2017;5:3898-3902.
4. Veldhuizen IJT, Doggen CJM, Atsma F, De Kort WLAM. Donor profiles and return behaviour among first-time blood donors. Vox Sang. 2009.
5. Carneiro-Proietti ABF, Sabino EC, Sampaio D, et al. Demographic profile and blood donor retention strategies. Transfusion. 2010.
6. NACO. Annual Report on Blood Donation in India. National AIDS Control Organisation; 2023.
7. Choudhury N. Management of blood transfusion services in India. Asian J Transfus Sci. 2009.
8. World Health Organization. Towards 100% Voluntary Blood Donation: A Global Framework for Action. Geneva: WHO; 2010.
9. World Health Organization. Global Status Report on Blood Safety and Availability. Geneva: WHO; 2022.
10. Singh P, et al. Retrospective analysis of whole blood donor demographics at a rural university in India. Bioinformation. 2025;21:952-957.
11. Patil M, Dhume V, Kavishwar V, Puranik G. Audit of blood donation and utilization of blood products at a tertiary care hospital. Asian J Transfus Sci. 2012.
12. Garratty G, Glynn SA, McEntire R. ABO and Rh blood group distribution in different populations: implications for blood banking. Transfusion. 2004.