Compare The Predictive Value Of APACHE II And SAPS II Scores In Sepsis/ Septic Shock Patients Admitted To The Intensive Care Unit.
- Sathisha B , Consultant physician District government hospital (CMCRI) Chitradurga Karnataka.
- Divya ST , Senior Resident, Department Of General Medicine, Chitradurga Medical College And Research Institute (CMCRI) Chitradurga Karnataka.
Article Information:
Abstract:
Background: Sepsis is a critical medical condition characterized by the body's widespread immune reaction to an infection, which may result in severe organ failure and mortality. Objective of Our study is to compare the predictive value of APACHE II and SAPS II scores in sepsis/ septic shock patients who are admitted to Intensive care unit. Objective: To compare the predictive value of APACHE II and SAPS II scores in sepsis/ septic shock patients admitted to the Intensive care unit. Methods: This prospective observational study was conducted from August 2022 to November 2023 at Akash Institute of Medical Science & Research Center in Devanahalli Bengaluru rural, focusing on ICU patients over 18 years old. The study aimed to assess the accuracy of APACHE II and SAPS II in predicting mortality. A sample size of 114 was calculated using a stratified randomized sampling method, with a prevalence estimate of 17.5% and a 95% confidence interval. Result: In this prospective study of 114 ICU patients, significant differences were observed between survivors and non-survivors. APACHE II and SAPS II scores were significantly higher in non-survivors, with APACHE II showing a sensitivity of 88.9% and specificity of 66.7%, while SAPS II had a sensitivity of 86.1% and specificity of 61.9%, indicating these scoring systems' effectiveness in predicting mortality. Conclusion: Our study highlights significant difference in distribution of APACHE II and SAPA II scores between survivors and non- survivors with APACHE II has stronger relationship with survivors compared to SAPA II.
Keywords:
Article :
INTRODUCTION:
Prognostic scoring systems have several uses. They assist in predicting the prognosis of individual patients by decreasing ambiguity and provide a possibility for enhanced decision-making.1
The Acute Physiology and Chronic Health Evaluation II (APACHE II) scoring system is a useful tool for assessing the severity of sepsis in critically ill patients, comparing patient outcomes across different medical centers, and most importantly, predicting clinical outcomes and providing guidance to physicians in patient management. 2 APACHE II is derived from the original APACHE system and focuses on 12 frequently recorded physiological parameters. The selection of the 12 variables was based on clinical opinion about the measure's validity and specificity, the extent of coverage of essential organ systems, and the objectivity, reliability, and frequency of measurement.3 Prior research has shown a strong correlation between this score and the likelihood of death inside the hospital and within one month for patients in critical condition
The Simplified Acute Physiologic Score (SAPS II) is one of many scoring models used in this discipline. This model has a total of 17 variables, which include 12 physiologic characteristics, age, type of admission, and 3 variables related to underlying disorders. Some of these factors are awarded a score based on their presence or absence, whereas the 12 physiological variables are rated based on a range of values. The likelihood of death is then determined by a logistic regression analysis. The predictive validity of this model has been verified in several clinical scenarios.4,5,6
The comparison of predictive scoring systems revealed that although APACHE-II, APACHE-IV, SAPS-2, and MPM-III scores are effective in predicting death, none of these scoring systems demonstrate superiority over the others in predicting mortality for patients in internal medicine critical care units.7 Another study reported that both APACHE II and SAPS II demonstrated comparable efficacy in predicting the 1-month mortality of patients. The discriminatory abilities of the indicated models were satisfactory, but their calibration exhibited some degree of lack of fit, indicating that APACHE II and SAPS II are not entirely perfect.8
Thus this study is designed to compare APACHE II and SAPS II scoring system in prediction of mortality of sepsis patients in intensive care unit.
MATERIALS AND METHODS:
This Prospective observational study was conducted among patients more than 18 years who has been admitted to Intensive care unit in Akash Institute of Medical Science & Research center Devanahalli, Bengaluru rural. Duration of study was August 2022 to November 2023 (16 Months).
Source of data: It is a prospective study performed on patients more than 18 years who has been admitted in Intensive care unit of Akash Hospital and to assess the accuracy of APACHE II & SAPS II in prediction of mortality.
Sampling method: Stratified random sampling.
Inclusion Criteria:
1. All the patients >18 years.
2. Those who are willing to give consent.
3. Meeting the criteria for sepsis by sepsis-3 Guidelines 2021.
Exclusion Criteria:
1. Patients <18 years.
2. Those who are refusing to give consent.
3. Pregnant and lactating women are excluded.
4. Post-operative sepsis patients are excluded.
Method of Data Collection
After obtaining approval and clearance from the institutional ethics committee, the patients fulfilling the inclusion criteria will be enrolled for the study after obtaining informed consent.
Patients who were admitted to Intensive Care Unit of Akash Hospital either from emergency department or transferred from hospital ward diagnosed with sepsis/septic shock.
Patients who are meeting the SEPSIS-3 (2021) criteria for Sepsis\ Septic shock, were selected for this observational study according to inclusion and exclusion criteria. For each patients following data were obtained demographic data, admission diagnosis and comorbidities, they were subjected to routine blood tests like complete hemogram, renal function test, arterial blood gas, serum electrolytes and liver function test. APACHE II & SAPS II score were calculated to each patient. They were followed up for outcome in terms of recovery or mortality.
SAMPLE SIZE ESTIMATION
n= Z21- α/2 pq / d2 where,
Z 1- α/2 = Value of normal deviate at considered level of significance
p = Expected prevalence or proportion of the event in the study group.
d = Expected absolute allowable error in the p (10% relative allowable error as 105 of p)
Z 1- α/2 = 1.96 at confidence interval of 95 %
p = 17.5%
q = 2100- p= 100- 25= 75
d= 8%
n= (1.96)2 (25) (75) / (8)2
n= 114
Assessment tools: AP CHE II SAPS II
Investigations
CBC, RFT, LFT, ABG, Serum Electrolyte, urine culture and blood culture.
Statistical analysis: The data will be analyzed statistically using descriptive statistics namely mean, standard deviation, percentage whenever applicable. The data will be entered into Microsoft excel and SPSS version 25 will be used for statistical analysis. Categorical data will be expressed in the form of frequencies and chi square will be used for test of significance. Continuous data will be expressed in the form of mean and standard deviation. Student t-test will be used for statistically significance between the two groups (variables) p- value <=0.05 will be considered statistically significant.
RESULTS:
Most are aged 40-50 years (23.7%), followed by those aged 50-60 years (21.1%) and 60-70 years (17.5%). The 30-40 years and 70-80 years age groups each make up 12.3% of the total. A smaller proportion is aged 20-30 years (6.1%), and 80 years and above (7.0%).
The mean age of survivors is 52.97 years with a standard deviation of 14.75 years, whereas the mean age of non-survivors is slightly higher 54.88 years with a standard deviation of 19.365 years. This difference in age distribution between the two groups is statistically not significant, with a P value 0.555.
Table 1: Distribution of gender among the study participants (N=114)
|
Sl. No. |
Gender |
Survivor (n=72) |
Non survivor (n=42) |
X2 (df), p |
|
1 |
Male |
43 |
20 |
1,572 (1)
0.210 |
|
2 |
Female |
29 |
22 |
Among the survivors, 29 participants are female, while 22 participants of the non-survivors are female. Among males 43 are survivors and 20 are non survivors. This gender distribution difference is statistically not significant, with a chi-square value of 1.572 and a p-value of 0.210.
Table 2: Distribution of scores among the study participants (N=114)
|
Sl. No. |
Scores |
Survivor (n=72) |
Non survivor (n=42) |
p |
|
1 |
APACHE II |
14.795.25 |
25.797.43 |
<0.001 |
|
2 |
SAPS II |
39.018.95 |
55.7114.95 |
<0.001 |
APACHE II: The mean APACHE II score for survivors is 14.79 with a standard deviation of 5.25, while for non-survivors, the mean APACHE II score is significantly higher at 25.79 with a standard deviation of 7.43. The p-value is less than 0.001, indicating a statistically significant difference.
SAPS II: The mean SAPS II score for survivors is 39.01 with a standard deviation of 8.95, compared to a significantly higher mean SAPS II score of
55.71 with a standard deviation of 14.95 for non-survivors. The p-value is less than 0.001, indicating a highly significant difference.
Table 3: Comparison of APACHE II and SAPS II scores
|
Metric |
APACHE II Model |
SAPA II Model |
|
Overall Accuracy |
80.7% |
77.2% |
|
Sensitivity |
88.9% |
86.1% |
|
Specificity |
66.7% |
61.9% |
|
Odds Ratio |
1.299 |
1.149 |
|
Significance (p- value) |
<0.001 |
<0.001 |
APACHE II
· Overall Accuracy: 80.7%.
· Sensitivity (Survivors):
• Correctly identified 88.9% of survivors.
• Misclassified 8 survivors as non-survivors (False Negatives).
· Specificity (Non-Survivors):
• Correctly identified 66.7% of non-survivors.
• Misclassified 14 non-survivors as survivors (False Positives)
· The coefficient (B=0.262) is statistically significant (p<0.1).
· The odds ratio (Exp(B)=1.299) suggests that for each one-unit increase in APACHE II, the odds of survival increase by 29.9%.
· The confidence interval (1.183,1.426) does not include 1, confirming the predictor's significance.
SAPS II
· Overall Accuracy: 77.2%.
· Sensitivity ( Survivors):
• Correctly identified 86.1% of survivors.
• Misclassified 10 survivors as non-survivors (False Negatives).
· Specificity (Non-Survivors):
• Correctly identified 61.9% of non-survivors.
• Misclassified 16 non-survivors as survivors (False Positives)
· The coefficient (B=0.139B) is statistically significant (p<0.1).
· The odds ratio (Exp(B)=1.149) suggests that for each one-unit increase in SAPS II, the odds of survival increase by 14.9%.
· The confidence interval (1.086, 1.215) does not include 1, confirming the predictor's significance.
APACHE II Outperforms SAPA II:
The APACHE II model has higher overall accuracy, sensitivity, and specificity.
The odds ratio for APACHE II is larger, indicating a stronger relationship with survival compared to SAPS II.
SAPS II as a Predictor:
While SAPS II is a significant predictor, it shows a weaker impact on survival compared to APACHE II, as reflected by its lower odds ratio and classification accuracy.
|
Area Under the Curve |
|||||
|
Test Result Variable(s) |
Area |
Std. Errora |
Asymptotic Sig.b |
Asymptotic 95% Confidence Interval |
|
|
|
|
|
|
Lower Bound |
Upper Bound |
|
APACHE II SCORE |
.681 |
.053 |
.004 |
.577 |
.784 |
|
SAPSII SCORE |
.750 |
.060 |
.000 |
.633 |
.867 |
|
a. Under the nonparametric assumption |
|||||
|
b. Null hypothesis: true area = 0.5 |
|||||
DISCUSSION:
This study was conducted as prospective observational study in patients admitted with sepsis\ septic shock in the Intensive care unit of Akash Institute of Medical Science and Research Center, Devanahalli, Bengaluru Rural. The sample size was 114 patients. After getting the consent of the patients and their attending close relatives, the patients were subjected to history taking, physical examination and relevant laboratory testing and imaging. These were done to ascertain the presence of sepsis\ septic shock in the patient.
Sepsis is a major cause of mortality in India and worldwide. Hence a better understanding of its etiopathogenesis and the disease course is necessary. Further, the application of prognostication tools like APACHE II score and SAPS II score aid in assessing the prognosis and help the care givers in making improved decision.
APACHE II and SAPS II Scores
The mean APACHE II score for survivors in our study was 14.79 ± 5.25, significantly lower than the mean score of 25.79 ± 7.43 for non-survivors (P=<0.001). Similarly, the mean SAPS II score for survivors was 39.01 ± 8.95 significantly lower than the mean score of 55.71 ± 14.95 for non-survivors (P < 0.001). In Aminiahidashti et al8. study, mean APACHE II and SAPS II scores were 19.69 ± 8.91 and 42.85 ± 19.67, respectively, with significantly higher scores in non-survivors (P = 0.0007 and P < 0.0001, respectively).
Palavras ET al9. Reported mean APACHE II and SAPS II scores of 21.5 ± 7.3 vs. 25.8 ± 8.6 (P = 0.02) and 47.6 ± 14.7 vs. 59.1 ± 19.1 (P = 0.01), respectively,
Indicating significant differences.
Sensitivity and Specificity of Scores
APACHE II score has shown good correlation with several critical care states, including sepsis. Several studies have been conducted to compare its effectiveness against the other newly developed scoring systems like SOFA and the SAPS score. Some studies have supported APACHE II, some have supported SAPS II while others supports both.
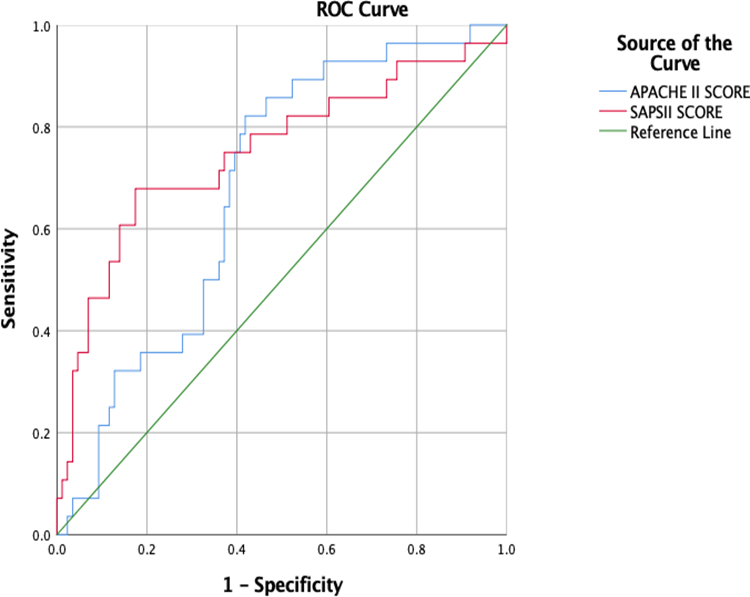
In our study, APACHE II had a sensitivity of 88.9% and specificity of 66.7%,The SAPS II score had a sensitivity of 86.1% and specificity of 61.9%. The APACHE II model has higher overall accuracy, sensitivity and specificity while SAPAII is also a significant predictor of mortality but shows weaker impact on survival compared to APACHE II. Hence in our study APACHE II outperforms SAPS II. Aminiahidashti et al8. reported an AUC of 0.75 for SAPS II and 0.72 for APACHE II, indicating good predictive value, although not significantly different from each other (P = 0.24).
Palavras et al9. Found SAPS II and APACHE II AUCs of 0.662 and 0.639, respectively, both showing good predictive value but with SAPS II being slightly more accurate. Godinjak et al10. Reported an AUC of 0.892 for SAPS II and 0.920 for APACHE II, with SAPS II having a sensitivity of 90.2% and specificity of 75.7%, and APACHE II having a sensitivity of 74.5% and specificity of 93.4%. Furquan et al11. Indicated that the APACHE II scoring system had highest sensitivity of 77.53%, specificity of 94.28% and accuracy of 85.45% in predicting mortality. The SAPS II scoring system showed sensitivity of 47.29%, specificity of 87.32% and accuracy of 66.23%, indicates that APACHE II scoring system is superior than SAPS II.
CONCLUSION:
Our study highlights significant differences in distribution of APACHE II and SAPS II scores between survivors and non-survivors in a critical care setting. Specifically, non-survivors had significantly higher APACHE II and SAPS II scores, indicating these score’s strong predictive value for mortality. Future research should focus on larger, multicenter studies to validate these findings and explore the impact of additional factors such as comorbidities and treatment interventions on patient outcomes.
REFERENCES:
1. Friedman G, Silva E, Vincent JL. Has the mortality of septic shock changed with time? Crit Care Med. 1998;26:2078-86.
2. Knaus WA, Draper EA, Wagner DP, Zimmerman JE. APACHE II: a severity of disease classification system. Critical care medicine. 1985;13(10):818–29.
3. Wagner DP, Draper EA. Acute physiology and chronic health evaluation (APACHE II) and Medicare reimbursement. Health care financing review. 1984 Nov;1984(Suppl):91.
4. Czorlich P, Sauvigny T, Ricklefs F, Kluge S, Vettorazzi E, Regelsberger J, et al. The simplified acute physiology score II to predict hospital mortality in aneurysmal subarachnoid hemorrhage. Acta neurochirurgica. 2015;157(12):2051–9.
5. Haddadi A, Ledmani M, Gainier M, Hubert H, De Micheaux PL. Comparing the APACHE II, SOFA, LOD, and SAPS II scores in patients who have developed a nosocomial infection. Bangladesh Critical Care Journal. 2014;2(1):4–9.
6. Gall L. A new simplified acute physiology score (SAPS II) based on a European/North American multicenter study. JAMA. 1994;271:1321.
7. Karagöz Özen DS, Kayabaş A, Demirdağ MD. Comparison of predictive scoring systems in patients hospitalized in the internal medicine intensive care unit. J Health Sci Med 2022; 5(6): 1639-1643.
8. Aminiahidashti H, Bozorgi F, Montazer SH, Baboli M, Firouzian A. Comparison of APACHE II and SAPS II scoring systems in prediction of critically ill patients’ outcome. Emergency. 2017;5(1).
9. Palavras MJ, Faria C, Cabral M, Santos F, Gonçalves J, Araújo A, Pereira L. Validez de APACHE II y SAPS II como predictores de mortalidad precoz ya los 3 meses en pacientes con sepsis. Galicia Clínica. 2021;82(3):139-41.
10. Godinjak A, Iglica A, Rama A, et al. Predictive value of SAPS II and APACHE II scoring systems for patient outcome in a medical intensive care unit. Acta Med Acad. 2016;45(2):97-103.
11. Furqan A, Naseer M, Tabassum R. Comparison of Sensitivity, Specificity and Accuracy of APACHE II, SAPS II and SOFA Scoring Systems as Predictors of Mortality in ICU Patients. P J M H S . 2021. 15(12): 3364-66.