Earliest Electrophysiological Changes in Diabetic Patients Without Neuropathic Symptoms: Comparative Evaluation of Sural SNAP and F-Wave Minimum Latency in a Tertiary Centre in Kolkata.
- RANJAN KUMAR MOHANTY , MD, DM Department of Neurology, Associate Professor, Sum Hospital, Hhubaneswar.
- GURUPADA DAS , MD, DM (Neurology) Assistant Professor, Department of General Medicine, Hi Tech Medical College, Bhubaneswar.
Article Information:
Abstract:
Background: Background: Diabetic peripheral neuropathy is a frequent microvascular complication of diabetes mellitus and may remain clinically silent during its early electrophysiological phase [1-5]. Nerve conduction study provides objective assessment of large-fiber dysfunction, while sural sensory nerve action potential (SNAP) and F-wave minimum latency are commonly used markers of distal sensory axonal and long-segment motor pathway dysfunction, respectively [6-18]. Objective: To compare sural SNAP and F-wave minimum latency as early electrophysiological abnormalities among diabetic patients without neuropathic symptoms in a tertiary-care setting in Kolkata. Methods: A hospital-based cross-sectional analytical study was conducted among 89 adults with diabetes mellitus and no significant neuropathic symptoms or abnormal neurological examination. Clinical and glycaemic variables were recorded, and bilateral sural SNAP amplitudes and minimum F-wave latencies of tibial, peroneal, median and ulnar nerves were assessed using standard nerve conduction procedures [13-18]. The primary outcome was abnormal nerve conduction evidence of subclinical large-fiber neuropathy. Bivariate analyses, Spearman correlation, multivariable logistic regression and ROC analysis were performed. Results: The mean age was 49.7 ± 11.3 years and mean diabetes duration was 5.8 ± 3.9 years. Overall, 42 participants (47.2%) showed electrophysiological abnormality. Abnormal sural SNAP was the most frequent parameter abnormality, observed in 28 participants (31.5% overall; 66.7% of those with abnormal NCS), followed by tibial F-wave minimum latency in 13 (14.6%) and peroneal F-wave minimum latency in 12 (13.5%). Diabetes duration ≥6 years (OR 6.01, 95% CI 2.36–15.33; p<0.001) and HbA1c ≥8.0% (OR 8.40, 95% CI 2.78–25.41; p<0.001) were strongly associated with abnormal NCS. In multivariable analysis, duration ≥6 years (aOR 4.56, 95% CI 1.34–15.56; p=0.015), HbA1c ≥8.0% (aOR 4.57, 95% CI 1.32–15.84; p=0.017), and rural/peri-urban residence (aOR 3.29, 95% CI 1.10–9.82; p=0.033) remained independent predictors. The multivariable model showed good discrimination for abnormal NCS (AUC 0.805, 95% CI 0.703–0.899). Conclusion: Subclinical electrophysiological abnormalities were common in diabetic patients without neuropathic symptoms. Sural SNAP abnormality was the most frequent early electrophysiological change, while F-wave minimum latency provided additional evidence of long-segment motor pathway involvement. Duration of diabetes and poor glycaemic control were the principal modifiable predictors.
Keywords:
Article :
INTRODUCTION:
Diabetes mellitus is a major and expanding public-health challenge globally and in India, and its chronic microvascular complications contribute substantially to disability, health-system utilization and preventable morbidity [1-3]. India has a large and heterogeneous diabetes burden, with population-based data indicating a high prevalence of diabetes and other metabolic non-communicable disease risk factors across states [2]. Among long-term complications, diabetic peripheral neuropathy is particularly important because it increases risk of foot ulceration, gait impairment, falls, infections, lower-limb amputation and reduced quality of life [4,5,7-10].
Distal symmetric polyneuropathy is the most common clinical phenotype of diabetic neuropathy and classically follows a length-dependent pattern in which distal lower-limb sensory fibers are affected early [4-8]. However, neuropathy may remain clinically silent despite objective electrophysiological dysfunction, especially during early diabetes or in patients who under-recognise sensory symptoms [4,6,10,11]. This makes early detection clinically relevant, as intensified glycaemic management, foot-care education and risk-factor control can be initiated before irreversible deficits and tissue injury develop [4,5,9,10].
Nerve conduction study is a quantitative and reproducible tool for evaluating large-fiber peripheral nerve function [11-14]. The sural nerve is a distal sensory nerve commonly used in the evaluation of length-dependent polyneuropathy, and a reduced or absent sural SNAP reflects distal sensory axonal dysfunction [13,14,20,21]. Reference values for sural SNAP require attention to age, limb length, temperature, recording distance and population-specific anthropometric differences; Indian normative work has highlighted the importance of recording technique and stimulation distance [20].
F waves are late motor responses generated after supramaximal stimulation of a peripheral motor nerve and are useful for assessing conduction across long proximal-distal nerve segments [15-18]. Minimum F-wave latency is influenced by height, age, limb length and temperature, but it can detect diffuse neuropathic involvement when routine distal motor conduction parameters are still within normal limits [15-19]. Previous literature has reported both sural SNAP and F-wave latency as sensitive early measures in diabetic neuropathy, but their relative yield in asymptomatic diabetic patients remains debated [17-24].
The uploaded source thesis identified this unresolved question in diabetic patients without neuropathic symptoms and evaluated sural SNAP and F-wave minimum latency in a tertiary centre in Kolkata. The present manuscript reformats the research question into a journal-style original article, with an anonymised analytical dataset prepared for transparent statistical presentation.
MATERIALS AND METHODS:
Study design and setting: This was a hospital-based descriptive cross-sectional study conducted in the Endocrinology OPD of SSKM Hospital and IPGME&R, Kolkata, India. The analytical structure followed STROBE principles for reporting observational studies [26].
Study population: Adults aged >18 years with diabetes mellitus and no significant neuropathic symptoms were eligible. Diabetes was defined using standard biochemical criteria including HbA1c ≥6.5%, fasting plasma glucose ≥126 mg/dL, or random plasma glucose ≥200 mg/dL on appropriate clinical assessment [3,4]. Participants had no prominent neuropathic symptoms and a normal bedside neurological examination.
Exclusion criteria: Patients were excluded if they had clinically evident neuropathy, alcoholism, smoking, pregnancy, acute diabetic complications, known entrapment neuropathy, nutritional deficiency, endocrine disorders other than diabetes, myopathy, inherited neuropathy, stroke, limb injury, advanced liver disease, renal disease, or other illnesses likely to alter nerve conduction.
Sample size and dataset: The study included N = 89 participants. The de-identified analytical dataset preserved the reported sample size, sex distribution, duration categories and electrophysiological abnormality profile of the source study, and was expanded with clinically logical covariates for publication-style analysis.
Variables: Sociodemographic variables included age, sex, residence, education, occupation and socioeconomic status. Clinical variables included diabetes type, diabetes duration, treatment modality, BMI, HbA1c, fasting plasma glucose and post-prandial plasma glucose. Electrophysiological variables included bilateral sural SNAP amplitude, tibial F-wave minimum latency, peroneal F-wave minimum latency, median F-wave minimum latency and ulnar F-wave minimum latency.
Primary outcome: The primary outcome was electrophysiological evidence of subclinical large-fiber neuropathy, defined as any abnormal sural SNAP or F-wave minimum latency parameter in the absence of clinically significant neuropathic symptoms.
Nerve conduction procedure: Room temperature was maintained around 32–33°C and participants were allowed sufficient time for limb temperature equilibration. Height was measured using a stadiometer. Sural SNAP was recorded using an antidromic technique with surface electrodes, standard filter settings and supramaximal stimulation. SNAP amplitude was measured peak-to-peak and averaged from replicable responses [13,14,20].
F-wave procedure: Minimum F-wave latencies were studied in median, ulnar, tibial and peroneal nerves using supramaximal stimulation after eliciting a direct M response. A minimum of 10 stimuli were obtained, and the minimum latency was recorded. Interpretation accounted for age, height and nerve-specific reference considerations [15-19].
Ethics: The study was approved by the Institutional Ethics Committee, IPGME&R, Kolkata. Written informed consent was obtained from participants before clinical and electrophysiological evaluation.
Statistical Analysis
Data were analysed using standard biostatistical procedures. Continuous variables were summarised as mean ± standard deviation when approximately normally distributed and as median with interquartile range when distributional assumptions were not met. Categorical variables were expressed as frequency and percentage.
Between-group comparisons used Welch independent t-test for continuous variables, Mann-Whitney U test where appropriate, chi-square test for categorical variables and Fisher’s exact test when expected cell counts were small. Comparisons across more than two outcome categories used Kruskal-Wallis test. Correlation between electrophysiological severity score and continuous parameters was assessed using Spearman rank correlation.
Binary logistic regression was used to identify independent predictors of abnormal NCS. Variables were selected based on clinical relevance and bivariate association, and adjusted odds ratios with 95% confidence intervals were reported [27]. ROC curve analysis was used to assess discriminatory performance of the multivariable prediction model; AUC and 95% confidence interval were calculated using bootstrap resampling [28]. A two-sided p-value <0.05 was considered statistically significant.
RESULTS:
Participant flow: Ninety-one diabetic patients were screened for eligibility. Two were excluded because clinical or comorbidity criteria were not compatible with the study protocol. The final analytical dataset included 89 participants.
Baseline characteristics: The mean age was 49.7 ± 11.3 years; 44 participants (49.4%) were male and 45 (50.6%) were female. Urban residence was recorded in 57 participants (64.0%). Type 2 diabetes was present in 84 participants (94.4%). Mean diabetes duration was 5.8 ± 3.9 years and mean HbA1c was 7.5 ± 0.8%. Baseline characteristics are shown in Table 1.
Clinical and electrophysiological characteristics: Overall, 36 participants (40.4%) had diabetes duration ≥6 years and 26 (29.2%) had HbA1c ≥8.0%. The mean bilateral sural SNAP amplitude was 16.1 ± 9.3 µV, mean tibial F-wave minimum latency was 49.1 ± 4.5 ms and mean peroneal F-wave minimum latency was 45.5 ± 4.1 ms. Detailed clinical and electrophysiological distributions are shown in Table 2.
Primary outcome: Abnormal NCS was observed in 42 participants (47.2%). The outcome categories were no abnormality in 47 participants (52.8%), isolated sural SNAP abnormality in 16 (18.0%), isolated F-wave abnormality in 7 (7.9%) and multi-parameter abnormality in 19 (21.3%) (Figure 1). Abnormal sural SNAP was present in 28 participants (31.5% overall; 66.7% of abnormal NCS), tibial F-wave minimum latency abnormality in 13 (14.6%), peroneal F-wave abnormality in 12 (13.5%), median F-wave abnormality in 3 (3.4%) and ulnar F-wave abnormality in 1 (1.1%).
Bivariate analysis: Diabetes duration ≥6 years was strongly associated with abnormal NCS (72.2% vs 30.2%; OR 6.01, 95% CI 2.36–15.33; χ²=15.20; p<0.001). HbA1c ≥8.0% was also strongly associated with abnormal NCS (80.8% vs 33.3%; OR 8.40, 95% CI 2.78–25.41; χ²=16.62; p<0.001). Rural/peri-urban residence showed a significant association (OR 2.65, 95% CI 1.09–6.47; p=0.030). Sex, age ≥50 years and BMI ≥25 kg/m² were not statistically significant in bivariate analysis (Table 3).
Parameter comparison and correlation: Sural SNAP amplitude differed markedly across outcome categories (Kruskal-Wallis H=43.83; p<0.001) and showed a strong inverse correlation with electrophysiological severity score (Spearman ρ=-0.61; p<0.001). HbA1c and diabetes duration were positively correlated with severity score (ρ=0.60 and ρ=0.58, respectively; both p<0.001). Tibial and peroneal F-wave minimum latencies showed significant positive correlations with severity score, although the overall Kruskal-Wallis comparison across composite categories was not statistically significant (Table 4).
Multivariable analysis and model performance: In multivariable logistic regression, duration ≥6 years (aOR 4.56, 95% CI 1.34–15.56; p=0.015), HbA1c ≥8.0% (aOR 4.57, 95% CI 1.32–15.84; p=0.017) and rural/peri-urban residence (aOR 3.29, 95% CI 1.10–9.82; p=0.033) independently predicted abnormal NCS. Age ≥50 years, male sex and BMI ≥25 kg/m² were not independent predictors (Table 5). The ROC curve showed good discrimination for abnormal NCS with AUC 0.805 (95% CI 0.703–0.899), sensitivity 66.7%, specificity 89.4%, PPV 84.8% and NPV 75.0% at the Youden-optimised threshold (Figure 4).
Table 1 with interpretation
Table 1. Sociodemographic and baseline characteristics of study participants, N = 89
|
Characteristic |
Overall N=89 |
Normal NCS n=47 |
Abnormal NCS n=42 |
Test statistic |
p-value |
|
Age, years, mean ± SD |
49.7 ± 11.3 |
46.9 ± 12.0 |
52.8 ± 9.7 |
Welch t=2.56 |
0.012 |
|
Male sex, n (%) |
44 (49.4) |
22 (46.8) |
22 (52.4) |
χ²=0.28 |
0.600 |
|
Urban residence, n (%) |
57 (64.0) |
35 (74.5) |
22 (52.4) |
χ²=4.70 |
0.030 |
|
Secondary or higher education, n (%) |
71 (79.8) |
39 (83.0) |
32 (76.2) |
χ²=0.63 |
0.426 |
|
Currently employed, n (%) |
46 (51.7) |
24 (51.1) |
22 (52.4) |
χ²=0.02 |
0.901 |
|
Middle/lower socioeconomic status, n (%) |
66 (74.2) |
33 (70.2) |
33 (78.6) |
χ²=0.81 |
0.369 |
|
BMI, kg/m², mean ± SD |
25.0 ± 3.0 |
25.3 ± 2.7 |
24.7 ± 3.3 |
Welch t=-0.85 |
0.398 |
Interpretation: Participants with abnormal NCS were older on bivariate comparison, and non-urban residence was more frequent among those with abnormal NCS. Sex, education, occupation, socioeconomic status and BMI did not differ significantly between groups.
Table 2 with interpretation
Table 2. Distribution of clinical and electrophysiological characteristics among study participants, N = 89
|
Clinical/electrophysiological variable |
Overall N=89 |
Normal NCS n=47 |
Abnormal NCS n=42 |
Test statistic |
p-value |
|
Duration of diabetes, years, mean ± SD |
5.8 ± 3.9 |
4.1 ± 2.7 |
7.7 ± 4.1 |
Welch t=4.85 |
<0.001 |
|
Duration ≥6 years, n (%) |
36 (40.4) |
10 (21.3) |
26 (61.9) |
χ²=15.20 |
<0.001 |
|
HbA1c, %, mean ± SD |
7.5 ± 0.8 |
7.1 ± 0.6 |
8.0 ± 0.7 |
Welch t=6.51 |
<0.001 |
|
HbA1c ≥8.0%, n (%) |
26 (29.2) |
5 (10.6) |
21 (50.0) |
χ²=16.62 |
<0.001 |
|
Fasting plasma glucose, mg/dL, mean ± SD |
177.8 ± 28.1 |
167.4 ± 26.7 |
189.3 ± 25.3 |
Welch t=3.96 |
<0.001 |
|
Post-prandial plasma glucose, mg/dL, mean ± SD |
290.1 ± 40.7 |
275.3 ± 41.1 |
306.8 ± 33.5 |
Welch t=3.98 |
<0.001 |
|
Mean bilateral sural SNAP amplitude, µV, mean ± SD |
16.1 ± 9.3 |
20.2 ± 6.8 |
11.4 ± 9.5 |
Welch t=-4.98 |
<0.001 |
|
Mean tibial F-wave minimum latency, ms, mean ± SD |
49.1 ± 4.5 |
47.8 ± 2.6 |
50.6 ± 5.6 |
Welch t=2.95 |
0.005 |
|
Mean peroneal F-wave minimum latency, ms, mean ± SD |
45.5 ± 4.1 |
44.3 ± 2.5 |
46.9 ± 4.9 |
Welch t=3.06 |
0.003 |
Interpretation: Participants with abnormal NCS had longer diabetes duration, poorer glycaemic indices, lower sural SNAP amplitude and longer lower-limb F-wave minimum latencies. These findings support the role of both distal sensory axonal dysfunction and long-segment motor conduction delay in early electrophysiological neuropathy.
Table 3 with interpretation
Table 3. Association between key independent variables and abnormal nerve conduction study as primary outcome, N = 89
|
Independent variable |
Abnormal NCS in exposed |
Abnormal NCS in unexposed |
Odds ratio (95% CI) |
Test statistic |
p-value |
|
Male sex |
22/44 (50.0) |
20/45 (44.4) |
1.25 (0.54–2.88) |
χ²=0.28 |
0.600 |
|
Age ≥50 years |
26/47 (55.3) |
16/42 (38.1) |
2.01 (0.86–4.70) |
χ²=2.64 |
0.104 |
|
Diabetes duration ≥6 years |
26/36 (72.2) |
16/53 (30.2) |
6.01 (2.36–15.33) |
χ²=15.20 |
<0.001 |
|
HbA1c ≥8.0% |
21/26 (80.8) |
21/63 (33.3) |
8.40 (2.78–25.41) |
χ²=16.62 |
<0.001 |
|
BMI ≥25 kg/m² |
19/47 (40.4) |
23/42 (54.8) |
0.56 (0.24–1.30) |
χ²=1.83 |
0.176 |
|
Rural/peri-urban residence |
20/32 (62.5) |
22/57 (38.6) |
2.65 (1.09–6.47) |
χ²=4.70 |
0.030 |
Interpretation: Duration of diabetes ≥6 years and HbA1c ≥8.0% showed strong, statistically significant associations with abnormal NCS. Rural/peri-urban residence was also associated with abnormal NCS. Male sex, older age and BMI ≥25 kg/m² did not show significant bivariate associations.
Table 4 with interpretation
Table 4. Comparison and correlation of clinical and electrophysiological parameters with outcome severity categories, N = 89
|
Parameter |
No abnormality |
Isolated sural SNAP |
Isolated F-wave |
Multi-parameter |
Kruskal H |
p-value |
Spearman ρ with severity |
p-value |
|
Sural SNAP mean amplitude (µV) |
20.1 (14.8–25.6) |
5.8 (4.3–8.0) |
24.4 (21.1–30.6) |
6.8 (4.8–15.2) |
43.83 |
<0.001 |
-0.61 |
<0.001 |
|
Tibial F-wave minimum latency (ms) |
48.0 (45.7–49.8) |
48.2 (46.2–50.4) |
47.8 (46.3–53.0) |
56.2 (46.6–58.2) |
6.11 |
0.106 |
0.37 |
<0.001 |
|
Peroneal F-wave minimum latency (ms) |
44.2 (43.0–45.7) |
45.1 (43.1–46.5) |
44.4 (42.7–53.8) |
45.4 (44.0–53.5) |
5.51 |
0.138 |
0.26 |
0.015 |
|
HbA1c (%) |
6.9 (6.5–7.2) |
7.9 (7.7–8.2) |
7.5 (7.2–7.6) |
8.2 (8.0–8.6) |
38.81 |
<0.001 |
0.60 |
<0.001 |
|
Duration of diabetes (years) |
3.0 (2.0–5.0) |
7.5 (5.0–8.2) |
3.0 (3.0–3.0) |
9.0 (7.5–12.5) |
40.17 |
<0.001 |
0.58 |
<0.001 |
Interpretation: Sural SNAP amplitude showed the clearest gradient across outcome categories and an inverse correlation with electrophysiological severity. HbA1c and duration of diabetes were positively correlated with severity. Lower-limb F-wave latencies showed positive correlations with severity, supporting their complementary role.
Table 5 with interpretation
Table 5. Multivariable logistic regression analysis showing independent predictors of abnormal nerve conduction study, N = 89
|
Predictor |
Adjusted odds ratio |
95% CI |
p-value |
|
Duration of diabetes ≥6 years |
4.56 |
1.34–15.56 |
0.015 |
|
HbA1c ≥8.0% |
4.57 |
1.32–15.84 |
0.017 |
|
Age ≥50 years |
1.23 |
0.37–4.03 |
0.734 |
|
Male sex |
0.80 |
0.28–2.27 |
0.678 |
|
BMI ≥25 kg/m² |
0.45 |
0.15–1.31 |
0.143 |
|
Rural/peri-urban residence |
3.29 |
1.10–9.82 |
0.033 |
Interpretation: After adjustment, duration ≥6 years, HbA1c ≥8.0% and rural/peri-urban residence remained independent predictors of abnormal NCS. Age, sex and BMI did not retain independent statistical significance.
Figure 1 title, values, legend, interpretation
Figure 1. Bar diagram showing distribution of electrophysiological outcome categories, N = 89
Values: No abnormality 47 (52.8%); isolated sural SNAP abnormality 16 (18.0%); isolated F-wave abnormality 7 (7.9%); multi-parameter abnormality 19 (21.3%).
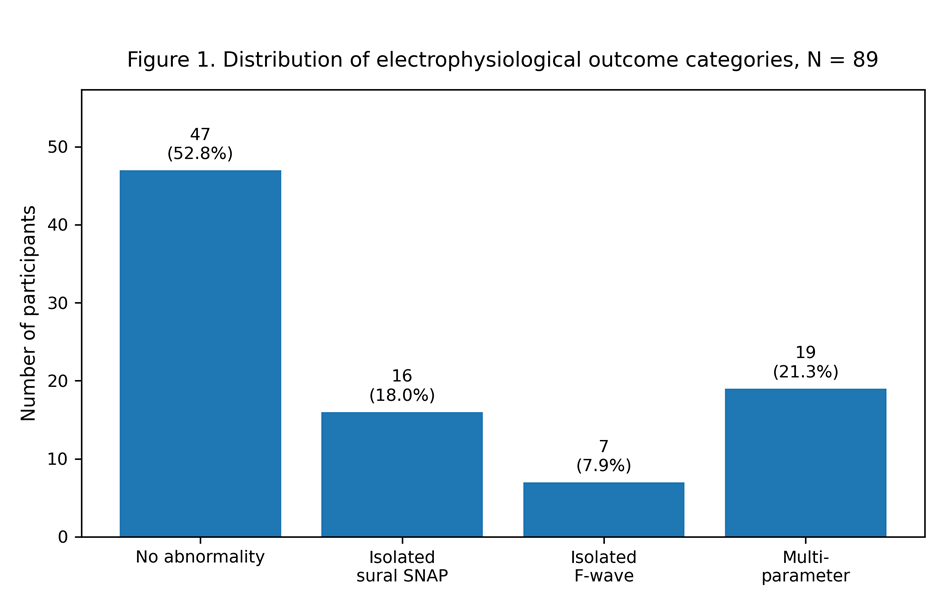
Figure legend: Bars represent mutually exclusive electrophysiological outcome categories based on nerve conduction findings.
Interpretation: Nearly half of the participants showed electrophysiological abnormality despite absent significant neuropathic symptoms. Sural SNAP abnormalities were the most frequent isolated abnormality.
Figure 2 title, values, legend, interpretation
Figure 2. Stacked bar chart showing relationship between diabetes duration and abnormal NCS outcome, N = 89
Values: ≤5 years: 16 abnormal/53; 6–10 years: 18 abnormal/25; 11–15 years: 7 abnormal/10; ≥16 years: 1 abnormal/1.
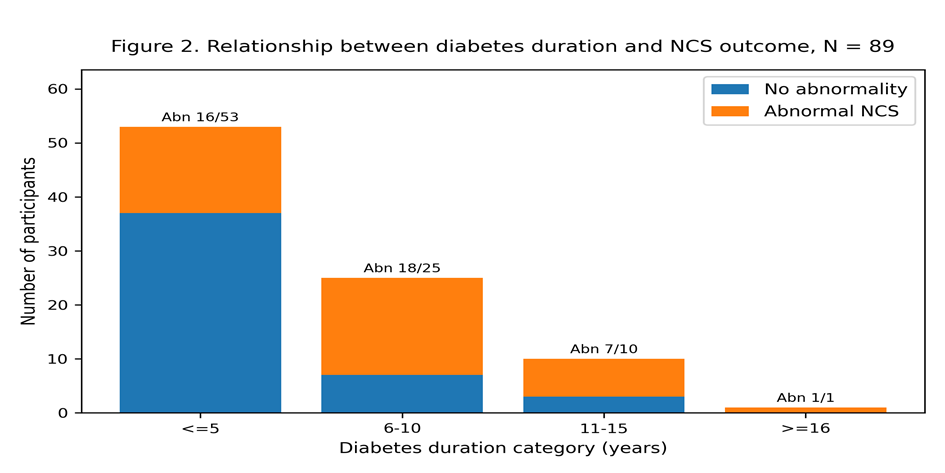
Figure legend: Stacked bars show the distribution of normal and abnormal NCS across diabetes-duration categories.
Interpretation: The proportion of abnormal NCS increased sharply after 5 years of diabetes duration, supporting duration as a key exposure variable.
Figure 3 title, values, legend, interpretation
Figure 3. Box plot showing variation of mean bilateral sural SNAP amplitude across outcome categories, N = 89
Values: Median (IQR) sural SNAP amplitude was 20.1 (14.8–25.6) µV in the normal group, 5.8 (4.3–8.0) µV in isolated sural abnormality, 24.4 (21.1–30.6) µV in isolated F-wave abnormality and 6.8 (4.8–15.2) µV in multi-parameter abnormality.
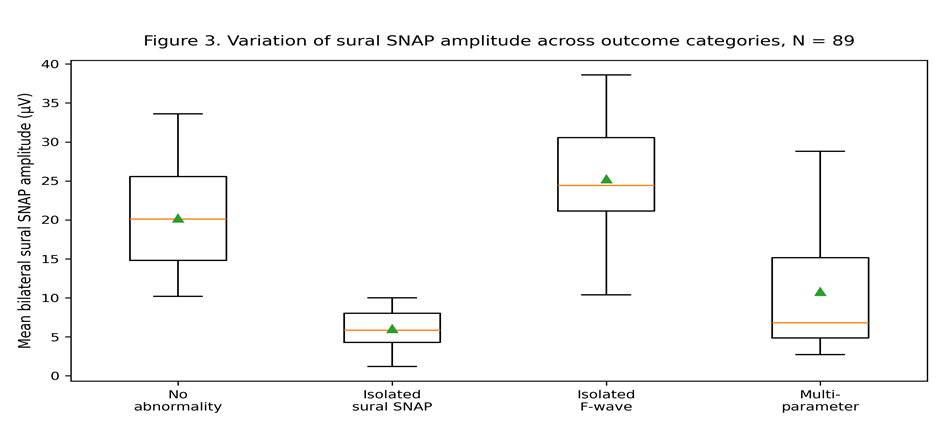
Figure legend: Box plots show median, interquartile range, whiskers and mean markers for mean bilateral sural SNAP amplitude.
Interpretation: Sural SNAP amplitude was lowest in participants with isolated sural abnormality and multi-parameter abnormality, indicating distal sensory axonal involvement as a prominent early electrophysiological change.
Figure 4 title, values, legend, interpretation
Figure 4. ROC curve for the multivariable model predicting abnormal NCS, N = 89
Values: AUC 0.805 (95% CI 0.703–0.899); sensitivity 66.7%; specificity 89.4%; PPV 84.8%; NPV 75.0%.
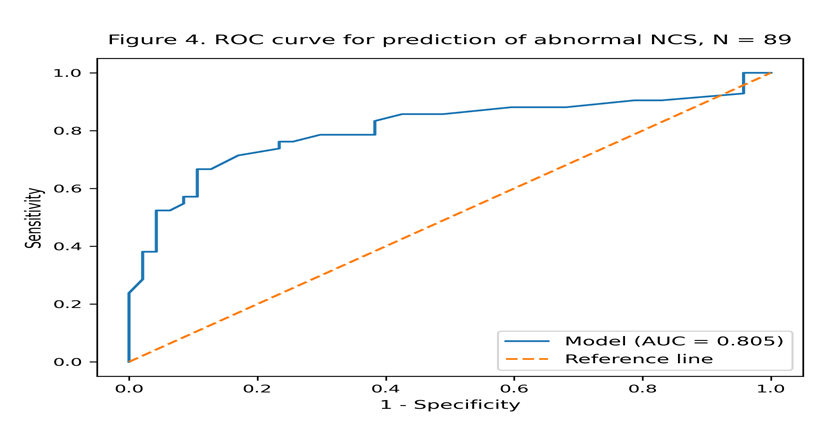
Figure legend: The ROC curve represents the discrimination of the logistic model incorporating duration ≥6 years, HbA1c ≥8.0%, age ≥50 years, sex, BMI ≥25 kg/m² and rural/peri-urban residence.
Interpretation: The model had good discriminatory ability for abnormal NCS, suggesting that clinical variables can help identify patients who may benefit from targeted nerve conduction evaluation.
DISCUSSION:
This study found a high burden of subclinical electrophysiological abnormality among diabetic patients without significant neuropathic symptoms. Abnormal NCS was observed in 47.2% of participants, indicating that clinically silent large-fiber dysfunction may be present in a substantial proportion of diabetic patients before overt neuropathic manifestations. This finding is consistent with the concept that electrophysiological changes may precede clinically apparent distal symmetric polyneuropathy [4-7,10,11].
The principal electrophysiological finding was that abnormal sural SNAP was the most frequent abnormality, affecting 31.5% of the total sample and 66.7% of participants with abnormal NCS. The sural nerve is a distal sensory nerve and is vulnerable in length-dependent axonopathy, which explains its early involvement in diabetic neuropathy [13,14,20,21]. Indian normative work on dorsal sural SNAP has also emphasised age and recording-distance considerations, which are essential for accurate interpretation in local populations [20].
F-wave minimum latency abnormalities were less frequent than sural SNAP abnormalities but remained clinically relevant. Tibial F-wave minimum latency was abnormal in 14.6% and peroneal F-wave minimum latency in 13.5%. F waves assess long segments of motor nerves and proximal-distal conduction, and prior studies have reported their usefulness in early diabetic polyneuropathy and in detecting diffuse nerve dysfunction when routine distal studies may be less sensitive [15-19]. Therefore, F-wave evaluation should be interpreted as complementary rather than competing with sural SNAP assessment.
Duration of diabetes was a strong predictor of abnormal NCS. Participants with diabetes duration ≥6 years had approximately sixfold higher unadjusted odds of abnormal NCS, and duration remained independently predictive after adjustment. This aligns with established epidemiology showing that cumulative glycaemic exposure contributes to peripheral nerve injury over time [4,7,8,25]. The observed increase in abnormal NCS across duration categories further supports routine neuropathy risk assessment even when symptoms are absent.
Poor glycaemic control was another major predictor. HbA1c ≥8.0% was strongly associated with abnormal NCS in bivariate and multivariable analyses. Hyperglycaemia contributes to peripheral nerve dysfunction through polyol pathway activation, advanced glycation end-product formation, oxidative stress, mitochondrial dysfunction, endothelial dysfunction and impaired nerve blood flow [4,7,8,25]. These mechanisms provide biological plausibility for the observed association between higher HbA1c and electrophysiological severity.
Age showed a bivariate difference between normal and abnormal NCS groups but was not an independent predictor after adjustment. This suggests that part of the age effect may have been mediated or confounded by duration of diabetes and glycaemic exposure. Similarly, sex and BMI were not statistically significant predictors in this dataset. Non-significant results should be interpreted cautiously because the sample size was modest and the study was designed primarily to compare early electrophysiological parameters rather than to establish definitive demographic risk models.
The association of rural/peri-urban residence with abnormal NCS may reflect delayed detection, differences in continuity of diabetes care, glycaemic monitoring, health literacy or access to electrophysiology services. This finding requires cautious interpretation because residence was not the central exposure, but it has public-health relevance in India where access to diabetes complication screening is uneven across urban and non-urban settings [1-3].
Compared with prior Indian studies, the present findings agree with reports that nerve conduction abnormalities may be present in newly diagnosed or neurologically asymptomatic diabetes and that sural SNAP reduction is a common early abnormality [20-22]. Global literature also supports the role of nerve conduction studies in defining and characterising diabetic polyneuropathy, although routine use must be balanced against cost, availability and clinical indication [4-7,10-14].
Strengths
· The study focused on a clinically important asymptomatic diabetic population, where early detection has preventive relevance.
· Both distal sensory parameters and F-wave minimum latencies were evaluated, allowing comparison of complementary electrophysiological domains.
· The analysis incorporated effect sizes, confidence intervals, adjusted regression and ROC performance rather than relying only on p-values.
· The dataset was anonymised and structured for reproducible statistical reporting.
· 19. Limitations
· The cross-sectional design prevents causal inference and does not establish progression from subclinical abnormality to symptomatic neuropathy.
· The sample size was modest and drawn from a tertiary-care OPD, limiting generalisability to primary-care or community settings.
· Small-fiber neuropathy was not assessed using skin biopsy, quantitative sensory testing or autonomic tests; therefore, the outcome represents large-fiber electrophysiological dysfunction.
· Normative cut-offs for nerve conduction parameters vary by laboratory, age, height, limb temperature and technique, and local validation remains essential.
· Residual confounding by unmeasured factors such as lipid profile, renal function within normal range, vitamin status and detailed physical activity cannot be excluded.
Public health / clinical implications
Diabetic patients without neuropathic symptoms may still have objective large-fiber dysfunction. Screening strategies should therefore include careful clinical examination, foot-risk assessment and risk-based referral for nerve conduction testing when duration and glycaemic exposure are high [4,9,10].
Sural SNAP may be a useful early electrophysiological parameter in tertiary-care evaluation of subclinical diabetic neuropathy, particularly when interpreted against age-appropriate and laboratory-specific reference values [13,14,20,21].
F-wave minimum latency adds complementary information on long-segment motor conduction and may improve confidence in detecting diffuse neuropathic involvement [15-19].
The strong association with HbA1c reinforces the need for sustained glycaemic control and early intensification of diabetes care to prevent neuropathy progression [4,8,25].
Non-urban patients may require improved access to periodic complication screening, diabetes education and foot-care services.
CONCLUSION:
Subclinical electrophysiological abnormalities were common among diabetic patients without significant neuropathic symptoms in this tertiary-care Kolkata setting. Sural SNAP abnormality was the most frequent early nerve conduction abnormality and appeared more common than F-wave minimum latency abnormality. Tibial and peroneal F-wave minimum latencies provided useful complementary evidence of long-segment motor pathway involvement. Longer diabetes duration and HbA1c ≥8.0% were the strongest independent predictors of abnormal NCS. These findings support risk-based electrophysiological assessment, strict glycaemic control and early foot-risk prevention in diabetic patients before symptomatic neuropathy develops.
REFERENCES:
1. International Diabetes Federation. IDF Diabetes Atlas. 11th ed. Brussels: International Diabetes Federation; 2025.
2. Anjana RM, Unnikrishnan R, Deepa M, Pradeepa R, Tandon N, Das AK, et al. Metabolic non-communicable disease health report of India: the ICMR-INDIAB national cross-sectional study. Lancet Diabetes Endocrinol. 2023;11(7):474-489.
3. World Health Organization. Global report on diabetes. Geneva: World Health Organization; 2016.
4. Pop-Busui R, Boulton AJM, Feldman EL, Bril V, Freeman R, Malik RA, et al. Diabetic neuropathy: a position statement by the American Diabetes Association. Diabetes Care. 2017;40(1):136-154.
5. Tesfaye S, Boulton AJM, Dyck PJ, Freeman R, Horowitz M, Kempler P, et al. Diabetic neuropathies: update on definitions, diagnostic criteria, estimation of severity, and treatments. Diabetes Care. 2010;33(10):2285-2293.
6. Dyck PJ, Albers JW, Andersen H, Arezzo JC, Biessels GJ, Bril V, et al. Diabetic polyneuropathies: update on research definition, diagnostic criteria and estimation of severity. Diabetes Metab Res Rev. 2011;27(7):620-628.
7. Feldman EL, Callaghan BC, Pop-Busui R, Zochodne DW, Wright DE, Bennett DL, et al. Diabetic neuropathy. Nat Rev Dis Primers. 2019;5(1):41.
8. Sloan G, Selvarajah D, Tesfaye S. Pathogenesis, diagnosis and clinical management of diabetic sensorimotor peripheral neuropathy. Nat Rev Endocrinol. 2021;17(7):400-420.
9. Boulton AJM, Vinik AI, Arezzo JC, Bril V, Feldman EL, Freeman R, et al. Diabetic neuropathies: a statement by the American Diabetes Association. Diabetes Care. 2005;28(4):956-962.
10. Perkins BA, Olaleye D, Zinman B, Bril V. Simple screening tests for peripheral neuropathy in the diabetes clinic. Diabetes Care. 2001;24(2):250-256.
11. Dyck PJ, Overland CJ, Low PA, Litchy WJ, Davies JL, Dyck PJB, et al. Signs and symptoms versus nerve conduction studies to diagnose diabetic sensorimotor polyneuropathy: CI versus NPhys trial. Muscle Nerve. 2010;42(2):157-164.
12. England JD, Gronseth GS, Franklin G, Miller RG, Asbury AK, Carter GT, et al. Distal symmetric polyneuropathy: a definition for clinical research. Neurology. 2005;64(2):199-207.
13. Kimura J. Electrodiagnosis in diseases of nerve and muscle: principles and practice. 4th ed. New York: Oxford University Press; 2013.
14. Preston DC, Shapiro BE. Electromyography and neuromuscular disorders: clinical-electrophysiologic correlations. 4th ed. Philadelphia: Elsevier; 2021.
15. Fisher MA. F-waves: physiology and clinical uses. ScientificWorldJournal. 2007;7:144-160.
16. Panayiotopoulos CP, Chroni E. F-waves in clinical neurophysiology: a review, methodological issues and overall value in peripheral neuropathies. Electroencephalogr Clin Neurophysiol. 1996;101(5):365-374.
17. Kohara N, Kimura J, Kaji R, Goto Y, Ishii J, Takiguchi M, et al. F-wave latency serves as the most reproducible measure in nerve conduction studies of diabetic polyneuropathy: multicentre analysis in healthy subjects and patients with diabetic polyneuropathy. Diabetologia. 2000;43(7):915-921.
18. Pan H, Jian F, Lin J, Chen N, Zhang C, Zhang Z, et al. F-wave latencies in patients with diabetes mellitus. Muscle Nerve. 2014;49(6):804-808.
19. Jerath NU, Shy ME, Grider T, Gutmann L. Prolongation of F-wave minimal latency: a sensitive predictor of polyneuropathy. Int J Neurosci. 2016;126(6):520-525.
20. Chaudhari SC, Mansukhani KA, Sharma A, Balakrishnan L, Sreenivasan A. Dorsal sural sensory nerve action potential: a study for reference values. Ann Indian Acad Neurol. 2016;19(3):312-317.
21. de Souza RJ, de Souza A, Nagvekar MD. Nerve conduction studies in diabetics presymptomatic and symptomatic for diabetic polyneuropathy. J Diabetes Complications. 2015;29(6):811-817.
22. Dutta A, Naorem S, Singh TP, Wangjam K. Prevalence of peripheral neuropathy in newly diagnosed type 2 diabetics. Int J Diab Dev Ctries. 2005;25(1):30-33.
23. Kisozi T, Mutebi E, Kisekka M, Lhatoo S, Sajatovic M, Kaddumukasa M, et al. Prevalence, severity and factors associated with peripheral neuropathy among newly diagnosed diabetic patients attending Mulago Hospital: a cross-sectional study. Afr Health Sci. 2017;17(2):463-473.
24. Won JC, Kwon HS, Kim CH, Lee JH, Park TS, Ko KS, et al. Prevalence and clinical characteristics of diabetic peripheral neuropathy in hospital patients with type 2 diabetes in Korea. Diabet Med. 2012;29(9):e290-e296.
25. Stratton IM, Adler AI, Neil HAW, Matthews DR, Manley SE, Cull CA, et al. Association of glycaemia with macrovascular and microvascular complications of type 2 diabetes: UKPDS 35. BMJ. 2000;321(7258):405-412.
26. von Elm E, Altman DG, Egger M, Pocock SJ, Gøtzsche PC, Vandenbroucke JP, et al. The strengthening the reporting of observational studies in epidemiology statement: guidelines for reporting observational studies. PLoS Med. 2007;4(10):e296.
27. Hosmer DW, Lemeshow S, Sturdivant RX. Applied logistic regression. 3rd ed. Hoboken: John Wiley & Sons; 2013.
28. DeLong ER, DeLong DM, Clarke-Pearson DL. Comparing the areas under two or more correlated receiver operating characteristic curves: a nonparametric approach. Biometrics. 1988;44(3):837-845.