Fetal Anterior Abdominal Wall Thickness and Standard Biometric Ultrasound Measurements for Predicting Fetal Macrosomia in Gestational Diabetes Mellitus: A Prospective Observational Study.
- Alka Agrawal , Professor and Head of Department , Department of Radiodiagnosis,MGMMC MYH indore M.P.
- Gaurav Bhandari , Assistant Professor, Department of Radiodiagnosis,MGMMC MYH indore M.P.
- Sharvan Punia , Junior Resident, Department of Radiodiagnosis,MGMMC MYH indore M.P.
- Devanshi Joshi , Junior Resident , Department of Radiodiagnosis,MGMMC MYH indore M.P.
Article Information:
Abstract:
Fetal macrosomia is one of the most important complications of gestational diabetes mellitus (GDM), contributing to shoulder dystocia, birth trauma and increased operative delivery. Conventional ultrasound biometry (biparietal diameter [BPD], head circumference [HC], abdominal circumference [AC], femur length [FL] and estimated fetal weight [EFW]) reflects skeletal size rather than fetal adiposity and has only moderate sensitivity (50-75%) for macrosomia. This study evaluated fetal anterior abdominal wall thickness (FAAWT), a direct marker of subcutaneous fat, alongside standard biometry, for predicting macrosomia in GDM pregnancies.This hospital-based, prospective observational study was conducted in the Department of Radiodiagnosis, M.G.M. Medical College and M.Y. Hospital, Indore, India, over one year after institutional ethics approval. 125 women with confirmed GDM in the third trimester (36-39 weeks) underwent ultrasonographic measurement of FAAWT (2-3 cm lateral to the umbilical cord insertion at the standard AC plane) together with BPD, HC, AC, FL and Hadlock-formula EFW. All parameters were correlated with actual neonatal birth weight and receiver operating characteristic (ROC) analysis was used to determine optimal cut-offs and diagnostic performance for macrosomia (birth weight ≥4000 g), including combined-parameter strategies.Macrosomia occurred in 22 of 125 pregnancies (17.6%). FAAWT and AC were significantly higher in macrosomic than non-macrosomic pregnancies (FAAWT 7.06 ± 0.89 vs 5.05 ± 0.53 mm; AC 364.59 ± 9.00 vs 337.96 ± 10.93 mm; both p<0.001), as was EFW and HC, whereas BPD and FL did not differ significantly. FAAWT showed the strongest correlation with birth weight among all parameters (r=0.758), closely followed by AC (r=0.780); EFW (r=0.621) and HC (r=0.479) correlated moderately, while BPD and FL showed weak, non-significant correlations. At a cut-off of ≥6.0 mm, FAAWT predicted macrosomia with sensitivity 86.4%, specificity 94.2%, PPV 76.0%, NPV 97.0% and AUC 0.962 (accuracy 92.8%); AC at ≥355 mm performed comparably (AUC 0.969, sensitivity 81.8%, specificity 95.1%). BPD and FL were poor predictors (AUC 0.565 and 0.553). Combining FAAWT and AC using an "either-positive" rule increased sensitivity to 95.5% (NPV 98.9%), while a "both-positive" rule achieved nearly 100% specificity (small sample size could be a limiting factor) and PPV.FAAWT is a simple, reproducible ultrasonographic marker that outperforms conventional skeletal biometry for predicting macrosomia in GDM pregnancies. Combined use of FAAWT with AC in routine third-trimester ultrasound can substantially improve antenatal risk stratification and support delivery planning.
Keywords:
Article :
INTRODUCTION:
Gestational diabetes mellitus (GDM) complicates 15-20% of pregnancies worldwide and the ICMR-INDIAB study reported a weighted national prevalence of 22.4% in India.1,2 Fetal macrosomia - defined as birth weight ≥4000 g irrespective of gestational age - is among the most important complications of GDM, occurring in 15-45% of diabetic pregnancies compared with roughly 10% of the general obstetric population3 and Indian studies report a prevalence of approximately 5-16%.4 Macrosomia is associated with shoulder dystocia, birth trauma including brachial plexus injury, postpartum haemorrhage, neonatal hypoglycaemia and a markedly higher rate of operative delivery.3.
Maternal hyperglycaemia drives fetal macrosomia through the Pedersen mechanism: transplacental glucose transfer stimulates fetal hyperinsulinemia, which preferentially promotes lipogenesis, protein synthesis and glycogen deposition in insulin-sensitive tissues - the liver, trunk and subcutaneous fat - while skeletal and cranial growth is relatively spared.3 Conventional ultrasound biometry (BPD, HC, AC, FL) and Hadlock-formula estimated fetal weight (EFW) predominantly capture skeletal dimensions and overall size and consequently have only moderate reported sensitivity (50-75%) for macrosomia in GDM pregnancies, with a mean EFW error of roughly 250-500gm.5 Even AC alone, despite a high positive predictive value near term, does not reliably outperform EFW when used in isolation.6.
In view of these limitations, fetal anterior abdominal wall thickness (FAAWT) - reflecting subcutaneous fat deposition driven by maternal glycaemic status - has emerged as a promising adiposity-specific marker.7,8 Prior studies have reported that FAAWT is significantly elevated in macrosomic fetuses of diabetic mothers and when combined with AC, improves the accuracy of macrosomia prediction beyond either parameter alone.7 However, most of this evidence derives from non-Indian cohorts and validation across South Asian GDM populations - who develop insulin resistance and fetal overgrowth even at lower maternal BMI - remains limited.9,10.
We therefore conducted this study to measure FAAWT and standard biometric ultrasound parameters in the third trimester (36-39 weeks) of GDM pregnancies, to correlate them with actual birth weight and to determine their individual and combined efficacy in predicting fetal macrosomia.
MATERIALS AND METHODS:
This was a hospital-based, time-bound, prospective observational study conducted in the Department of Radiodiagnosis, Mahatma Gandhi Memorial Medical College and M.Y. Hospital, Indore, Madhya Pradesh, India and associated hospitals, over a period of one year, after approval from the institutional scientific and ethics committee.
Participants. All pregnant women with gestational diabetes mellitus in the third trimester (36-39 weeks), with a singleton pregnancy and planned institutional delivery, who provided informed consent, were eligible. Women were excluded for maternal systemic disease, previous history of GDM, congenital fetal anomalies, obstetric complications (fetal IUGR, pre-eclampsia, hydrops, intrauterine fetal demise), placental abnormality, multiple pregnancy or lack of consent. A total of 125 women fulfilling these criteria were enrolled.
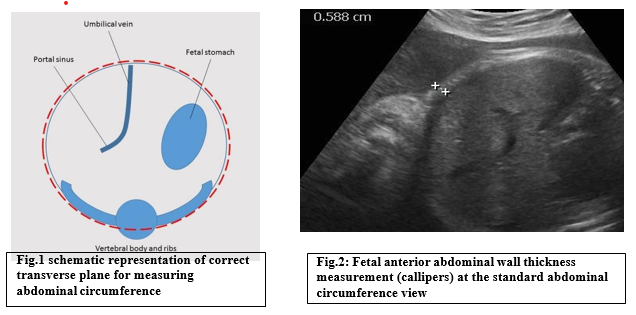
Ultrasound protocol. Following registration under the PC-PNDT Act, all participants underwent ultrasonographic evaluation using a 3-5 MHz curvilinear transducer. FAAWT was measured at the standard AC plane, approximately 2-3 cm lateral to the umbilical cord insertion, with calipers placed perpendicular to the fetal skin surface from the outer skin margin to the inner margin of the anterior abdominal wall musculature, including skin and subcutaneous tissue; the mean of repeated measurements was used for analysis. AC was measured in a true transverse plane at the level of the fetal stomach, umbilical vein and portal sinus, without maternal abdominal compression and without the kidneys, urinary bladder or cardiac structures in view, confirmed by symmetrical ribs. BPD, HC and FL were measured according to standard technique and EFW was calculated using the Hadlock formula from BPD, HC, AC and FL.
Outcome assessment. All participants were followed up until delivery and neonatal birth weight was recorded immediately after birth on the same digital weighing machine for all subjects. Neonates were categorised as macrosomic (birth weight ≥4000 gm) or non-macrosomic (<4000 gm).
Statistical analysis. Data were entered in Microsoft Excel and analysed using SPSS software. Continuous variables were expressed as mean +/- standard deviation and compared using independent t-tests; categorical variables were compared using chi-square tests. Pearson's correlation coefficient (r) was used to assess the association of each biometric parameter with actual birth weight. Receiver operating characteristic (ROC) curve analysis was performed for each parameter to determine the optimal cut-off, with corresponding sensitivity, specificity, positive predictive value (PPV), negative predictive value (NPV) and area under the curve (AUC). Combined-parameter ("either-positive"/"both-positive") strategies were also evaluated using 2x2 contingency tables. A p-value <0.05 was considered statistically significant.
RESULTS:
A total of 125 pregnant women with GDM in the third trimester (36-39 weeks) were enrolled. The mean maternal age was 27.29 +/- 5.45 years (range 18-42), with 75.2% of women aged ≤ 30 years. The mean BMI was 23.21 +/- 1.36 kg/m^2;. Primigravida and second-gravida women each accounted for 32.8% of the cohort (65.6% combined), with higher-order pregnancies less common. Third-trimester biometric parameters showed mean values of BPD 89.81 +/- 2.65 mm, HC 327.73 +/- 9.44 mm, AC 342.21 +/-14.70 mm, FL 73.43 +/- 3.20 mm and EFW 3242.18 +/- 418.3 g, consistent with normal late-pregnancy growth (Table 1).
Table 1: Baseline maternal characteristics and third-trimester fetal biometric parameters (N=125)
|
Parameter |
Value |
|
Mean maternal age, years (range) |
27.29 ± 5.45 (18–42) |
|
Age ≤30 years, n (%) |
94 (75.2) |
|
Mean BMI, kg/m² |
23.21 ± 1.36 |
|
Normal / Overweight / Obese BMI, % |
49.6 / 37.6 / 12.8 |
|
Primigravida + G2, n (%) |
82 (65.6) |
|
BPD (mm) |
89.81 ± 2.65 |
|
HC (mm) |
327.73 ± 9.44 |
|
AC (mm) |
342.21 ± 14.70 |
|
FL (mm) |
73.43 ± 3.20 |
|
EFW (g) |
3242.18 ± 418.3 |
Macrosomia (birth weight ≥4000 g) occurred in 22 of 125 pregnancies (17.6%), while 103 (82.4%) were non-macrosomic. Only 14 fetuses (11.2%) had an EFW ≥4000 g antenatally, whereas 25 (20.0%) had FAAWT ≥6 mm, indicating that FAAWT flagged a larger proportion of at-risk fetuses than EFW. Mode of delivery differed markedly by birth-weight category: macrosomic pregnancies had a lower rate of normal vaginal delivery (18.2%) and higher rates of assisted vaginal delivery (22.7%), elective caesarean section (22.7%) and emergency caesarean section (36.4%), compared with non-macrosomic pregnancies (51.5%, 2.9%, 31.1% and 14.6% respectively).
AC, HC, EFW and FAAWT were all significantly higher in macrosomic than non-macrosomic pregnancies, whereas BPD and FL showed no significant difference, consistent with the Pedersen hypothesis that fetal hyperinsulinemia preferentially drives adipose and visceral growth while sparing skeletal development (Table 2).
Table 2: Comparison of biometric parameters, FAAWT and birth weight — macrosomia vs non-macrosomia
|
Parameter |
Macrosomia (n=22) |
Non-macrosomia (n=103) |
p-value |
|
BPD (mm) |
90.55 |
89.65 |
0.151 (NS) |
|
HC (mm) |
337.18 ± 10.11 |
325.71 ± 7.99 |
<0.001 |
|
AC (mm) |
364.59 ± 9.00 |
337.96 ± 10.93 |
<0.001 |
|
FL (mm) |
73.68 |
73.33 |
0.642 (NS) |
|
EFW (g) |
3837.00 ± 302.74 |
3113.84 ± 317.65 |
<0.001 |
|
FAAWT (mm) |
7.06 ± 0.89 |
5.05 ± 0.53 |
<0.001 |
|
Birth weight (g) |
4244.32 |
3485.32 |
<0.001 |
A clear dose-response relationship was observed between FAAWT and macrosomia risk: 0% of fetuses with FAAWT 4.0-4.9 mm were macrosomic, rising to 13.6% at 5.0-5.9 mm, 53.8% at 6.0-6.9 mm and 100% at FAAWT ≥7.0 mm. Overall, 86.4% of macrosomic fetuses had FAAWT ≥6.0 mm (Table 3).
Table 3: Distribution of FAAWT values across macrosomia and non-macrosomia groups
|
FAAWT range (mm) |
Total (n=125) |
Macrosomia (n=22) |
Non-macrosomia (n=103) |
|
4.0–4.9 |
46 (36.8%) |
0 (0.0%) |
46 (44.7%) |
|
5.0–5.9 |
54 (43.2%) |
3 (13.6%) |
51 (49.5%) |
|
6.0–6.9 |
13 (10.4%) |
7 (31.8%) |
6 (5.8%) |
|
7.0–7.9 |
7 (5.6%) |
7 (31.8%) |
0 (0.0%) |
|
≥8.0 |
5 (4.0%) |
5 (22.7%) |
0 (0.0%) |
FAAWT and AC showed the strongest correlation with actual birth weight (r=0.758 and r=0.780 respectively, both p<0.001), followed by EFW (r=0.621) and HC (r=0.479); BPD and FL correlated weakly and non-significantly (Table 4).
Table 5: ROC-derived optimal cut-offs and diagnostic performance of individual parameters for predictingmacrosomia
|
Parameter |
Optimal cut-off |
Sensitivity (%) |
Specificity (%) |
PPV (%) |
NPV (%) |
AUC |
|
AC |
≥355 mm |
81.8 |
95.1 |
78.3 |
96.1 |
0.969 |
|
FAAWT |
≥6.0 mm |
86.4 |
94.2 |
76.0 |
97.0 |
0.962 |
|
EFW |
≥4000 g |
54.5 |
98.1 |
85.7 |
91.0 |
0.960 |
|
HC |
≥333 mm |
68.2 |
82.5 |
45.5 |
92.4 |
0.805 |
|
BPD |
≥92 mm |
36.4 |
80.6 |
28.6 |
85.6 |
0.565 |
|
FL |
≥74 mm |
54.5 |
59.2 |
22.2 |
85.9 |
0.553 |
Combined-parameter strategies further improved diagnostic performance. For FAAWT and AC, an "either-positive" rule (FAAWT ≥6 mm OR AC ≥355 mm) increased sensitivity to 95.5% with NPV 98.9%, missing only 1 of 22 macrosomic cases, while a "both-positive" rule (FAAWT ≥6 mm AND AC ≥355 mm) achieved 100% specificity and PPV, albeit with lower sensitivity (72.7%). Similarly, combining FAAWT with EFW using an "either-positive" rule achieved sensitivity 90.9%, specificity 93.2% and NPV 98.0% (Table 6).
Table 6: Diagnostic performance of combined-parameter strategies for predicting macrosomia
|
Strategy |
Sensitivity (%) |
Specificity (%) |
PPV (%) |
NPV (%) |
|
AC alone (≥355 mm) |
81.8 |
95.1 |
78.3 |
96.1 |
|
EFW alone (≥4000 g) |
54.5 |
98.1 |
85.7 |
91.0 |
|
AC + EFW (both positive) |
50.0 |
99.0 |
91.7 |
90.3 |
|
AC + EFW (either positive) |
86.4 |
94.2 |
76.0 |
97.0 |
|
FAAWT alone (≥6 mm) |
86.4 |
94.2 |
76.0 |
97.0 |
|
FAAWT + AC (both positive) |
72.7 |
100.0 |
100.0 |
94.5 |
|
FAAWT + AC (either positive) |
95.5 |
89.3 |
65.6 |
98.9 |
|
FAAWT + EFW (both positive) |
50.0 |
99.0 |
91.7 |
90.3 |
|
FAAWT + EFW (either positive) |
90.9 |
93.2 |
74.1 |
98.0 |
FIGURES AND LEGENDS
DISCUSSION:
Fetal macrosomia remains one of the most consequential complications of GDM, contributing to shoulder dystocia, birth trauma and increased operative delivery, yet its antenatal prediction using conventional biometry remains suboptimal because BPD, HC, AC, FL and EFW primarily capture skeletal dimensions rather than the disproportionate adiposity that characterises diabetic fetopathy.5.
This study evaluated FAAWT, a direct sonographic marker of subcutaneous fat, alongside standard biometry in 125 third-trimester GDM pregnancies.
The mean maternal age (27.29 +/- 5.45 years) and predominance of women ≤30 years mirror Indian data, including the ICMR-INDIAB study,2 and are consistent with the increasingly recognised pattern of GDM developing in younger, even lean, Indian women due to early-onset insulin resistance at lower BMI thresholds.9 Similarly, the mean BMI of 23.21 kg/m^2 in this cohort. The predominance of primigravida and second-gravida women (65.6%) further supports the case for universal third-trimester screening irrespective of parity.
The observed macrosomia prevalence of 17.6% falls within both the reported Indian range (5-16%)4 and the wider global range for diabetic pregnancies (15-45%),3 and is comparable to the rates reported by Bansal et al.16 in Indian GDM cohorts. Notably, EFW >=4000 g antenatally identified only 11.2% of cases, underscoring the limited sensitivity of EFW-based screening that has also been highlighted in Indian studies of ultrasound-estimated fetal weight.5,6 By contrast, FAAWT ≥6 mm was present in 20% of cases and a clear dose-response relationship was seen between FAAWT and macrosomia risk, from 0% at 4.0-4.9 mm to 100% at ≥7.0 mm, indicating that FAAWT flags at-risk fetuses that EFW alone would miss.
AC, HC, EFW and FAAWT were all significantly higher in macrosomic pregnancies, while BPD and FL were not, directly reflecting the Pedersen hypothesis that fetal hyperinsulinemia drives adipose and visceral overgrowth while sparing skeletal development.3 FAAWT showed the largest relative difference between groups (a 40% increase in macrosomic pregnancies) and together with AC, the strongest correlation with birth weight (r=0.758 and r=0.780 respectively), consistent with the findings of Higgins et al.7 in an Irish diabetic cohort and Garabedian et al.8 in pregestational diabetes, both of whom reported that soft-tissue and abdominal parameters outperformed cranial and skeletal measurements for predicting fetal overgrowth.
On ROC analysis, FAAWT (AUC 0.962, cut-off ≥6.0 mm) and AC (AUC 0.969, cut-off ≥355 mm) were the two strongest individual predictors, with FAAWT achieving marginally higher sensitivity (86.4% vs 81.8%) and identifying one additional macrosomic case. This 6.0 mm cut-off closely matches the values reported by Bansal et al.16,17 in Indian GDM cohorts (sensitivity 87.5%, NPV 96.9%) and is comparable to the gestation-specific cut-offs of Higgins et al.7 (3.5-5.5 mm across 30-36 weeks). EFW, despite a respectable AUC of 0.960, showed poor sensitivity (54.5%) at the conventional 4000 g threshold, consistent with reports by Nahum and Stanislaw26 and Ben-Haroush et al.27 that EFW functions better as a confirmatory than a screening tool in diabetic pregnancies. BPD and FL were the weakest predictors (AUC 0.565 and 0.553), in keeping with their role as skeletal rather than adiposity markers, as similarly reported by Stanirowski et al.15 and Dirisala Anudeep et al.19
Combining FAAWT with AC provided complementary diagnostic value: an "either-positive" rule maximised sensitivity (95.5%) and NPV (98.9%), missing only one macrosomic case and making it well suited to screening, while a "both-positive" rule achieved perfect specificity and PPV, supporting its use for confirmatory decision-making around delivery planning. Similar combined-parameter benefits have been reported by Higgins et al.7 who found that adding elevated FAAWT to AC >90th centile improved predictive accuracy from 70% to 88%, and by Lertvutivivat et al.10 who reported sensitivity above 90% for combined FAAWT-AC screening in GDM.
This study has limitations. The sample size was modest and the study was conducted at a single tertiary centre, which may limit generalisability. Measurements were obtained once in the late third rather than serially, precluding assessment of growth trajectory. Larger, multicentric studies with serial FAAWT measurement across gestation are needed to confirm these findings and support routine incorporation of FAAWT into third-trimester GDM ultrasound protocols.
In conclusion, FAAWT is a simple, reproducible ultrasonographic marker that directly reflects fetal adiposity and outperforms conventional skeletal biometry for predicting macrosomia in GDM pregnancies. Combined use of FAAWT with AC, particularly an "either-positive" screening strategy, can substantially improve antenatal risk stratification and merits inclusion in routine third-trimester ultrasound evaluation of GDM pregnancies to guide surveillance, glycaemic management and delivery planning.
REFERENCES:
1. Seshiah V, Balaji V, Balaji MS, Paneerselvam A, Arthi T, Thamizharasi M, et al. Prevalence of gestational diabetes mellitus in South India (Tamil Nadu) — a community-based study. J Assoc Physicians India. 2008;56:329–333.
2. Anjana RM, Deepa M, Pradeepa R, et al. (ICMR-INDIAB Collaborative Study Group). Prevalence of diabetes and prediabetes in 15 states of India: results from the ICMR-INDIAB population-based cross-sectional study. Lancet Diabetes Endocrinol. 2017;5(8):585–596.
3. Chauhan SP, Grobman WA, Gherman RA, et al. Suspicion and treatment of the macrosomic fetus: a review. Am J Obstet Gynecol. 2005;193(2):332–346.
4. Kalra P, Kachhwaha CP, Singh HV. Prevalence of gestational diabetes mellitus and its outcome in western Rajasthan. Indian J Endocrinol Metab. 2013;17(4):677–680.
5. Combs CA, Rosenn B, Miodovnik M, Siddiqi TA. Sonographic EFW and macrosomia: is there an optimum formula to predict diabetic fetal macrosomia? J Matern Fetal Med. 2000;9(1):55–61.
6. Sharma KA, Das D, Dadhwal V, Deka D, Vanamail P. Accuracy of ultrasound estimated fetal weight in predicting macrosomia in diabetic pregnancies. J Obstet Gynaecol India.
7. Higgins MF, Russell NM, Mulcahy CH, Coffey M, Foley ME, McAuliffe FM. Fetal anterior abdominal wall thickness in diabetic pregnancy. Eur J Obstet Gynecol Reprod Biol. 2008;140(1):43– 47
8. Garabedian C, Vambergue A, Salleron J, Deruelle P. Prediction of macrosomia by serial sonographic measurements of fetal soft-tissues and the liver in women with pregestational diabetes. Diabetes Metab. 2013;39(6):511–518.
9. Anjana RM, Pradeepa R, Deepa M, et al. Physical activity and inactivity patterns in India — results from the ICMR-INDIAB study. Diabetol Metab Syndr. 2014;6(1):1–12.
10. Lertvutivivat S, Titapant V, Boriboonhirunsarn D. Fetal anterior abdominal wall thickness to predict large for gestational age in gestational diabetes mellitus. J Med Assoc Thai. 2019;102(8):821–826.
11. Bhat RG, Nathan A, Amar R, Vasudeva A, Adiga P, Bhat PV, et al. Correlation of fetal abdominal subcutaneous tissue thickness by ultrasound to predict birth weight. J Clin Diagn Res. 2014;8(4):OC9–OC11.
12. Weschenfelder F, Schrey-Petersen S, Stepan H, et al. Fetal abdominal subcutaneous tissue measurement for monitoring gestational diabetes mellitus and fetal outcome. Arch Gynecol Obstet. 2020;302(6):1385–1393.
13. Stanirowski PJ, Duszewska AM, Dabrowska FA, Cendrowski K, Sawicki W. Ultrasound measurements of fetal soft tissue, heart, liver and umbilical cord as predictors of birth weight and macrosomia in pregnancies complicated by gestational and type 1 diabetes mellitus. J Perinat Med. 2021;49(2):230–239.
14. Bansal A, Nair S, Bhat RV. Role of fetal anterior abdominal wall thickness in predicting macrosomia in gestational diabetes: a prospective cohort study. J Obstet Gynaecol India. 2022;72(4):310–316.
15. Bansal A, Nair S, Bhat RV. Fetal anterior abdominal wall thickness and standard biometric parameters for predicting macrosomia in gestational diabetes mellitus. Indian J Radiol Imaging. 2023;33(2):145–151.
16. Smitha Mohan, Krishnapriya B, Anitha KR. Comparison of fetal abdominal subcutaneous tissue thickness with abdominal circumference in predicting large for gestational age in gestational diabetes mellitus. J Obstet Gynaecol India. 2024;74(1):22–28.
17. Dirisala Anudeep, Lakshmi Prasanna G, Sunitha K. Sonographic parameters for prediction of fetal macrosomia in gestational diabetes mellitus: role of umbilical cord thickness, fetal fat layer and interventricular septal thickness. Indian J Radiol Imaging. 2025;35(1):45–52.
18. Nahum GG, Stanislaw H. Ultrasonographic prediction of term birth weight: how accurate is it? Am J Obstet Gynecol. 2003;188(2):566–574.
19. Ben-Haroush A, Yogev Y, Hod M. Fetal weight estimation in diabetic pregnancies and suspected fetal macrosomia. J Perinat Med. 2004;32(2):113–121.