Blood Group Frequency among Blood Donors at a Blood Centre of a Tertiary Care Hospital in P.D.U. Medical College and Hospital, Rajkot.
- Dave Parth , Second Year Resident, Department of Pathology, PDU Medical College & Hospital, Rajkot, India
- Amit Agravat , Professor, Department of Pathology, PDU Medical College & Hospital, Rajkot, India
- Krupal Pujara , Assistant Professor, Department of Pathology, PDU Medical College & Hospital, Rajkot, India
- Gauravi Dhruva , Professor & Head, Department of Pathology, PDU Medical College & Hospital, Rajkot, India.
Article Information:
Abstract:
Background: Knowledge of the distribution of ABO and Rhesus (Rh) blood groups in a population is essential for effective blood bank management, donor recruitment, inventory control, and transfusion services. The prevalence of blood groups varies among different geographical regions and ethnic populations. AIM OF THE STUDY To determine the frequency and distribution of ABO and Rh blood groups among blood donors attending the blood centre of a tertiary care hospital in Western India.
Keywords:
Article :
INTRODUCTION:
The surface of red blood cells contains different polysaccharides and proteins called blood group antigens. A complete blood type describe a set of 30 substances on the surface of RBCs (red blood cells), and an individual’s blood type is one of many possible combinations of blood-group antigens.1 Across the 33 blood groups, over 600 different blood-group antigens have been found,2 part of them that are related to each other described into these blood group systems by the International Society of Blood Transfusion (ISBT), of which ABO and Rh groups system are the most important.3 The study of distribution of blood groups is important in blood transfusion, organ transplantation and some groups have shown associations with certain diseases like duodenal ulcer, gastric cancer, diabetes mellitus, urinary tract infection and ABO and Rh incompatibilities of newborn.4 Some blood groups can act as a receptor and ligand for bacteria, parasites and viruses. The possible pathogenesis for this susceptibility is that as many organisms that may bind to polysaccharide on cells and soluble antigens may block this binding.
MATERIALS AND METHODS:
A retrospective observational study was conducted at the blood centre of a tertiary care teaching hospital in P.D.U. Medical College and Hospital, Rajkot. Records of all eligible blood donors who donated blood during the study period were reviewed. ABO and Rh (D) blood grouping was performed using standard serological techniques according to departmental standard operating procedures. Data were analysed using descriptive statistics and expressed as frequencies and percentages.
Sample size:
The study included 22620 blood donors who donated blood at the blood centre of a tertiary care teaching hospital in P.D.U. Medical College and Hospital, Rajkot.During the study period. All eligible donors whose records were available in the blood bank database were included in the analysis. The study was conducted at the blood centre of a tertiary care teaching hospital located in Western India. The blood centre collects blood from both voluntary and replacement donors and performs routine blood grouping and screening procedures according to national guidelines.
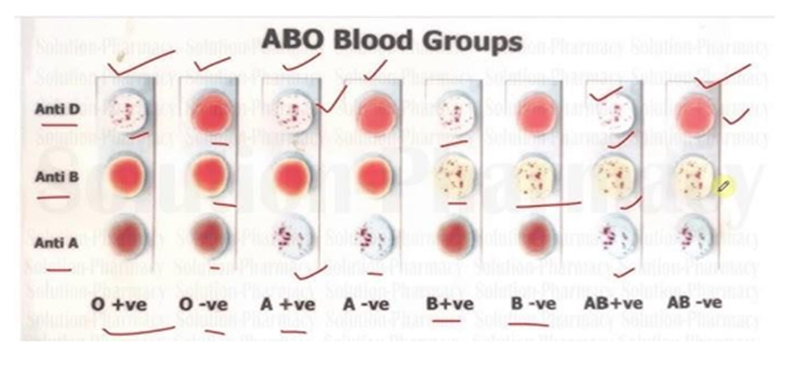
Method used for blood grouping of donor was slide method.
Inclusion criteria:
• All blood donors who donated blood during the may 2025-april 2026.
• Donors who fulfilled the eligibility criteria for blood donation as per institutional and national guidelines.
• Donors with complete records of ABO and Rh blood group typing. Exclusion criteria:
• Donors with incomplete or missing blood group records.
• Deferred donors who did not complete the donation process.
• Duplicate donor records, if identified during data verification.
RESULTS:
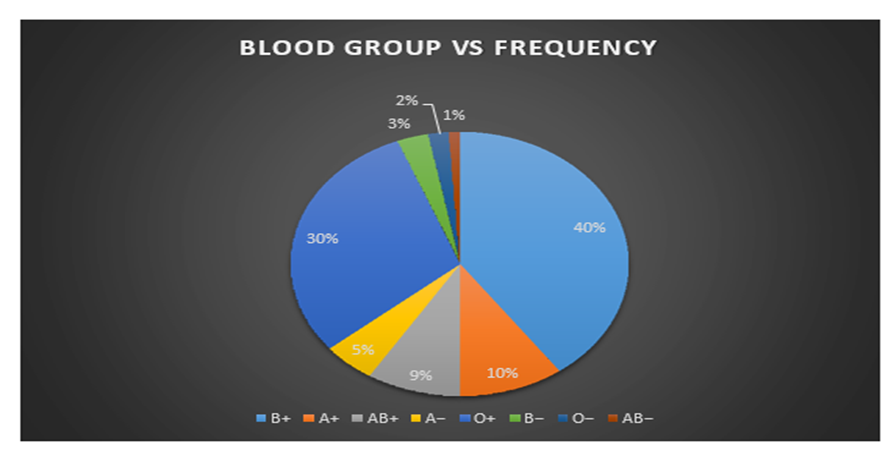
During the one-year study period, the distribution of ABO and Rh blood groups among blood donors was analyzed. Among the ABO blood groups, B positive was the most common blood group, accounting for 40% of donors, followed by O positive (30%), A positive (10%), and AB positive (9%). Rh-negative blood groups constituted 11% of the total donor population, with a negative accounting for a negative for 5%, B negative for 3%, O negative for 2%, and AB negative for 1%.
Overall, Rh-positive blood groups represented 89% of the donor population, while Rh-negative blood groups constituted 11%. The most prevalent blood group was O positive, whereas AB negative was the least common.
MONTH WISE FREQUENCY OF BLOOD GROUP
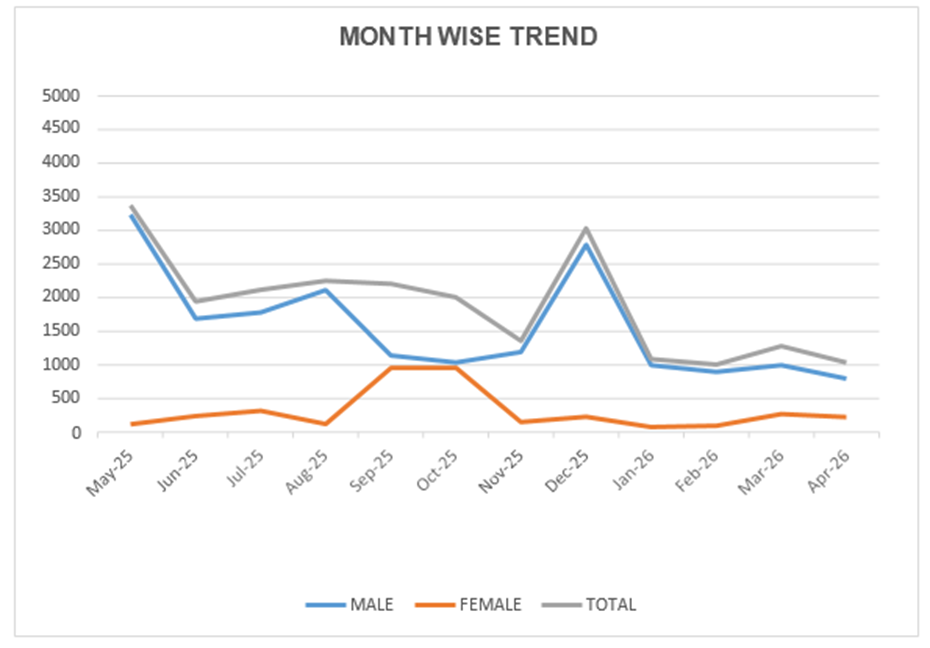
The line graph illustrates the month-wise distribution of male, female, and total cases from May 2025 to April 2026.
Overall, male cases consistently outnumber female cases throughout the study period, making the male population the major contributor to the total number of cases. Consequently, the total trend closely follows the male trend.
• May 2025 recorded the highest number of cases, with approximately 3,200 males, 100 females, and a total of about 3,350 cases.
• A sharp decline was observed in June 2025, after which the total cases remained relatively stable between July and October 2025.
• Male cases showed a gradual decline from August to October, while female cases increased markedly, reaching their highest level (around 950 cases) during September and October 2025.
• In November 2025, female cases declined considerably, whereas male cases showed a slight increase.
• A second major peak occurred in December 2025, with approximately 2,800 male cases, 200 female cases, and a total of around 3,000 cases.
• Following December, there was another sharp reduction in January 2026, after which the number of cases remained relatively low and stable through April 2026.
• During February to April 2026, male cases fluctuated between 800 and 1,000, female cases remained below 300, and total cases ranged from approximately 950 to 1,250.
• The lowest total number of cases was observed in February 2026 (around 1,000 cases), while the lowest male count occurred in April 2026, and the lowest female count was seen in January–February 2026.
AGE WISE DISTRIBUTION OF BLOOD GROUP
|
AGE GROUP (IN YEARS) |
MALE |
FEMALE |
TOTAL |
|
18-20 |
400 |
100 |
500 |
|
21-30 |
10000 |
2000 |
12000 |
|
31-40 |
7500 |
1500 |
9000 |
|
41-50 |
750 |
150 |
900 |
|
51-60 |
170 |
50 |
220 |
|
TOTAL |
18820 |
3800 |
22620 |
Table shows the age group and sex-wise distribution of 22,620 accepted blood donors. Of the total donors, 18,820 (83.2%) were males and 3,800 (16.8%) were females, indicating a marked male predominance with a male-to-female ratio of approximately 4.95:1.
The 21–30 years age group constituted the largest proportion of accepted donors, accounting for 12,000 (53.0%) of all donations. This group included 10,000 (83.3%) males and 2,000 (16.7%) females, making it the most active donor age group.
The 31–40 years age group was the second most common, contributing 9,000 donors (39.8%), comprising 7,500 males and 1,500 females. Together, the 21–40 years age groups accounted for 21,000 donors (92.8%), indicating that the majority of accepted blood donors belonged to the young and middle-aged adult population.
The 18–20 years age group contributed 500 donors (2.2%), including 400 males and 100 females. A considerably smaller number of donors were observed in the 41–50 years age group, with 900 donors (4.0%), of whom 750 were males and 150 were females.
The 51–60 years age group had the lowest number of accepted donors, contributing only 220 donors (1.0%), including 170 males and 50 females.
Across all age groups, male donors consistently outnumbered female donors, with males accounting for more than four-fifths of accepted donors in each category.
Overall, the findings demonstrate that blood donation was predominantly undertaken by young adults aged 21–40 years, while participation was comparatively low among adolescents (18–20 years) and older adults (41–60 years).
MONTH WISE REPLACEMENT AND VOLUNTARY BLOOD DONATION DATA
|
MONTH |
REPLACEMENT |
VOLUNTARY |
TOTAL |
|
May-25 |
523 |
2843 |
3366 |
|
Jun-25 |
343 |
1594 |
1937 |
|
Jul-25 |
416 |
1695 |
2111 |
|
Aug-25 |
374 |
1871 |
2245 |
|
Sep-25 |
331 |
1869 |
2200 |
|
Oct-25 |
424 |
1576 |
2000 |
|
Nov-25 |
490 |
861 |
1351 |
|
Dec-25 |
659 |
2368 |
3027 |
|
Jan-26 |
300 |
780 |
1080 |
|
Feb-26 |
280 |
720 |
1000 |
|
Mar-26 |
270 |
1003 |
1273 |
|
Apr-26 |
170 |
860 |
1030 |
|
Total |
4580 |
18040 |
22620 |
Table presents the month-wise distribution of replacement and voluntary blood donors from May 2025 to April 2026. During the study period, a total of 22,620 blood donations were recorded, of which 18,040 (79.8%) were from voluntary donors and 4,580 (20.2%) were from replacement donors. Thus, voluntary blood donation constituted the major source of blood collection throughout the study period.
The highest number of total donations was recorded in May 2025, with 3,366 donations (14.9%), comprising 2,843 voluntary and 523 replacement donations. This was followed by December 2025, which recorded 3,027 donations (13.4%), including 2,368 voluntary and 659 replacement donations. The lowest number of donations was observed in February 2026, with 1,000 donations (4.4%), followed by April 2026 (1,030; 4.6%) and January 2026 (1,080; 4.8%). Voluntary blood donation consistently exceeded replacement donation in every month. The highest number of voluntary donations was recorded in May 2025 (2,843), followed by December 2025 (2,368). The lowest voluntary donation count was observed in February 2026 (720).
Replacement donations showed comparatively smaller monthly variations. The highest number of replacement donations was recorded in December 2025 (659), followed by May 2025 (523) and November 2025 (490). The lowest replacement donation count was reported in April 2026 (170).
A noticeable decline in total donations occurred after May 2025, followed by moderate fluctuations between June and November 2025. A sharp increase was observed in December 2025, after which donations declined considerably during January to April 2026.
Overall, the findings demonstrate that voluntary blood donors were the predominant contributors to the blood supply, accounting for nearly four-fifths (79.8%) of all donations, whereas replacement donors contributed one-fifth (20.2%). The monthly trend also indicates two distinct peaks in blood donation activity during May 2025 and December 2025.
DISCUSSION:
The present study evaluated the distribution of ABO and Rh blood groups among blood donors over a one-year period. O positive was found to be the most common blood group (39%), followed by B positive (30%), A positive (11%), and AB positive (10%). Among Rh-negative blood groups, A negative was the most frequent (5%), while AB negative was the least common (1%).
The predominance of O positive and B positive blood groups observed in this study is consistent with reports from several regions of P.D.U. Medical College and Hospital. Rajkot. The high prevalence of Rh-positive blood groups highlights the need for maintaining adequate stocks of O positive and B positive blood units, while special attention should be given to the recruitment and retention of Rh-negative donors because of their relatively lower frequency.
Comparison of the study with different part of India includes:
The predominant donors belonged to age group between 18-35years (84.28%). Male donors were more than female donors, ratio being 352:1. Replacement donors (99.71%) were much more than voluntary donors (0.91%). The most common blood group was B (32.07%) and least common being AB (10.53%). Blood group ‘O’ and ‘A’ had same frequency. The prevalence of Rhesus positive and negative distribution in the studied population was 94.49% and 5.51% respectively. Blood group frequency with respect to ABO and Rhesus positive was found to be shown by formula B> O>A >AB. The frequency for ABO and Rhesus negative was given by the formula B>A>O>AB. (a study from a tertiary care teaching hospital of Kumaon region of Uttarakhand) Distribution of ABO and Rh-D blood groups among blood donors in a tertiary care centre in South India.
The distribution of ABO and Rh-D blood groups was studied among 150 536 blood donors screened at the Dr John Scudder Memorial Blood Bank, Christian Medical College Hospital, Vellore, over a period of 11 years (April 1988 to March 1999). The most common blood group was found to be group O [58 330 (38.75%)], followed by group B [49 202 (32.69%)], and group A [28 372 (18.85%)]. The least common blood group was AB group [7930 (5.27%)]. A2 or A2B groups were found in 3.01% and 1.43% of donors, respectively. The prevalence of Rh-D negative group was found in 8225 (5.47%) donors. Bombay group (H negative non-secretor, genotype hh phenotype Oh) was found in six donors (0.004%). Although the incidence of Rh-D negative group was identical to previously published data from North India, the most common blood group was O group in our study as opposed to B group.
Sanagapati PR, Vujhini SK. ABO and Rh-D blood group frequency and distribution: a tertiary care hospital experience. International Journal of Research in Medical Sciences. 2015; 3(1):240–243. DOI: 10.18203/2320-6012.ijrms20150327. This retrospective study of 1,740 blood donors at a tertiary care hospital found O as the most common ABO blood group, with Rh-positive predominating.
COMPARISON WITH OTHER STUDIES
Data compares the findings of the present study (2026) with previously published studies from different regions regarding the distribution of ABO blood groups. The present study, conducted in Rajkot, Gujarat, India, included 22,620 blood donors and found O positive to be the most common blood group.
The findings are consistent with the large multicentric study by Gopal Patidar et al. (2021), which analyzed 1,429,996 blood donors across 23 states of India and also reported O positive as the predominant blood group. Similarly, Kassahun et al. (2015) from Ethiopia studied 4,410 individuals and found O positive to be the most frequently occurring blood group, indicating that O positive is the predominant blood group in several geographically diverse populations.
In contrast, P. Patel et al. (2011) from Western Ahmedabad, India, with a sample size of 5,316, and J. Ayub et al. (2008) from Swat, Pakistan, with 22,897 participants, reported B positive as the most common blood group. These differences may be attributed to regional, ethnic, genetic, and demographic variations in blood group distribution.
.Likewise, Jaff et al. (2010) from Iraq reported that O positive was the most frequently occurring blood group among more than 53,000 individuals. Studies from Saudi Arabia by Bashwari et al. (2001) also demonstrated the predominance of O positive among blood donors. More recently, a large population-based study from China, published in Heliyon (2022), analyzed over 23 million individuals and confirmed that O positive remained the most common blood group, emphasizing its global predominance.
Overall, the comparison demonstrates that although O positive is the predominant blood group in the present study and many national and international studies, certain populations, particularly in western India and Pakistan, exhibit a higher prevalence of B positive blood group. These findings highlight the influence of geographical and ethnic diversity on ABO blood group distribution and emphasize the importance of regional blood group data for effective blood bank inventory management and transfusion services.
CONCLUSION:
The study demonstrated that O positive (39%) was the most prevalent blood group among blood donors, followed by B positive (30%). AB negative (1%) was the least common blood group. Rh-positive blood groups constituted the majority of the donor population. Knowledge of blood group distribution is useful for effective donor recruitment, inventory management, and planning of transfusion services in tertiary care hospitals.
REFERENCES:
1. Gajjar MD, Adulkar D, Bhatnagar N, et al. Frequency of ABO and Rh blood groups in blood donors: A study from a tertiary care teaching hospital in India.
2. Raja KA, Dobariya GH, Unagar CA, et al. Frequency and distribution of ABO and Rh blood groups among blood donors in a tertiary care hospital of South Gujarat, India.
3. Sanagapati PR, Vujhini SK. ABO and Rh-D blood group frequency and distribution: A tertiary care hospital experience.
4. Pavithra P, Mamatha SV, Muralidhara V. Distribution of ABO and Rh blood groups in a tertiary care hospital blood bank.
5. Gerald L, Douglas M. Principles and practice of infectious disease. 5th ed. Churchill; 2000; 1-39. 6. Ahmad J, Taj AS, Rahim A, Shah A, Rehman M. Frequency of Hepatitis B and Hepatitis C in healthy blood donors of NWFP: a single center experience. J Postgrad Med Inst. 2004; 18:343-52.