Relationship Between APOE Gene Polymorphism and Dyslipidaemia in Patients with Coronary Artery Disease: A Cross-Sectional Study
- Doddappa Mallappa Bannigida , Assistant Professor, Department of Biochemistry, S R Patil Medical College, Hospital and Research Center, Badagandi, Karnataka, India
- Vijayashree Shivappa Neeravari , Associate Professor, Department of Pathology, Koppal Institute of Medical Science, Koppal, Karnataka, India
- Aruna Chowdappa , Assistant Professor, Department of Microbiology, S R Patil Medical College, Hospital and Research Center, Badagandi, Karnataka, India
Article Information:
Abstract:
Background: Apolipoprotein E (APOE) plays an important role in lipid transport and lipoprotein clearance. Genetic variation in APOE may therefore influence lipid abnormalities among individuals with coronary artery disease (CAD). This study examined the relationship between APOE genotypes, serum lipid concentrations, and dyslipidaemia in adults with documented CAD. Methods: A hospital-based cross-sectional study was carried out among 360 adults with confirmed CAD. Fasting serum lipid concentrations were estimated using enzymatic methods. APOE genotyping was performed using polymerase chain reaction-restriction fragment length polymorphism. Dyslipidaemia was defined according to established lipid cut-off values. Statistical analysis was conducted using SPSS version 28. Results: The ε3/ε3 genotype was the most common, accounting for 70.8% of participants, followed by ε3/ε4 at 16.1%. The frequencies of the ε2, ε3, and ε4 alleles were 6.1%, 83.2%, and 10.7%, respectively. Genotype distribution did not differ significantly from Hardy-Weinberg equilibrium (p=0.134). Mean LDL cholesterol increased from 99.0±22.0 mg/dL in the ε2 phenotype to 115.5±24.1 mg/dL in the ε3/ε3 group and 133.2±24.6 mg/dL in the ε4 phenotype group (p<0.001). Dyslipidaemia was present in 35.3% of participants with the ε2 phenotype, 63.1% of those with ε3/ε3, and 79.7% of those with the ε4 phenotype (χ²=19.13, p<0.001). Multivariable analysis showed that ε4 carriage (adjusted odds ratio [aOR] 2.57, 95% confidence interval [CI] 1.33-4.96) and diabetes mellitus (aOR 3.95, 95% CI 2.16-7.20) were independently associated with dyslipidaemia. Conclusion: Among adults with CAD, APOE ε4 carriage was associated with higher LDL cholesterol concentrations and a greater likelihood of dyslipidaemia. In contrast, ε2 carriage was associated with a comparatively favourable lipid profile.
Keywords:
Article :
INTRODUCTION:
Coronary artery disease remains one of the leading causes of premature death and chronic disability in India. Its development is influenced by a complex interaction of non-modifiable factors, such as age and genetic predisposition, and modifiable exposures, including tobacco use, diabetes mellitus, hypertension, obesity, unhealthy dietary practices and physical inactivity. Among these determinants, dyslipidaemia has a particularly important role because elevated concentrations of atherogenic lipoproteins accelerate cholesterol accumulation within the arterial wall, promote endothelial dysfunction and sustain the inflammatory processes that contribute to atherosclerotic plaque formation. Population-based studies from India have shown that abnormal lipid profiles are widely prevalent in both urban and rural communities and may become evident from early adulthood [1,2].
Apolipoprotein E (apoE) is a 299-amino-acid glycoprotein involved in lipid transport and the receptor-mediated clearance of triglyceride-rich lipoprotein remnants. It serves as an important ligand for hepatic uptake of chylomicron remnants, very-low-density lipoproteins and intermediate-density lipoproteins. The APOE gene is located on chromosome 19q13.2. Two common coding single-nucleotide variants, rs429358 and rs7412, give rise to the three principal alleles, ε2, ε3 and ε4. Their different combinations produce six major genotypes: ε2/ε2, ε2/ε3, ε2/ε4, ε3/ε3, ε3/ε4 and ε4/ε4. The corresponding apoE isoforms differ in the amino acids present at positions 112 and 158, resulting in variations in receptor affinity, lipid binding and lipoprotein metabolism [3,4].
The ε3 allele is the most prevalent form in most populations and is commonly used as the reference allele in genetic association studies. The ε2 isoform binds less efficiently to hepatic lipoprotein receptors and is often associated with lower concentrations of low-density lipoprotein cholesterol. However, individuals who are homozygous for ε2 may, in the presence of additional metabolic or environmental factors, develop type III hyperlipoproteinaemia because of impaired clearance of remnant particles. The ε4 isoform, by contrast, has frequently been linked to higher total cholesterol and low-density lipoprotein cholesterol concentrations, altered metabolism of remnant lipoproteins and an increased susceptibility to atherosclerotic cardiovascular disease [3-6].
Evidence from pooled analyses and large population studies suggests a graded relationship between APOE genotype, circulating lipid concentrations and coronary risk. In general, ε2 carriers tend to have lower low-density lipoprotein cholesterol than individuals with the ε3/ε3 genotype, whereas ε4 carriers often exhibit higher concentrations. The magnitude of this effect, however, is not uniform across all populations. Ethnic background, dietary pattern, age, sex, metabolic status, medication use and the prevalence of associated conditions may modify the phenotypic expression of APOE variants [5-8].
Studies conducted in Asian and South Asian populations have largely supported an association between the ε4 allele and an adverse lipid profile or increased coronary artery disease risk, although the findings have not been entirely consistent. Investigations involving populations from Kashmir, South Asian cohorts with diabetes and several Chinese groups have reported higher low-density lipoprotein cholesterol concentrations or a greater burden of coronary disease among ε4 carriers. In some studies, however, the strength of the association was reduced after accounting for statin therapy, diabetes, obesity, sample size or underlying population structure [9-14].
The assessment of APOE-related lipid differences becomes more complex in patients with established coronary artery disease. Most such patients receive lipid-lowering treatment, modify their diet or alter other lifestyle behaviours after diagnosis. Acute coronary events and systemic inflammation may also temporarily affect circulating lipid concentrations. Consequently, a lipid profile measured at the time of enrolment may not fully represent the patient’s untreated metabolic state. Nevertheless, examining APOE variants in this clinical population may provide insight into the biological factors contributing to differences in lipid levels, residual dyslipidaemia and variation in treatment response.
APOE genotyping is not intended to replace routine lipid estimation or established cardiovascular risk assessment. Its potential value lies in explaining part of the inter-individual variability in lipid metabolism that cannot be attributed solely to conventional risk factors. Such information may also contribute to a better understanding of why some patients continue to have an unfavourable lipid profile despite receiving standard therapy. However, evidence from Karnataka remains limited, particularly among adults with confirmed coronary artery disease attending tertiary teaching hospitals.
Against this background, the present study was undertaken to investigate the association between APOE gene polymorphism and dyslipidaemia in adults with documented coronary artery disease. The study assessed the distribution of APOE genotypes and allele frequencies, compared fasting lipid parameters among the major APOE phenotype groups and determined the prevalence and pattern of dyslipidaemia within each group. It further examined whether carriage of the ε2 or ε4 allele was independently associated with dyslipidaemia after adjustment for demographic characteristics, metabolic risk factors, comorbid conditions and the use of lipid-lowering medication.
MATERIALS AND METHODS:
Study design, setting and duration
A hospital-based cross-sectional study was conducted among eligible participants attending the study centre during the defined study period from April 2025 to March 2026. Data were collected using a structured protocol based on predefined clinical and demographic variables and were analysed according to the specified statistical methods.
Study population
Adults aged 30-80 years with documented CAD were eligible. CAD was defined by a previous myocardial infarction, prior percutaneous or surgical coronary revascularisation, or coronary angiography demonstrating at least 50% luminal narrowing in one or more major epicardial vessels. Patients with severe hepatic dysfunction, nephrotic syndrome, untreated thyroid disease, active infection, malignancy, pregnancy, current lipid-altering drugs other than statins or ezetimibe, recent blood transfusion, or inadequate DNA quality were excluded. Consecutive eligible patients were approached during outpatient review or hospital admission.
Sample size and sampling
The sample size was estimated using a single-proportion formula with an anticipated dyslipidaemia prevalence of 50%, 95% confidence level and 5.5% absolute precision. The minimum estimate was approximately 318 participants. After allowing for incomplete biochemical or genotyping data, the target was increased to 350.
Clinical assessment
A structured case record form was used to document age, sex, diabetes, hypertension, tobacco use, family history of premature CAD, clinical presentation, prior revascularisation and current lipid-lowering therapy. Diabetes was defined by a documented diagnosis, use of glucose-lowering medication or laboratory values meeting accepted diagnostic criteria. Hypertension was recorded when previously diagnosed, treated, or when repeated blood pressure measurements were at least 140/90 mmHg. Current smoking referred to tobacco use within the preceding 30 days. Angiographic disease involving two or more major coronary vessels was classified as multivessel CAD.
Anthropometry and sample collection
Body weight was recorded to the nearest 0.1 kg using a calibrated digital scale, and standing height was measured to the nearest 0.1 cm. Body mass index was calculated as weight in kilograms divided by height in metres squared. After an overnight fast of 8-12 hours, venous blood was collected under aseptic precautions. Serum was separated for lipid analysis, while EDTA blood was stored at -20°C until DNA extraction.
Biochemical analysis and definition of dyslipidaemia
Total cholesterol, triglycerides and HDL cholesterol were measured using enzymatic colorimetric methods on an automated chemistry analyser with internal quality-control material at two concentration levels. LDL cholesterol was measured directly or estimated using the Friedewald equation when triglycerides were below 400 mg/dL [15]. Dyslipidaemia was defined as the presence of at least one of the following: total cholesterol at least 240 mg/dL, LDL cholesterol at least 130 mg/dL, triglycerides at least 200 mg/dL, HDL cholesterol below 40 mg/dL in men, or HDL cholesterol below 50 mg/dL in women. These categories were based on conventional Adult Treatment Panel III thresholds [16].
DNA extraction and APOE genotyping
Genomic DNA was isolated from peripheral blood leukocytes using a silica column-based extraction method. APOE genotyping was performed by polymerase chain reaction-restriction fragment length polymorphism, following the principle of HhaI restriction isotyping described by Hixson and Vernier [17]. A 244-base-pair segment spanning codons 112 and 158 was amplified. Each 25 µL reaction contained genomic DNA, reaction buffer, magnesium chloride, deoxynucleotide triphosphates, forward and reverse primers, and Taq DNA polymerase. Amplification consisted of initial denaturation, 35 cycles of denaturation, annealing and extension, followed by final extension. The product was digested with HhaI, separated by polyacrylamide gel electrophoresis and interpreted according to the characteristic fragment pattern for ε2, ε3 and ε4 alleles.
Quality assurance
Laboratory personnel were blinded to the clinical and lipid categories during genotype interpretation. Ten per cent of samples were selected randomly for repeat genotyping, and discordant or weak band patterns were re-amplified. Negative controls were included in each polymerase chain reaction batch. Lipid assays were accepted only when daily internal quality-control values remained within the laboratory target range.
Outcome measures
The primary outcome was dyslipidaemia at enrolment. Secondary outcomes were individual lipid abnormalities and mean total cholesterol, LDL cholesterol, HDL cholesterol and triglyceride concentrations across APOE groups. For phenotype-based comparisons, ε2/ε2 and ε2/ε3 were grouped as the ε2 phenotype, ε3/ε3 served as the reference phenotype, ε3/ε4 and ε4/ε4 formed the ε4 phenotype, and the uncommon ε2/ε4 genotype was retained as a separate group.
Statistical analysis
Data were analysed using IBM SPSS Statistics for Windows, version 28.0 (IBM Corp., Armonk, New York, USA). Continuous variables were summarised as mean and standard deviation, and categorical variables as frequency and percentage. The independent-samples t test compared continuous variables between participants with and without dyslipidaemia. One-way analysis of variance compared lipid concentrations across APOE phenotype groups. Categorical variables were assessed using Pearson chi-square tests, with Fisher exact testing reserved for sparse cells. Allele frequencies were calculated by gene counting, and Hardy-Weinberg equilibrium was examined using a chi-square goodness-of-fit test. Multivariable binary logistic regression estimated adjusted odds ratios and 95% confidence intervals for dyslipidaemia. Variables were selected on biological relevance and included ε4 carriage, ε2 carriage, age, sex, body mass index, diabetes, hypertension, smoking and statin use. A two-sided p value below 0.05 was considered statistically significant.
RESULTS:
Participant flow and clinical profile
The total of 398 patients with documented CAD were assessed, of whom 360 had complete clinical, lipid and genotype information and were included in the analysis (Figure 1). The mean age was 57.5±9.2 years, and 254 (70.6%) were men. Diabetes was present in 120 (33.3%), hypertension in 181 (50.3%), and current smoking in 104 (28.9%). Statin therapy was recorded in 218 (60.6%). Overall, 229 participants (63.6%) met the study definition of dyslipidaemia.
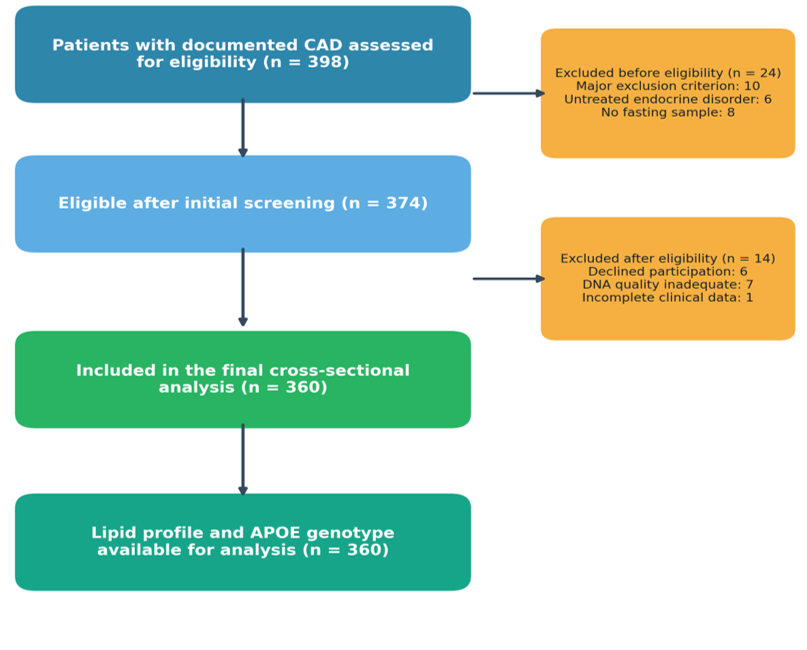
Figure 1. Participant flow through the study
Table 1. Baseline characteristics according to dyslipidaemia status
|
Characteristic |
Overall (n=360) |
No dyslipidaemia (n=131) |
Dyslipidaemia (n=229) |
t/χ² |
p value |
|
Age, years |
57.5 ± 9.2 |
56.6 ± 9.5 |
58.1 ± 9.0 |
-1.45 |
0.148 |
|
Body mass index, kg/m² |
26.0 ± 3.4 |
25.2 ± 3.1 |
26.5 ± 3.4 |
-3.69 |
<0.001 |
|
Total cholesterol, mg/dL |
193.9 ± 29.5 |
179.6 ± 21.9 |
202.0 ± 30.2 |
-8.10 |
<0.001 |
|
LDL-C, mg/dL |
117.6 ± 25.6 |
101.6 ± 17.7 |
126.7 ± 25.1 |
-11.05 |
<0.001 |
|
HDL-C, mg/dL |
43.8 ± 8.4 |
49.0 ± 6.2 |
40.8 ± 7.9 |
10.93 |
<0.001 |
|
Triglycerides, mg/dL |
162.4 ± 42.0 |
143.7 ± 36.8 |
173.1 ± 41.1 |
-6.98 |
<0.001 |
|
Male sex |
254 (70.6) |
87 (66.4) |
167 (72.9) |
1.40 |
0.236 |
|
Diabetes mellitus |
120 (33.3) |
21 (16.0) |
99 (43.2) |
26.53 |
<0.001 |
|
Hypertension |
181 (50.3) |
65 (49.6) |
116 (50.7) |
0.01 |
0.936 |
|
Current smoking |
104 (28.9) |
33 (25.2) |
71 (31.0) |
1.10 |
0.294 |
|
Family history of premature CAD |
113 (31.4) |
41 (31.3) |
72 (31.4) |
0.00 |
1.000 |
|
Receiving statin therapy |
218 (60.6) |
90 (68.7) |
128 (55.9) |
5.20 |
0.023 |
|
Acute coronary syndrome presentation |
190 (52.8) |
64 (48.9) |
126 (55.0) |
1.04 |
0.309 |
|
Multivessel coronary disease |
198 (55.0) |
68 (51.9) |
130 (56.8) |
0.61 |
0.434 |
Values are mean ± standard deviation or n (%). Continuous variables were compared using the independent-samples t test; categorical variables were compared using Pearson chi-square test. CAD, coronary artery disease; HDL-C, high-density lipoprotein cholesterol; LDL-C, low-density lipoprotein cholesterol.
Participants with dyslipidaemia had a higher mean body mass index and were more likely to have diabetes. As expected from the outcome definition, total cholesterol, LDL cholesterol and triglycerides were higher, while HDL cholesterol was lower. Statin use was less frequent among those with dyslipidaemia, suggesting that treatment exposure partly modified the lipid phenotype (Table 1).
APOE genotype and allele distribution
The ε3/ε3 genotype was the dominant genotype, observed in 255 participants (70.8%). The ε3/ε4 genotype accounted for 58 (16.1%), whereas ε2/ε3 was present in 31 (8.6%). The ε2, ε3 and ε4 allele frequencies were 6.1%, 83.2% and 10.7%, respectively. The observed genotype distribution did not depart significantly from Hardy-Weinberg equilibrium (χ²=5.59, p=0.134) (Table 2 and Figure 2).
Table 2: APOE genotype and allele frequencies
|
Genotype or allele |
Observed count |
Frequency (%) |
Expected genotype count under HWE |
|
E2/E2 |
3 |
0.8 |
1.3 |
|
E2/E3 |
31 |
8.6 |
36.6 |
|
E2/E4 |
7 |
1.9 |
4.7 |
|
E3/E3 |
255 |
70.8 |
249.2 |
|
E3/E4 |
58 |
16.1 |
64.1 |
|
E4/E4 |
6 |
1.7 |
4.1 |
|
Allele ε2 |
44 |
6.1 |
- |
|
Allele ε3 |
599 |
83.2 |
- |
|
Allele ε4 |
77 |
10.7 |
- |
HWE, Hardy-Weinberg equilibrium. For the six genotypes, χ²=5.59, degrees of freedom=3, p=0.134. Allele counts are based on 720 chromosomes.
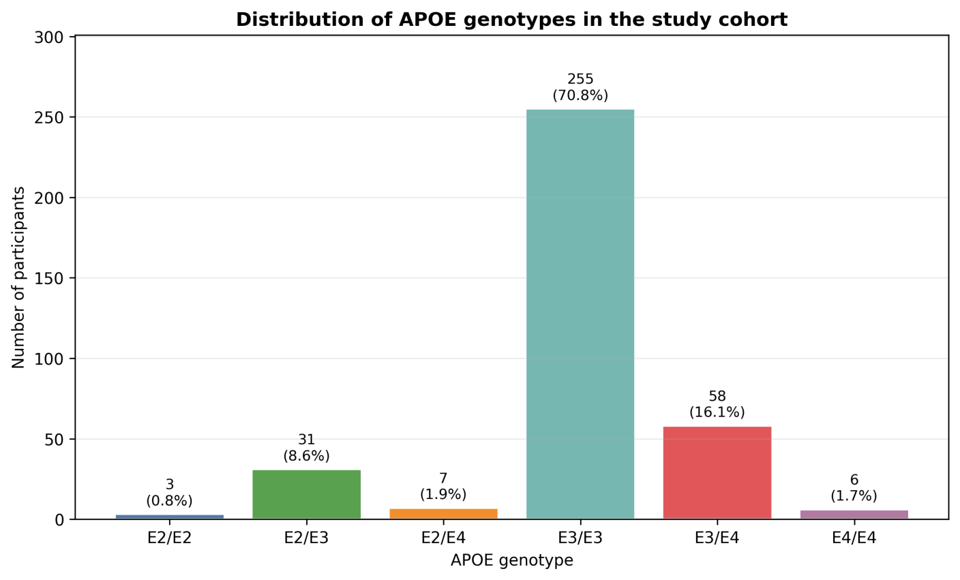
Figure 2: Distribution of APOE genotypes in the cohort
Lipid concentrations across APOE phenotype groups
A graded pattern was observed for total and LDL cholesterol. Mean LDL cholesterol was lowest in the ε2 phenotype, intermediate in ε3/ε3, and highest in the ε4 phenotype. The between-group difference was statistically significant (F=18.58, p<0.001). Total cholesterol followed a similar pattern (F=12.99, p<0.001). HDL cholesterol showed a modest decline across groups (p=0.032), while triglyceride concentrations did not differ significantly (p=0.329) (Table 3 and Figure 3).
Table 3. Fasting lipid concentrations according to APOE phenotype
|
Lipid parameter |
E2 phenotype (n=34) |
E3/E3 (n=255) |
E4 phenotype (n=64) |
E2/E4 (n=7) |
F value |
p value |
|
Total cholesterol, mg/dL |
177.7 ± 25.5 |
191.3 ± 28.5 |
210.3 ± 27.0 |
214.5 ± 32.5 |
12.99 |
<0.001 |
|
LDL-C, mg/dL |
99.0 ± 22.0 |
115.5 ± 24.1 |
133.2 ± 24.6 |
139.9 ± 18.9 |
18.58 |
<0.001 |
|
HDL-C, mg/dL |
47.0 ± 8.2 |
43.9 ± 8.2 |
42.0 ± 8.9 |
41.2 ± 6.3 |
2.96 |
0.032 |
|
Triglycerides, mg/dL |
152.7 ± 37.7 |
162.0 ± 43.3 |
169.1 ± 39.2 |
161.8 ± 36.6 |
1.15 |
0.329 |
Values are mean ± standard deviation. One-way analysis of variance was used. The E2 phenotype includes E2/E2 and E2/E3; the E4 phenotype includes E3/E4 and E4/E4. LDL-C, low-density lipoprotein cholesterol; HDL-C, high-density lipoprotein cholesterol
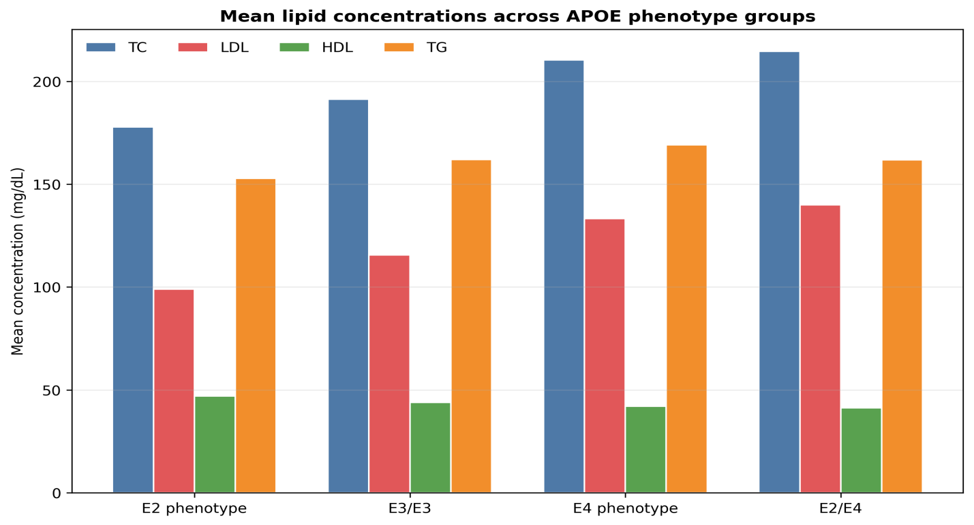
Figure 3: Mean lipid concentrations across APOE phenotype groups
4.4 APOE phenotype and prevalence of dyslipidaemia
Dyslipidaemia was present in 12 of 34 participants with the ε2 phenotype (35.3%), 161 of 255 with ε3/ε3 (63.1%), 51 of 64 with the ε4 phenotype (79.7%), and 5 of 7 with ε2/ε4 (71.4%). The overall association between APOE phenotype and dyslipidaemia was significant (χ²=19.13, p<0.001). High LDL cholesterol and low HDL cholesterol accounted for most of the between-group variation, whereas high triglycerides did not show a genotype-related pattern (Table 4 and Figure 4).
Table 4: Lipid abnormalities according to APOE phenotype
|
Lipid abnormality |
E2 phenotype (n=34) |
E3/E3 (n=255) |
E4 phenotype (n=64) |
E2/E4 (n=7) |
χ² |
p value |
|
Total cholesterol ≥240 mg/dL |
0 (0.0) |
12 (4.7) |
9 (14.1) |
1 (14.3) |
10.96 |
0.012 |
|
LDL-C ≥130 mg/dL |
2 (5.9) |
71 (27.8) |
36 (56.2) |
5 (71.4) |
35.16 |
<0.001 |
|
Triglycerides ≥200 mg/dL |
5 (14.7) |
43 (16.9) |
12 (18.8) |
1 (14.3) |
0.31 |
0.959 |
|
Low HDL-C |
7 (20.6) |
108 (42.4) |
38 (59.4) |
2 (28.6) |
14.60 |
0.002 |
|
Any dyslipidaemia |
12 (35.3) |
161 (63.1) |
51 (79.7) |
5 (71.4) |
19.13 |
<0.001 |
Values are n (%). Low HDL-C was defined as <40 mg/dL in men and <50 mg/dL in women. Pearson chi-square testing was used. HDL-C, high-density lipoprotein cholesterol; LDL-C, low-density lipoprotein cholesterol
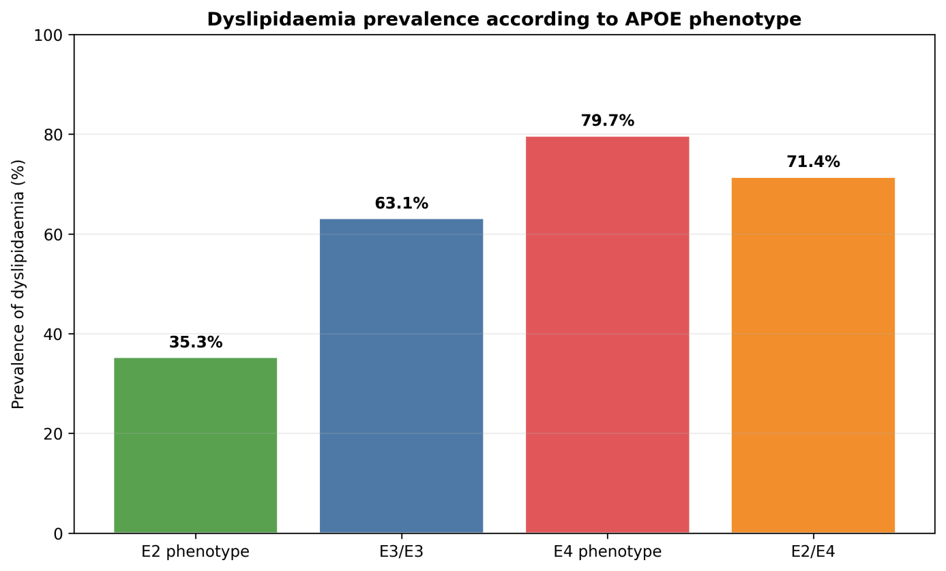
Figure 4: Prevalence of dyslipidaemia according to APOE phenotype
Independent predictors of dyslipidaemia
In multivariable logistic regression, ε4 carriage remained independently associated with dyslipidaemia after adjustment for age, sex, body mass index, diabetes, hypertension, smoking and statin use (aOR 2.57, 95% CI 1.33-4.96, p=0.005). ε2 carriage was inversely associated with dyslipidaemia (aOR 0.27, 95% CI 0.13-0.58, p<0.001). Diabetes was the strongest non-genetic predictor (aOR 3.95, 95% CI 2.16-7.20, p<0.001). Current statin therapy was associated with lower odds of dyslipidaemia at enrolment (aOR 0.50, 95% CI 0.31-0.83, p=0.007) (Table 5 and Figure 5).
Table 5: Multivariable logistic regression for dyslipidaemia
|
Variable |
Adjusted odds ratio |
95% confidence interval |
p value |
|
APOE ε4 carrier |
2.57 |
1.33-4.96 |
0.005 |
|
APOE ε2 carrier |
0.27 |
0.13-0.58 |
<0.001 |
|
Age, per 10 years |
1.01 |
0.78-1.32 |
0.926 |
|
Male sex |
1.41 |
0.82-2.44 |
0.217 |
|
Body mass index, per kg/m² |
1.07 |
1.00-1.16 |
0.060 |
|
Diabetes mellitus |
3.95 |
2.16-7.20 |
<0.001 |
|
Hypertension |
1.00 |
0.62-1.63 |
0.993 |
|
Current smoking |
1.29 |
0.74-2.26 |
0.368 |
|
Current statin therapy |
0.50 |
0.31-0.83 |
0.007 |
Dependent variable: dyslipidaemia. The model included all listed variables simultaneously. Age was entered per 10-year increase. BMI was entered per 1 kg/m² increase. The reference group for APOE carrier variables was E3/E3, while E2/E4 contributed to both carrier indicators
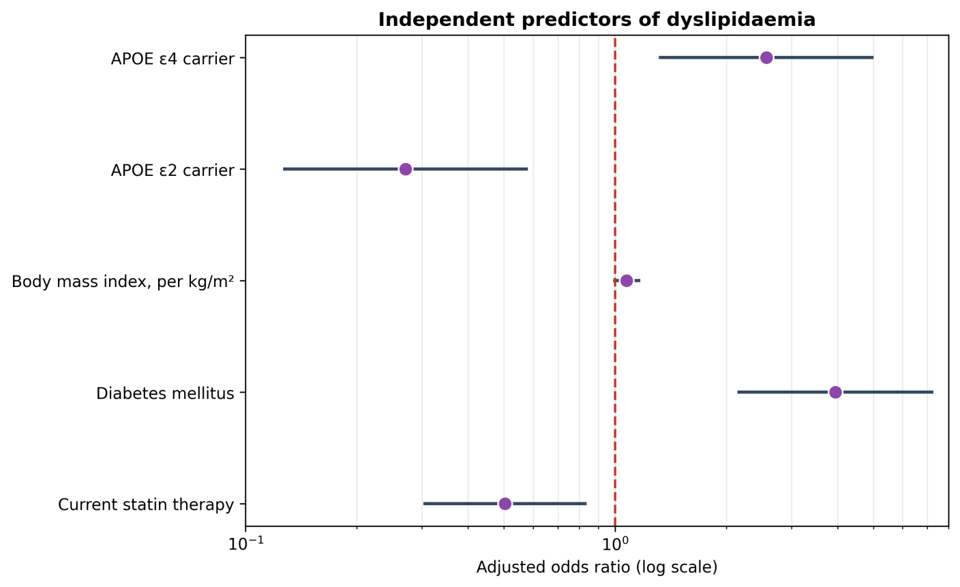
Figure 5: Adjusted odds ratios for selected predictors of dyslipidaemia
DISCUSSION:
This cross-sectional analysis found a clear relationship between APOE phenotype and the lipid profile of patients with established CAD. The ε3/ε3 genotype predominated, as expected in most populations, while the ε4 allele was present in approximately one tenth of chromosomes. Total and LDL cholesterol increased progressively from the ε2 phenotype through ε3/ε3 to the ε4 phenotype. Dyslipidaemia was most frequent in the ε4 group, and ε4 carriage retained an independent association after adjustment for metabolic risk factors and statin treatment. Conversely, ε2 carriage was associated with lower odds of dyslipidaemia.
The direction of the lipid gradient is consistent with the known biology of apoE. ApoE serves as a ligand for receptors that clear remnant particles from the circulation. Structural differences among the E2, E3 and E4 isoforms influence receptor binding, lipoprotein distribution and hepatic cholesterol handling [3,4,18]. In many population studies, ε4 is associated with higher LDL cholesterol, while ε2 carriers have lower LDL cholesterol than ε3 homozygotes [5,6]. Bennet and colleagues demonstrated an approximately linear relationship between APOE genotype, LDL cholesterol and coronary risk in a large pooled analysis [5].
The observed association also agrees with meta-analyses linking ε4 to coronary disease. Song and colleagues reported higher coronary risk among ε4 carriers, while earlier and later pooled studies reached similar conclusions despite variation among individual cohorts [6-8,19]. A Chinese meta-analysis of 40 studies found a marked increase in CAD risk with ε4-containing genotypes [12]. More recent work has shown that apoE-related variation extends beyond conventional LDL cholesterol to particle size and small LDL concentrations, which may contribute to residual coronary risk [14].
South Asian findings are especially relevant because allele frequencies and environmental exposures differ by ancestry. A study in ethnic Kashmir reported higher total and LDL cholesterol among ε4 carriers with CAD [9]. Another South Asian analysis linked APOE variants with diabetes and cardiometabolic risk factors, although the magnitude of association varied across outcomes [10]. Genetic effects in established CAD may be attenuated or distorted by statin exposure, dietary modification, diabetes and acute coronary events. Adjustment for these factors is therefore important, although residual confounding cannot be excluded in a cross-sectional design.
Triglycerides did not differ significantly across APOE groups in the present analysis. This may reflect the strong influence of diabetes, adiposity, diet, alcohol intake and treatment on triglyceride concentrations. ApoE primarily affects remnant clearance, but a single fasting triglyceride measurement may not fully capture remnant particle burden. Direct assessment of remnant cholesterol, apolipoprotein B, non-HDL cholesterol or nuclear magnetic resonance lipoprotein subclasses could provide a more sensitive evaluation in future studies [14,18].
Diabetes showed a strong independent relationship with dyslipidaemia. This is clinically plausible because insulin resistance increases hepatic very-low-density lipoprotein production, promotes triglyceride enrichment and favours small dense LDL formation. The protective association observed with statin use supports the expected treatment effect, but it should not be interpreted causally because treatment was not randomised. Patients prescribed statins may differ in adherence, dose, duration and baseline lipid burden.
The findings have potential clinical implications. APOE genotyping is not required for routine diagnosis or management of dyslipidaemia, and treatment decisions in CAD should continue to be guided by established risk status and achieved LDL cholesterol. Nevertheless, genotype may help explain why some patients show persistently elevated LDL cholesterol or residual lipoprotein abnormalities despite similar treatment. In a research setting, combining APOE genotype with apolipoprotein B, lipoprotein(a), remnant cholesterol and medication adherence may improve understanding of treatment response.
The study has several strengths, including a sample exceeding 300 participants, explicit genotype quality control, assessment of Hardy-Weinberg equilibrium, and adjustment for major clinical covariates. Its limitations are equally important. The analysis is cross-sectional and cannot determine temporal or causal relationships. Lipid measurements may be affected by statin exposure and acute illness. Dietary intake, statin dose, adherence, thyroid function, apolipoprotein B and lipoprotein(a) were not modelled. Rare genotypes produced small cells, particularly ε2/ε2, ε2/ε4 and ε4/ε4.
CONCLUSION:
In this cross-sectional analysis, APOE polymorphism was associated with the lipid profile of patients with CAD. The ε4 phenotype showed higher total and LDL cholesterol and a greater prevalence of dyslipidaemia, whereas ε2 carriage was associated with a more favourable profile. Diabetes further increased the likelihood of dyslipidaemia, while statin therapy was associated with lower odds. These results support the biological relevance of APOE in lipid variability.
REFERENCES:
1. Prabhakaran D, Jeemon P, Roy A. Cardiovascular diseases in India: current epidemiology and future directions. Circulation. 2016;133(16):1605-1620. doi:10.1161/CIRCULATIONAHA.114.008729.
2. Joshi SR, Anjana RM, Deepa M, Pradeepa R, Bhansali A, Dhandania VK, et al. Prevalence of dyslipidemia in urban and rural India: the ICMR-INDIAB study. PLoS One. 2014;9(5):e96808. doi:10.1371/journal.pone.0096808.
3. Mahley RW, Rall SC Jr. Apolipoprotein E: far more than a lipid transport protein. Annu Rev Genomics Hum Genet. 2000;1:507-537. doi:10.1146/annurev.genom.1.1.507.
4. Phillips MC. Apolipoprotein E isoforms and lipoprotein metabolism. IUBMB Life. 2014;66(9):616-623. doi:10.1002/iub.1314.
5. Bennet AM, Di Angelantonio E, Ye Z, Wensley F, Dahlin A, Ahlbom A, et al. Association of apolipoprotein E genotypes with lipid levels and coronary risk. JAMA. 2007;298(11):1300-1311. doi:10.1001/jama.298.11.1300.
6. Song Y, Stampfer MJ, Liu S. Meta-analysis: apolipoprotein E genotypes and risk for coronary heart disease. Ann Intern Med. 2004;141(2):137-147. doi:10.7326/0003-4819-141-2-200407200-00013.
7. Wilson PW, Schaefer EJ, Larson MG, Ordovas JM. Apolipoprotein E alleles and risk of coronary disease: a meta-analysis. Arterioscler Thromb Vasc Biol. 1996;16(10):1250-1255. doi:10.1161/01.ATV.16.10.1250.
8. Holmes MV, Frikke-Schmidt R, Melis D, Luben R, Asselbergs FW, Boer JMA, et al. A systematic review and meta-analysis of 130,000 individuals shows smoking does not modify the association of APOE genotype on risk of coronary heart disease. Atherosclerosis. 2014;237(1):5-12. doi:10.1016/j.atherosclerosis.2014.07.038.
9. Afroze D, Yousuf A, Tramboo NA, Shah ZA, Ahmad A. ApoE gene polymorphism and its relationship with coronary artery disease in ethnic Kashmiri population. Clin Exp Med. 2016;16(4):551-556. doi:10.1007/s10238-015-0389-7.
10. Sapkota B, Subramanian A, Priamvada G, Finely H, Blackett PR, Aston CE, et al. Association of APOE polymorphisms with diabetes and cardiometabolic risk factors and the role of APOE genotypes in response to anti-diabetic therapy: results from the AIDHS/SDS on a South Asian population. J Diabetes Complications. 2015;29(8):1191-1197. doi:10.1016/j.jdiacomp.2015.07.025.
11. Wu L, Zhang Y, Zhao H, Rong G, Huang P, Wang F, et al. Dissecting the association of apolipoprotein E gene polymorphisms with type 2 diabetes mellitus and coronary artery disease. Front Endocrinol (Lausanne). 2022;13:838547. doi:10.3389/fendo.2022.838547.
12. Yin YW, Sun QQ, Zhang BB, Hu AM, Liu HL, Wang Q, et al. Association between apolipoprotein E gene polymorphism and the risk of coronary artery disease in Chinese population: evidence from a meta-analysis of 40 studies. PLoS One. 2013;8(6):e66924. doi:10.1371/journal.pone.0066924.
13. Xu M, Zhao J, Zhang Y, Ma X, Dai Q, Zhi H, et al. Apolipoprotein E gene variants and risk of coronary heart disease: a meta-analysis. Biomed Res Int. 2016;2016:3912175. doi:10.1155/2016/3912175.
14. Lin Y, Yang Q, Liu Z, Su B, Xu F, Li Y, et al. Relationship between apolipoprotein E genotype and lipoprotein profile in patients with coronary heart disease. Molecules. 2022;27(4):1377. doi:10.3390/molecules27041377.
15. Friedewald WT, Levy RI, Fredrickson DS. Estimation of the concentration of low-density lipoprotein cholesterol in plasma, without use of the preparative ultracentrifuge. Clin Chem. 1972;18(6):499-502. doi:10.1093/clinchem/18.6.499.
16. National Cholesterol Education Program Expert Panel. Third report of the National Cholesterol Education Program Expert Panel on detection, evaluation, and treatment of high blood cholesterol in adults (Adult Treatment Panel III): final report. Circulation. 2002;106(25):3143-3421. doi:10.1161/circ.106.25.3143.
17. Hixson JE, Vernier DT. Restriction isotyping of human apolipoprotein E by gene amplification and cleavage with HhaI. J Lipid Res. 1990;31(3):545-548. doi:10.1016/S0022-2275(20)43176-1.
18. Chaudhary R, Likidlilid A, Peerapatdit T, Tresukosol D, Srisuma S, Ratanamaneechat S, et al. Apolipoprotein E gene polymorphism: effects on plasma lipids and risk of type 2 diabetes and coronary artery disease. Cardiovasc Diabetol. 2012;11:36. doi:10.1186/1475-2840-11-36.
19. Eichner JE, Dunn ST, Perveen G, Thompson DM, Stewart KE, Stroehla BC. Apolipoprotein E polymorphism and cardiovascular disease: a HuGE review. Am J Epidemiol. 2002;155(6):487-495. doi:10.1093/aje/155.6.487.
20. Wilson PWF, Myers RH, Larson MG, Ordovas JM, Wolf PA, Schaefer EJ. Apolipoprotein E genotype and cardiovascular disease in the Framingham Heart Study. Atherosclerosis. 2001;154(3):529-537. doi:10.1016/S0021-9150(00)00570-0.