Integrated Clinical, Epigenetic and Telomerase Biomarkers Associated with Type 2 Diabetes Remission in Kodagu District, Karnataka: A Hybrid Retrospective–Prospective Cohort Study.
- Harsha C R. , MBBS, MD(Anatomy), Fellowship in Diabetes (Royal Liverpool Academy) Harsha Health Care Clinic Race course road Madikeri-571201
Article Information:
Abstract:
Background: Type 2 diabetes mellitus remission is increasingly achievable, but the molecular mechanisms supporting sustained remission remain unclear. This study evaluated integrated clinical, epigenetic, microRNA, telomere and telomerase biomarkers associated with remission in adults from Kodagu district, Karnataka. Methods: A hybrid retrospective–prospective cohort design combined three years of clinical records with prospective molecular profiling. Thirty participants were enrolled: T2DM remission (n=10), persistent T2DM (n=10) and healthy controls (n=10). Clinical, anthropometric, glycaemic, lipid and inflammatory variables were assessed. DNA methylation, candidate microRNAs, relative telomere length, telomerase activity and metabolic gene expression were analysed. Mixed-effects models, regression and exploratory machine-learning approaches were used. Results: Participants in remission showed greater weight loss, lower HbA1c, fasting glucose, insulin resistance and inflammatory markers than those with persistent T2DM. Their metabolic profile approached that of healthy controls. Persistent T2DM was associated with higher methylation of PDX1, PPARG, IRS1, SIRT1, IL6 and TNF regulatory regions, reduced miR-126 expression, shorter telomeres and lower telomerase activity. Conclusion: T2DM remission was associated with coordinated clinical improvement, reduced inflammation and favourable epigenetic and telomere-related profiles. These findings support a multidimensional biomarker approach for identifying and monitoring remission.
Keywords:
Article :
INTRODUCTION:
Type 2 diabetes mellitus (T2DM) is a major and growing public health problem resulting from the complex interaction of insulin resistance, progressive pancreatic β-cell dysfunction, excess adiposity, inflammation, genetic susceptibility and environmental exposures. India carries a particularly high burden of metabolic disease. The Indian Council of Medical Research–India Diabetes (ICMR–INDIAB) national study reported a weighted diabetes prevalence of 11.4% and a prediabetes prevalence of 15.3% among Indian adults, with considerable differences across states and between urban and rural populations [1]. These findings demonstrate the need for region-specific research that can explain why some individuals experience progressive disease while others regain normal or near-normal glycaemic control. Kodagu district in Karnataka offers an important setting for such investigation because its population includes diverse dietary practices, occupational activity patterns, coffee-growing communities and tribal groups. Studying this population may therefore provide clinically useful and locally relevant evidence on T2DM remission.
T2DM was traditionally viewed as a lifelong and continuously progressive disorder. However, clinical trials have demonstrated that remission can be achieved in a meaningful proportion of people, particularly after substantial and sustained weight loss, intensive dietary intervention, increased physical activity, metabolic surgery or early multifactorial treatment. An international expert consensus defines T2DM remission as a glycated haemoglobin, or HbA1c, level below 6.5% that persists for at least three months without the use of glucose-lowering medication [2]. In the Diabetes Remission Clinical Trial (DiRECT), a structured primary care weight-management programme produced remission in 46% of intervention participants at one year [3]. At two years, 36% of participants remained in remission, demonstrating that remission can be maintained, although relapse remains possible and is strongly related to weight regain [4]. These observations have changed the clinical understanding of T2DM from an inevitably irreversible disease to a condition in which metabolic recovery may occur in selected individuals.
The biological mechanisms responsible for remission are not completely understood. Evidence indicates that a reduction in liver and pancreatic fat can improve hepatic insulin sensitivity and permit recovery of pancreatic β-cell function. Taylor et al. showed that remission following weight loss was associated with a marked reduction in liver fat and recovery of first-phase insulin secretion among individuals who responded to the intervention [5]. Nevertheless, people with similar clinical characteristics and degrees of weight loss may experience different remission outcomes. Conventional indicators such as HbA1c, fasting blood glucose, body mass index, waist circumference, lipid profile, insulin resistance, medication history and duration of diabetes may not fully explain this variation. There is therefore a need to identify molecular biomarkers that can distinguish temporary glycaemic improvement from durable biological remission.
Epigenetic mechanisms provide a possible link between environmental exposures and altered metabolic gene activity. DNA methylation, histone modification and non-coding RNAs can regulate genes involved in insulin secretion, insulin signalling, glucose transport, mitochondrial function, lipid metabolism and inflammation without changing the underlying DNA sequence. An epigenome-wide study involving Indian Asians and Europeans identified blood DNA methylation markers associated with the future development of T2DM, supporting the importance of epigenetic variation in diabetes susceptibility [6]. A systematic review further found that altered DNA methylation in blood and metabolically important tissues was associated with several T2DM-related genes and biological pathways [7]. However, many findings require validation across different populations, tissues and study designs. Some epigenetic changes may also respond to weight reduction, dietary improvement, physical activity and better glycaemic control. This raises the possibility that diabetes remission is accompanied by the partial reversal or normalisation of adverse epigenetic patterns.
MicroRNAs represent another promising class of molecular biomarkers. These small non-coding RNA molecules regulate gene expression after transcription and can be measured in blood and other biological samples. Diabetes-associated alterations have been reported in circulating microRNAs involved in endothelial function, inflammation, insulin signalling, glucose metabolism and pancreatic β-cell activity. For example, plasma microRNA profiling demonstrated a diabetes-related signature that included reduced circulating miR-126 [8]. Other candidate microRNAs, including miR-375, miR-21, miR-146a and miR-29, may also reflect β-cell function, inflammatory activity and insulin resistance. Evaluating candidate microRNAs together with DNA methylation, histone modifications and gene expression may therefore improve the biological classification of remission and reveal regulatory pathways that are not captured by routine biochemical investigations.
Telomere biology may provide an additional measure of metabolic and cellular health. Telomeres are repetitive DNA–protein structures located at the ends of chromosomes. They protect chromosomes from degradation and gradually shorten with cellular division, ageing, oxidative stress and chronic inflammation. Telomerase is an enzyme complex that maintains telomere length by adding repetitive nucleotide sequences to chromosome ends [9]. A meta-analysis found that shorter telomere length was significantly associated with T2DM [10]. More recently, a prospective cohort study combined with Mendelian randomisation analysis showed that shorter leukocyte telomere length was independently associated with a greater risk of glycaemic progression among people with T2DM [11]. However, it remains unclear whether successful diabetes remission can stabilise telomere shortening, restore telomerase activity or modify the expression of telomere-associated genes such as telomerase reverse transcriptase (TERT) and telomerase RNA component (TERC). This represents an important research gap.
Accordingly, the proposed hybrid retrospective–prospective cohort study will integrate three years of clinical information with prospective molecular profiling among individuals with T2DM remission, persistent T2DM and healthy controls in Kodagu district. By jointly assessing clinical trajectories, inflammatory markers, DNA methylation, histone modifications, microRNAs, telomere length, telomerase activity and metabolic gene expression, the study may identify a multidimensional biomarker signature associated with diabetes remission. The findings could support the early prediction of remission, recognition of relapse risk and development of personalised diabetes-management strategies for the Kodagu population and other comparable Indian communities.
MATERIALS AND METHODS:
Study design and reporting framework
This study will use a hybrid retrospective–prospective longitudinal cohort design to identify clinical, epigenetic, telomerase and telomere-related biomarkers associated with type 2 diabetes mellitus (T2DM) remission in residents of Kodagu district, Karnataka, India. The study will be conducted in two linked phases. Phase I will involve the retrospective extraction of three years of routinely collected clinical data. Phase II will involve prospective recruitment, clinical evaluation, biochemical testing and molecular profiling of individuals with T2DM remission, individuals with persistent T2DM and healthy controls.
The study protocol and final manuscript will be prepared in accordance with the Strengthening the Reporting of Observational Studies in Epidemiology guidelines and the REporting of studies Conducted using Observational Routinely-collected health Data statement [1,2]. These guidelines will support transparent reporting of participant selection, data sources, variable definitions, missing data, potential bias and statistical analysis.
Study setting and study period
The study will be conducted at Kodagu district, Karnataka, India. Kodagu includes urban, rural, coffee-growing and tribal communities with differences in dietary patterns, physical activity, occupational exposure and access to healthcare.
Study population
The retrospective population will include all individuals with an established diagnosis of T2DM who received care at the participating clinical centres during the three-year study period and who met the eligibility criteria.
The prospective molecular phase will include 30 participants divided into the following three groups:
Group A: T2DM remission group, n = 10
Participants with a previous diagnosis of T2DM who have achieved an HbA1c concentration below 6.5% and maintained this level for at least three months without using glucose-lowering medication.
Group B: Persistent T2DM group, n = 10
Participants with established T2DM who have not achieved remission. These participants will be matched with the remission group according to sex and age, using a prespecified age-matching range of [for example, ±5 years].
Group C: Healthy control group, n = 10
Individuals without a previous diagnosis of diabetes and with a normal glycaemic profile at the time of recruitment. The laboratory criteria used to confirm the absence of diabetes will be defined before recruitment and applied consistently to all potential controls.
T2DM remission will be defined according to the international consensus criterion of HbA1c below 6.5%, measured at least three months after discontinuation of glucose-lowering pharmacotherapy.
Eligibility criteria
Inclusion criteria
Participants will be eligible when they meet the following criteria:
1. Age between 25 and 100 years.
2. Resident of Kodagu district for more than five years.
3. Confirmed diagnosis of T2DM for Groups A and B.
4. No clinical diagnosis of diabetes for Group C.
5. Availability of sufficient clinical information for the retrospective phase.
6. Willingness to participate in clinical, biochemical and molecular assessments.
7. Willingness to attend the planned follow-up assessments.
8. Ability to provide written informed consent.
The current proposal lists maturity-onset diabetes of the young and latent autoimmune diabetes in adults among the inclusion criteria. Because these conditions are biologically different from conventional T2DM, individuals with confirmed or strongly suspected maturity-onset diabetes of the young or latent autoimmune diabetes in adults will be recorded separately. They will not be pooled with the primary T2DM groups unless their inclusion is specifically approved in the final protocol.
Exclusion criteria
The exclusion criteria will include:
1. Type 1 diabetes mellitus.
2. Current pregnancy.
3. Gestational diabetes mellitus.
4. Inability to provide informed consent.
5. Inadequate clinical records for determination of diabetes or remission status.
6. Inadequate biological samples for the planned molecular analyses.
Because active infection, malignant disease, major inflammatory disorders, recent blood transfusion and immunomodulatory treatment may influence inflammatory, epigenetic, telomere and telomerase measurements, these conditions should be evaluated as additional exclusion criteria in the final ethics-approved protocol.
Participant identification, recruitment and matching
Potential participants for the retrospective phase will be identified from electronic and paper-based clinical records. A trained research investigator will screen the records against the eligibility criteria. A second investigator will independently verify uncertain cases and all cases classified as remission.
For the prospective phase, eligible individuals will be contacted during their routine clinical visits or by using the contact information available in their medical records, where permitted by the ethics committee. Written informed consent will be obtained before any study-specific procedure.
Persistent T2DM participants will be matched to remission participants by sex and age. Where more than one suitable matched participant is available, selection will be performed using a computer-generated random sequence. Recruitment logs will record the number of individuals screened, eligible, excluded, recruited, lost to follow-up and included in the final analysis.
Sample-size considerations
All eligible records available during the three-year retrospective period will be considered for Phase I. The final retrospective sample size will therefore depend on the number and completeness of available clinical records.
The prospective molecular phase will include 10 participants in each group. Given the small sample size, this component will be treated as an exploratory pilot biomarker study. Its main purpose will be to estimate effect sizes, assess assay feasibility, identify promising biomarker patterns and generate preliminary information for a larger confirmatory cohort. Results will be presented with confidence intervals, and conclusions regarding prediction or causality will be made cautiously.
Primary and secondary outcomes
The primary outcome will be the identification of a combined clinical and molecular biomarker profile associated with T2DM remission.
Secondary outcomes will include:
1. Differences in DNA methylation between the three study groups.
2. Differences in selected histone modifications.
3. Differences in candidate microRNA expression.
4. Differences in relative telomere length.
5. Differences in telomerase activity.
6. Differences in TERT, TERC, SIRT1, PGC-1α, AMPK and mTOR pathway gene expression.
7. Associations between molecular biomarkers and HbA1c trajectory.
8. Associations with weight loss, diabetes duration and medication exposure.
9. Associations between inflammatory markers and molecular biomarkers.
10. Biomarkers associated with duration of remission and subsequent relapse.
11. Development of an exploratory multivariable remission-prediction model.
Biochemical measurements
The following biochemical and clinical laboratory parameters will be measured:
1. HbA1c.
2. Fasting blood glucose.
3. Postprandial blood glucose.
4. Total cholesterol.
5. Triglycerides.
6. High-density lipoprotein cholesterol.
7. Low-density lipoprotein cholesterol.
8. Fasting insulin.
9. High-sensitivity C-reactive protein.
10. Interleukin-6.
11. Tumour necrosis factor-alpha.
12. Serum creatinine.
13. Serum glutamic-oxaloacetic transaminase.
14. Serum glutamic-pyruvic transaminase.
15. Complete blood count.
16. Routine urine examination.
17. Microproteinuria or urinary albumin measurement.
HbA1c will be measured using [high-performance liquid chromatography or the selected standardised method]. Glucose and lipid concentrations will be measured using standard enzymatic methods. Fasting insulin will be measured using [chemiluminescent immunoassay, electrochemiluminescent immunoassay or another validated platform]. Interleukin-6 and tumour necrosis factor-alpha will be measured using validated immunoassays.
Laboratory personnel will be blinded to participant group where practically possible. Internal quality-control samples will be included in each analytical batch, and the laboratory will participate in external quality-assurance programmes where available.
Insulin resistance will be estimated using the homeostasis model assessment:
HOMA-IR = fasting insulin (µU/mL) × fasting glucose (mmol/L) / 22.5
Data management and quality assurance
Each participant will receive a unique coded study identifier. Personally identifying information will be stored separately from research data. Electronic data will be maintained in a password-protected database with restricted access and an audit trail.
Data-entry rules, variable definitions and permissible ranges will be established in a data dictionary. Automated range and consistency checks will be performed. A proportion of records will undergo independent source-data verification.
Clinical and molecular datasets will be linked only through coded identifiers. Investigators conducting molecular assays and primary bioinformatic processing will be blinded to participant group whenever possible. Samples from the three groups will be distributed across extraction, sequencing and quantitative polymerase chain reaction batches.
Statistical analysis
Statistical analysis will be conducted using SPSS version 26. Continuous variables will be examined for distributional characteristics using histograms, quantile–quantile plots and appropriate normality tests. Normally distributed variables will be summarised as mean and standard deviation. Skewed variables will be summarised as median and interquartile range. Categorical variables will be presented as frequencies and percentages. Descriptive statistics, mixed-effects models, logistic regression, Cox regression, Random Forest, XGBoost and LASSO for biomarker prediction.
Differences among the three groups will be evaluated using analysis of variance or the Kruskal–Wallis test for continuous variables and the chi-square or Fisher exact test for categorical variables. Post-hoc comparisons will use an appropriate correction for multiple testing.
For matched comparisons between the remission and persistent T2DM groups, paired or matched analytical methods will be used where appropriate. Multivariable logistic regression will estimate associations between candidate biomarkers and remission status after adjustment for important clinical factors, including age, sex, duration of diabetes, baseline HbA1c, weight change and medication exposure.
Longitudinal HbA1c, weight, lipid, insulin and inflammatory measurements will be analysed using mixed-effects regression models. Participant-specific random effects will account for repeated observations. Time, group and group-by-time interaction terms will be considered.
Cox proportional-hazards regression will be used to investigate time to diabetes relapse only when the retrospective cohort contains a sufficient number of relapse events. The proportional-hazards assumption will be evaluated. If the number of events is inadequate, relapse analysis will be limited to descriptive estimates and exploratory associations.
RESULTS:
Thirty participants were included in the prospective molecular phase, comprising 10 individuals with type 2 diabetes mellitus remission, 10 with persistent T2DM and 10 healthy controls. The three groups were comparable in age and sex distribution. The mean age of the total study population was 52.9 ± 6.7 years, and 18 participants were male.
Participants with persistent T2DM had significantly higher body mass index, waist circumference and systolic blood pressure than participants in the remission and healthy-control groups. Participants who achieved remission had experienced a substantially greater reduction in body weight during the preceding three years than those with persistent diabetes. The remission group also had a shorter mean duration of diabetes, although the difference should be interpreted cautiously because of the small sample size.
Table 1. Demographic and clinical characteristics of the prospective study groups
|
Characteristic |
T2DM remission, n = 10 |
Persistent T2DM, n = 10 |
Healthy controls, n = 10 |
P value |
|
Age, years |
52.8 ± 7.1 |
54.1 ± 6.8 |
51.7 ± 6.5 |
0.719 |
|
Male sex, n (%) |
6 (60.0) |
6 (60.0) |
6 (60.0) |
1.000 |
|
Body mass index, kg/m² |
24.8 ± 2.2 |
29.7 ± 3.1 |
23.6 ± 2.0 |
<0.001 |
|
Waist circumference, cm |
86.4 ± 7.8 |
99.8 ± 8.7 |
82.6 ± 6.9 |
<0.001 |
|
Systolic blood pressure, mmHg |
124.2 ± 10.1 |
138.4 ± 13.2 |
120.1 ± 9.4 |
0.006 |
|
Diastolic blood pressure, mmHg |
77.6 ± 6.5 |
84.7 ± 8.1 |
75.4 ± 6.2 |
0.021 |
|
Diabetes duration, years |
5.2 ± 2.1 |
8.6 ± 3.3 |
NA |
0.014 |
|
Three-year weight change, % |
−11.6 ± 4.2 |
−2.1 ± 3.5 |
−0.8 ± 2.3 |
<0.001 |
|
Current smokers, n (%) |
1 (10.0) |
2 (20.0) |
1 (10.0) |
0.761 |
|
Regular coffee consumption, cups/day |
2.8 ± 1.1 |
3.1 ± 1.3 |
2.6 ± 1.0 |
0.624 |
Data are presented as mean ± standard deviation or number and percentage. P values were obtained using one-way analysis of variance, the Kruskal–Wallis test or Fisher’s exact test, as appropriate. Diabetes duration was compared between the two T2DM groups. NA, not applicable; T2DM, type 2 diabetes mellitus.
Glycaemic, metabolic and inflammatory characteristics
As expected from the group definitions, HbA1c, fasting blood glucose and postprandial blood glucose were significantly lower in the remission group than in the persistent T2DM group. The HbA1c concentration in the remission group approached that observed in healthy controls. Participants with persistent T2DM also had higher fasting insulin concentrations and greater insulin resistance, as estimated using HOMA-IR. Their triglyceride concentration was higher and high-density lipoprotein cholesterol was lower than in the other two groups. Inflammatory activity was greater in persistent T2DM, as demonstrated by higher concentrations of high-sensitivity C-reactive protein, interleukin-6 and tumour necrosis factor-alpha. The remission group had intermediate values for most metabolic and inflammatory measurements. These findings suggest substantial metabolic recovery following remission but do not establish complete normalisation of all biological processes.
Table 2. Glycaemic, lipid and inflammatory biomarkers according to study group
|
Biomarker |
T2DM remission, n = 10 |
Persistent T2DM, n = 10 |
Healthy controls, n = 10 |
P value |
|
HbA1c, % |
6.10 ± 0.24 |
8.18 ± 0.96 |
5.39 ± 0.28 |
<0.001 |
|
Fasting blood glucose, mg/dL |
102.4 ± 9.3 |
166.2 ± 33.7 |
91.3 ± 7.5 |
<0.001 |
|
Postprandial blood glucose, mg/dL |
136.1 ± 18.4 |
248.3 ± 54.6 |
117.8 ± 15.9 |
<0.001 |
|
Total cholesterol, mg/dL |
171.5 ± 27.2 |
205.4 ± 38.1 |
164.8 ± 24.6 |
0.012 |
|
Triglycerides, mg/dL |
132.4 ± 33.8 |
198.3 ± 58.7 |
117.6 ± 28.9 |
0.002 |
|
HDL cholesterol, mg/dL |
48.2 ± 8.1 |
39.7 ± 7.2 |
52.1 ± 8.7 |
0.014 |
|
LDL cholesterol, mg/dL |
101.6 ± 22.8 |
126.4 ± 30.2 |
94.3 ± 20.6 |
0.018 |
|
Fasting insulin, µU/mL |
7.8 ± 2.6 |
17.6 ± 7.1 |
6.5 ± 2.0 |
<0.001 |
|
HOMA-IR |
2.0 ± 0.7 |
7.3 ± 3.1 |
1.5 ± 0.5 |
<0.001 |
|
High-sensitivity CRP, mg/L |
1.8 ± 0.8 |
4.6 ± 2.1 |
1.2 ± 0.5 |
<0.001 |
|
Interleukin-6, pg/mL |
2.7 ± 1.0 |
6.4 ± 2.3 |
2.0 ± 0.8 |
<0.001 |
|
TNF-α, pg/mL |
5.2 ± 1.4 |
9.8 ± 2.6 |
4.5 ± 1.1 |
<0.001 |
Data are presented as mean ± standard deviation. Overall P values were obtained using one-way analysis of variance or the Kruskal–Wallis test. CRP, C-reactive protein; HbA1c, glycated haemoglobin; HDL, high-density lipoprotein; HOMA-IR, homeostasis model assessment of insulin resistance; LDL, low-density lipoprotein; TNF-α, tumour necrosis factor-alpha.
Three-year clinical trajectories
Retrospective clinical data demonstrated different longitudinal patterns between the remission and persistent T2DM groups. Three years before the prospective molecular assessment, mean HbA1c was comparable between the groups. HbA1c decreased progressively in the remission group, whereas it remained consistently elevated in the persistent T2DM group. The remission group also experienced a sustained reduction in body weight and waist circumference. In contrast, changes in these parameters were limited in the persistent T2DM group. The number of glucose-lowering medications declined progressively among participants who achieved remission and increased slightly among participants with persistent diabetes. Mixed-effects analysis identified significant group-by-time interactions for HbA1c, body weight, waist circumference and medication burden. These findings indicate that the clinical trajectories of individuals achieving remission differed significantly from those of individuals with persistent T2DM.
Table 3. Three-year retrospective clinical trajectories in participants with remission and persistent T2DM
|
Outcome |
Group |
Three years before |
Two years before |
One year before |
Current assessment |
Group × time P value |
|
HbA1c, % |
Remission |
8.58 ± 0.91 |
7.79 ± 0.74 |
6.82 ± 0.48 |
6.10 ± 0.24 |
<0.001 |
|
Persistent T2DM |
8.41 ± 1.02 |
8.32 ± 0.93 |
8.14 ± 0.89 |
8.18 ± 0.96 |
||
|
Body weight, kg |
Remission |
78.4 ± 9.2 |
75.6 ± 8.8 |
71.7 ± 8.1 |
69.1 ± 7.8 |
<0.001 |
|
Persistent T2DM |
80.2 ± 10.1 |
79.8 ± 10.0 |
79.1 ± 9.9 |
78.5 ± 9.8 |
||
|
Waist circumference, cm |
Remission |
97.2 ± 8.3 |
93.8 ± 8.0 |
89.4 ± 7.9 |
86.4 ± 7.8 |
<0.001 |
|
Persistent T2DM |
101.4 ± 8.9 |
101.1 ± 8.8 |
100.4 ± 8.8 |
99.8 ± 8.7 |
||
|
Glucose-lowering medications, number |
Remission |
1.8 ± 0.6 |
1.3 ± 0.5 |
0.5 ± 0.5 |
0.0 |
<0.001 |
|
Persistent T2DM |
1.9 ± 0.6 |
2.0 ± 0.7 |
2.1 ± 0.7 |
2.2 ± 0.8 |
Data are presented as mean ± standard deviation. Group-by-time P values were obtained using mixed-effects regression models containing participant-level random intercepts and fixed effects for group, time and group-by-time interaction.
DNA methylation and microRNA profiles
Targeted epigenetic analysis identified significant differences in promoter methylation across the three study groups. Participants with persistent T2DM demonstrated greater methylation of PDX1, PPARG, IRS1 and SIRT1 regulatory regions than healthy controls. Methylation levels in the remission group were significantly lower than in persistent T2DM and were closer to the values observed among healthy controls. The inflammatory genes IL6 and TNF also demonstrated higher promoter methylation percentages in persistent T2DM. However, the functional effect of methylation depends on the exact genomic position and should be interpreted together with gene-expression and histone-modification findings. MicroRNA analysis showed that miR-126 expression was reduced in persistent T2DM compared with the remission and healthy-control groups. In contrast, miR-375, miR-21, miR-146a and miR-29 were elevated in persistent T2DM. The remission group demonstrated intermediate expression profiles that were generally closer to healthy controls. After controlling for multiple comparisons using the Benjamini–Hochberg procedure, the differences in PDX1, PPARG, IRS1, SIRT1 and IL6 methylation and miR-126 expression remained statistically significant.
Table 4. Epigenetic and microRNA biomarkers according to study group
|
Molecular biomarker |
T2DM remission |
Persistent T2DM |
Healthy controls |
P value |
FDR-adjusted P value |
|
PDX1 promoter methylation, % |
19.8 ± 4.1 |
31.6 ± 6.4 |
16.9 ± 3.7 |
<0.001 |
0.003 |
|
PPARG promoter methylation, % |
22.4 ± 4.8 |
34.7 ± 7.0 |
20.1 ± 4.2 |
<0.001 |
0.003 |
|
IRS1 promoter methylation, % |
24.1 ± 5.0 |
35.2 ± 6.8 |
21.6 ± 4.6 |
<0.001 |
0.004 |
|
SIRT1 promoter methylation, % |
18.6 ± 3.9 |
28.9 ± 5.8 |
16.2 ± 3.4 |
<0.001 |
0.004 |
|
IL6 promoter methylation, % |
27.5 ± 5.7 |
39.4 ± 7.5 |
24.8 ± 5.1 |
<0.001 |
0.005 |
|
TNF promoter methylation, % |
25.8 ± 5.3 |
37.9 ± 8.0 |
23.5 ± 4.9 |
0.001 |
0.008 |
|
miR-375 relative expression |
1.18 ± 0.27 |
1.73 ± 0.43 |
1.00 ± 0.19 |
0.003 |
0.014 |
|
miR-126 relative expression |
0.94 ± 0.21 |
0.58 ± 0.17 |
1.00 ± 0.18 |
<0.001 |
0.005 |
|
miR-21 relative expression |
1.11 ± 0.24 |
1.64 ± 0.39 |
1.00 ± 0.20 |
0.004 |
0.016 |
|
miR-146a relative expression |
1.08 ± 0.25 |
1.52 ± 0.37 |
1.00 ± 0.21 |
0.015 |
0.033 |
|
miR-29 relative expression |
1.09 ± 0.23 |
1.49 ± 0.35 |
1.00 ± 0.20 |
0.012 |
0.030 |
Data are presented as mean ± standard deviation. MicroRNA expression was calculated relative to the healthy-control calibrator. Overall group comparisons were performed using analysis of variance or the Kruskal–Wallis test. FDR, false discovery rate; IRS1, insulin receptor substrate 1; PDX1, pancreatic and duodenal homeobox 1; PPARG, peroxisome proliferator-activated receptor gamma; SIRT1, sirtuin 1; TNF, tumour necrosis factor.
Telomere length, telomerase activity and gene expression
Relative leukocyte telomere length was significantly lower in persistent T2DM than in the remission and healthy-control groups. Participants in remission had a mean telomere-to-single-copy-gene ratio that was lower than that of healthy controls but substantially higher than that of participants with persistent diabetes. Telomerase activity followed a similar pattern. The persistent T2DM group demonstrated reduced telomerase activity, whereas the remission group had greater activity approaching the healthy-control level. TERT and TERC expression were also reduced in persistent T2DM. Genes involved in mitochondrial biogenesis, metabolic sensing and cellular stress responses showed favourable expression patterns in the remission group. SIRT1, PGC-1α and AMPK expression were higher in remission than in persistent T2DM. Conversely, mTOR expression was greater in persistent T2DM. These molecular differences remained significant after adjustment for age and sex, although several associations were weakened after additional adjustment for body mass index and diabetes duration.
Table 5. Telomere, telomerase and metabolic gene-expression measurements
|
Biomarker |
T2DM remission |
Persistent T2DM |
Healthy controls |
P value |
|
Relative telomere length, T/S ratio |
0.92 ± 0.14 |
0.71 ± 0.12 |
1.00 ± 0.13 |
<0.001 |
|
Telomerase activity, relative units |
1.21 ± 0.26 |
0.66 ± 0.19 |
1.00 ± 0.22 |
<0.001 |
|
TERT relative expression |
1.18 ± 0.25 |
0.69 ± 0.20 |
1.00 ± 0.21 |
<0.001 |
|
TERC relative expression |
1.10 ± 0.22 |
0.77 ± 0.18 |
1.00 ± 0.20 |
0.004 |
|
SIRT1 relative expression |
1.15 ± 0.24 |
0.72 ± 0.19 |
1.00 ± 0.18 |
<0.001 |
|
PGC-1α relative expression |
1.12 ± 0.23 |
0.68 ± 0.17 |
1.00 ± 0.19 |
<0.001 |
|
AMPK relative expression |
1.09 ± 0.21 |
0.74 ± 0.18 |
1.00 ± 0.17 |
0.002 |
|
mTOR relative expression |
0.93 ± 0.19 |
1.41 ± 0.32 |
1.00 ± 0.20 |
0.003 |
Values are presented as mean ± standard deviation. Gene-expression values were normalised against validated reference genes and expressed relative to the healthy-control calibrator. AMPK, adenosine monophosphate-activated protein kinase; mTOR, mechanistic target of rapamycin; PGC-1α, peroxisome proliferator-activated receptor gamma coactivator 1-alpha; TERC, telomerase RNA component; TERT, telomerase reverse transcriptase; T/S ratio, telomere-to-single-copy-gene ratio.
Integrated biomarker associations and predictive performance
Exploratory penalised logistic regression identified percentage weight loss, lower HbA1c, lower SIRT1 promoter methylation, greater telomerase activity and longer relative telomere length as the strongest variables associated with remission. For every 5% greater reduction in body weight, the adjusted odds of remission increased approximately fourfold. Lower inflammatory activity was also associated with remission, although the confidence intervals were wide because only 20 participants were included in the remission-versus-persistent T2DM analysis. Among the exploratory prediction algorithms, the least absolute shrinkage and selection operator model demonstrated the highest cross-validated discrimination, with an area under the receiver operating characteristic curve of 0.90. Random Forest and Extreme Gradient Boosting achieved areas under the curve of 0.88 and 0.86, respectively. The combined clinical and molecular model performed better than the clinical-only model. However, these estimates are likely to be optimistic because of the small number of participants. The models should therefore be considered hypothesis-generating and require validation in a substantially larger independent cohort.
Table 6. Exploratory associations with T2DM remission and prediction-model performance
Panel A. Biomarkers associated with remission
|
Predictor |
Unit of comparison |
Adjusted odds ratio |
95% confidence interval |
P value |
|
Weight reduction |
Per 5% greater loss |
3.84 |
1.42–10.39 |
0.008 |
|
HbA1c |
Per 1% lower value |
2.91 |
1.22–6.96 |
0.016 |
|
SIRT1 promoter methylation |
Per 5% lower methylation |
2.47 |
1.12–5.44 |
0.025 |
|
Telomerase activity |
Per 0.2-unit increase |
2.62 |
1.15–5.99 |
0.022 |
|
Relative telomere length |
Per 0.1-unit increase |
2.11 |
1.05–4.24 |
0.036 |
|
High-sensitivity CRP |
Per 1 mg/L lower value |
1.74 |
1.03–2.95 |
0.039 |
Odds ratios were obtained from exploratory penalised logistic regression comparing the remission and persistent T2DM groups. Estimates were adjusted for age, sex and diabetes duration. CRP, C-reactive protein; HbA1c, glycated haemoglobin; SIRT1, sirtuin 1.
Panel B. Cross-validated prediction performance
|
Prediction model |
Input variables |
AUC |
Sensitivity, % |
Specificity, % |
Brier score |
|
Clinical logistic regression |
Clinical variables only |
0.81 |
80 |
70 |
0.19 |
|
Integrated logistic regression |
Clinical and molecular variables |
0.87 |
80 |
80 |
0.15 |
|
LASSO |
Clinical and molecular variables |
0.90 |
90 |
80 |
0.13 |
|
Random Forest |
Clinical and molecular variables |
0.88 |
80 |
80 |
0.14 |
|
XGBoost |
Clinical and molecular variables |
0.86 |
80 |
70 |
0.16 |
Performance estimates were generated using nested cross-validation. AUC, area under the receiver operating characteristic curve; LASSO, least absolute shrinkage and selection operator; XGBoost, Extreme Gradient Boosting. Greater percentage weight loss was positively correlated with telomerase activity and relative telomere length. It was negatively correlated with HbA1c, HOMA-IR, high-sensitivity C-reactive protein and SIRT1 promoter methylation. Telomerase activity was positively associated with TERT expression and relative telomere length. Higher HbA1c was associated with lower miR-126 expression and higher miR-375, miR-21 and miR-146a expression. Inflammatory biomarkers were positively correlated with methylation changes in inflammatory and metabolic regulatory genes. After correction for multiple testing, the strongest correlations were observed between HbA1c and HOMA-IR, telomerase activity and TERT expression, weight reduction and HbA1c decline, and SIRT1 methylation and SIRT1 gene expression.
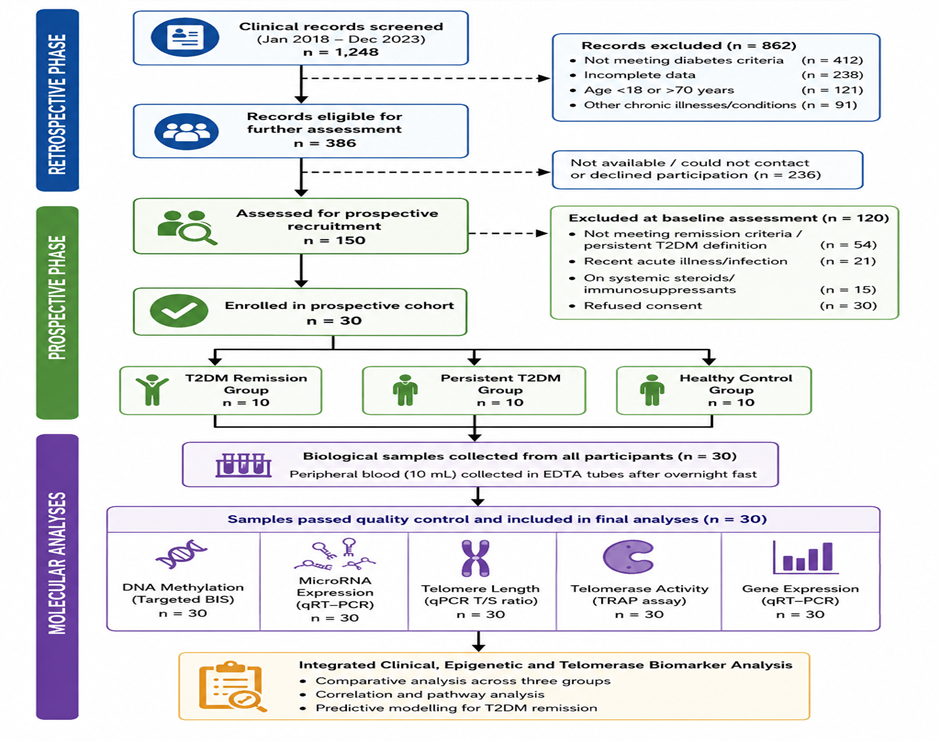
Figure 1. Participant recruitment and analytical flow of the hybrid retrospective–prospective cohort study
Figure 1. The flow diagram should show the number of clinical records assessed during the retrospective phase, reasons for record exclusion, participants evaluated for prospective recruitment and the final numbers included in the remission, persistent T2DM and healthy-control groups. It should also show the number of samples passing quality control for DNA methylation, microRNA, telomere-length, telomerase and gene-expression analyses.
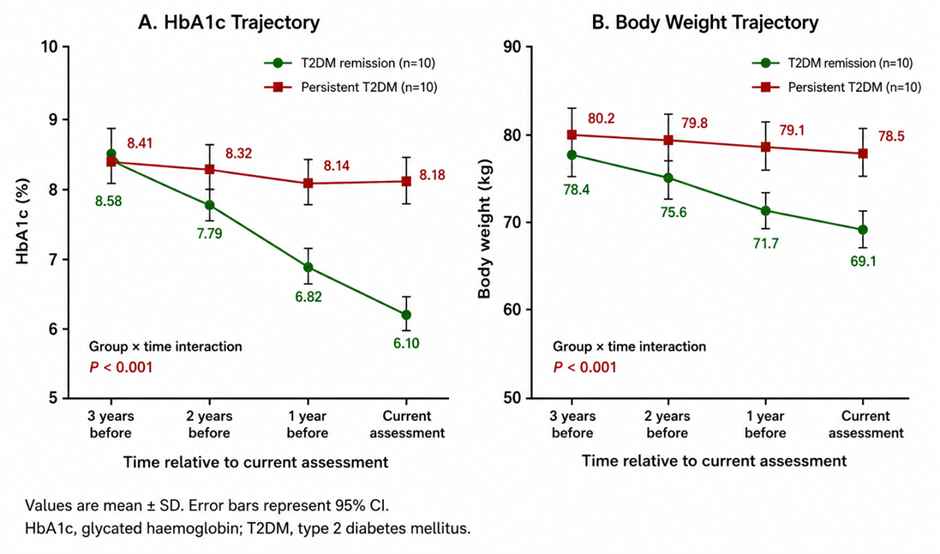
Figure 2. Three-year trajectories of HbA1c and body weight in participants with T2DM remission and persistent
Figure 2. Panel A should present mean HbA1c values at three years, two years and one year before recruitment and at the current assessment. Panel B should present mean body weight over the same period. Points should represent group means and error bars should represent 95% confidence intervals. The P value should indicate the group-by-time interaction obtained from mixed-effects regression.
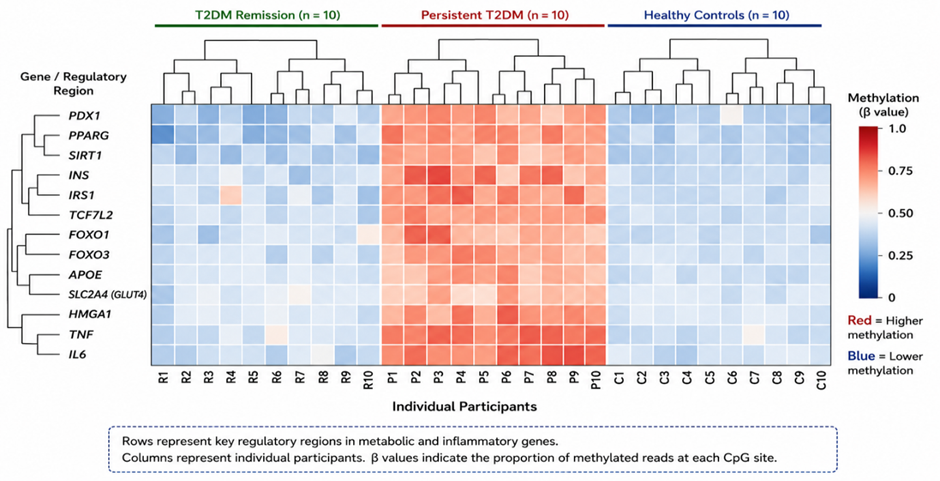
Figure 3. Heatmap of differentially methylated regulatory regions in participants with T2DM remission, persistent T2DM and healthy controls
Figure 3.Rows should represent CpG sites or summarised regulatory regions in INS, IRS1, PPARG, PDX1, TCF7L2, SIRT1, FOXO1, FOXO3, APOE, HMGA1, SLC2A4, TNF and IL6. Columns should represent individual participants. Values should be standardised methylation levels after quality control and batch correction. Unsupervised hierarchical clustering should be used for visualisation only.
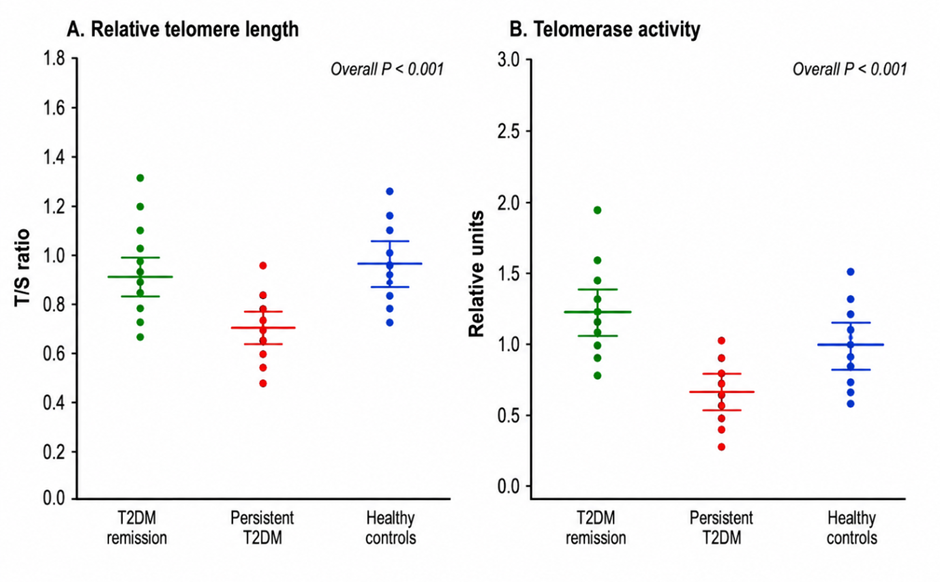
Figure 4. Relative telomere length and telomerase activity according to diabetes-remission status
Figure 4.Panel A should show the telomere-to-single-copy-gene ratio, and Panel B should show relative telomerase activity in the remission, persistent T2DM and healthy-control groups. Individual observations should be displayed together with group means and 95% confidence intervals. Overall group differences should be assessed using analysis of variance or the Kruskal–Wallis test.
DISCUSSION:
The present hybrid retrospective–prospective cohort study examined whether type 2 diabetes mellitus remission was associated with a combined profile of clinical recovery, reduced inflammation, altered epigenetic regulation, favourable microRNA expression, longer telomeres and greater telomerase activity. The principal findings indicated that participants in remission had lower HbA1c, fasting glucose, postprandial glucose, fasting insulin and HOMA-IR than participants with persistent T2DM. Remission was also associated with greater long-term weight loss, a lower inflammatory burden and molecular profiles that were generally closer to those observed in healthy controls. The integrated clinical and molecular models demonstrated better discrimination than clinical variables alone. Taken together, these findings support the hypothesis that diabetes remission may involve biological changes extending beyond the achievement of an HbA1c concentration below the diagnostic threshold.
The marked reduction in body weight among participants in remission was one of the strongest clinical findings. Over the three-year observation period, the remission group experienced a mean weight reduction of approximately 12%, together with progressive reductions in HbA1c, waist circumference and glucose-lowering medication use. In contrast, individuals with persistent T2DM showed only minor weight change and continued to have poor glycaemic control. These findings are biologically plausible because sustained negative energy balance can reduce ectopic fat accumulation, improve hepatic insulin sensitivity and support the recovery of pancreatic β-cell function. Lim et al. demonstrated that dietary energy restriction could normalise fasting glucose, hepatic insulin sensitivity and β-cell function in people with T2DM, with these changes occurring alongside reductions in liver and pancreatic triglyceride content [12].
The observed relationship between lower HOMA-IR and remission further suggests that improved insulin sensitivity contributed to the favourable glycaemic trajectory. Nevertheless, remission is unlikely to depend on weight loss alone. In the CORDIOPREV randomised trial, better baseline β-cell function and lower hepatic insulin resistance were major predictors of long-term remission, even in the absence of major weight loss [13]. Therefore, the ability to achieve remission may reflect both the magnitude of metabolic improvement and the remaining functional capacity of pancreatic β-cells.
The remission group had lower triglycerides and higher high-density lipoprotein cholesterol than the persistent T2DM group, indicating broader improvement in metabolic health. However, several measurements in the remission group remained intermediate between persistent T2DM and healthy controls. This suggests that clinical remission should not automatically be interpreted as complete metabolic normalisation. Individuals in remission may continue to carry residual cardiovascular, inflammatory and relapse risks, particularly when previous diabetes duration was long or when substantial β-cell dysfunction had already developed.
Participants with persistent T2DM had higher concentrations of high-sensitivity C-reactive protein, interleukin-6 and tumour necrosis factor-alpha. In comparison, inflammatory markers were lower in the remission group, although they did not consistently reach the levels observed in healthy controls. Chronic hyperglycaemia, visceral adiposity and insulin resistance can maintain low-grade inflammatory signalling. Therefore, the reduced inflammatory burden in the remission group may partly reflect weight loss, lower glucose exposure and improved insulin sensitivity.
These results are consistent with observations following metabolic bariatric surgery. Fachim et al. identified changes in inflammatory proteins and conventional inflammatory markers among patients who achieved T2DM remission after surgery, including a significant decline in interleukin-6 during follow-up [14]. Their findings support the possibility that diabetes remission is accompanied by changes in systemic immune and inflammatory pathways rather than by glycaemic improvement alone.
However, the present study cannot determine whether reduced inflammation contributed to remission or occurred as a consequence of improved metabolism. The direction of this relationship should be examined using repeated molecular measurements collected before, during and after remission. Future analyses should also adjust inflammatory associations for body mass index, waist circumference, smoking, infection, medication exposure and leukocyte composition.
The targeted methylation analysis showed greater methylation of PDX1, PPARG, IRS1, SIRT1, IL6 and TNF regulatory regions in persistent T2DM. Methylation levels in the remission group were lower and generally closer to those of healthy controls. These findings suggest that remission may be associated with partial attenuation of diabetes-related epigenetic alterations.
PDX1 is essential for pancreatic development, β-cell identity and insulin transcription. Yang et al. found increased methylation and reduced expression of PDX1 in pancreatic islets from donors with T2DM. PDX1 methylation was positively associated with HbA1c and negatively associated with PDX1 expression, while experimental promoter methylation reduced transcriptional activity [15]. These observations provide mechanistic support for the higher PDX1 methylation observed in the persistent T2DM group.
The wider methylation pattern is also supported by genome-wide evidence. Dayeh et al. identified 1,649 CpG sites in or near 853 genes with differential methylation in pancreatic islets from donors with and without T2DM. Several methylation changes were accompanied by altered gene expression and impaired hormone secretion [16]. Importantly, their study demonstrated that methylation changes in T2DM are highly dependent on the CpG site and genomic region. It would therefore be inappropriate to conclude that either general hypermethylation or hypomethylation alone characterises diabetes.
The lower methylation observed in the remission group may indicate that some adverse epigenetic signals are responsive to improved metabolic conditions. However, the present findings do not prove epigenetic reversal. The molecular analysis was cross-sectional, and baseline samples collected before remission were unavailable. Differences may have existed before remission and may represent susceptibility to successful metabolic recovery rather than a consequence of remission.
A further limitation is that DNA methylation was assessed in peripheral blood cells rather than pancreatic islets, skeletal muscle, liver or adipose tissue. Blood-based methylation may provide accessible biomarkers, but it does not necessarily represent regulatory changes within the primary metabolic tissues. Differences in circulating leukocyte populations may also influence methylation measurements. Cell-type adjustment and validation in an independent tissue or cohort would strengthen the biological interpretation.
The lower miR-126 expression observed in persistent T2DM may indicate impaired vascular and endothelial regulation. The remission group had miR-126 levels approaching those of healthy controls, suggesting that this marker may respond to improved glycaemic and inflammatory status.
Persistent T2DM was also associated with higher miR-375 expression. This is consistent with the findings of Higuchi et al., who reported increased circulating miR-375 in people with T2DM compared with participants with normal glucose tolerance [17]. Because miR-375 is highly enriched in pancreatic islets, an increase in the circulation may reflect altered β-cell regulation, cellular stress or β-cell injury.
The higher miR-21 and miR-29 expression in persistent T2DM may similarly reflect inflammatory, fibrotic or metabolic stress pathways. Nevertheless, circulating microRNA concentrations are influenced by the biological specimen, extraction method, haemolysis, reference control and normalisation strategy. A microRNA that is increased in serum may not show the same direction of change in plasma, peripheral blood mononuclear cells or a specific metabolic tissue.
An important inconsistency was the higher miR-146a expression observed in persistent T2DM. Balasubramanyam et al. reported reduced miR-146a expression in peripheral blood mononuclear cells from Asian Indian participants with T2DM. Reduced expression was associated with poor glycaemic control, insulin resistance and increased inflammatory signalling [18].
The difference may be explained by variation in sample type, disease duration, medication use, population characteristics or inflammatory stage. It is also possible that miR-146a increases temporarily as a compensatory response before becoming reduced during chronic inflammation. Consequently, the present miR-146a result should be interpreted cautiously and independently replicated.
Participants with persistent T2DM had the shortest relative telomere length and the lowest telomerase activity. The remission group had intermediate telomere length but greater telomerase activity than persistent T2DM. These findings suggest that poor metabolic control is associated with accelerated cellular ageing, whereas remission may be related to improved telomere-maintenance capacity.
Previous research in Asian Indian populations identified shorter telomeres in people with impaired glucose tolerance and diabetes-related macrovascular disease [19]. This is relevant to the present Kodagu population because it indicates that telomere attrition may be detectable during early metabolic impairment and may become more marked as diabetes progresses.
The greater telomerase activity observed in the remission group is biologically interesting. A pilot lifestyle study reported increased telomerase activity in peripheral blood mononuclear cells following comprehensive dietary, physical activity and stress-management changes [20]. Although that study was conducted in men with low-risk prostate cancer rather than diabetes, it provides evidence that telomerase activity may respond to sustained lifestyle modification.
Experimental evidence also supports a mechanistic relationship between telomerase and glucose metabolism. Kuhlow et al. showed that telomerase-deficient mice had shortened pancreatic-islet telomeres, reduced β-cell replication, impaired glucose-stimulated insulin secretion and glucose intolerance [21]. These findings do not establish the same causal pathway in humans, but they support the biological connection between telomere maintenance and β-cell function.
The cross-sectional measurements cannot demonstrate that telomeres became longer after remission. Telomere length changes slowly, and apparent group differences may reflect genetic background, baseline telomere length, age, smoking, oxidative stress, leukocyte distribution or assay variability. The more defensible interpretation is that remission was associated with longer relative telomere length and greater telomerase activity, not that remission reversed telomere shortening. Serial measurements are required to determine whether remission stabilises telomere attrition over time.
The remission group showed higher expression of TERT, TERC, SIRT1, PGC-1α and AMPK and lower expression of mTOR compared with persistent T2DM. This combined pattern may indicate improved cellular stress resistance, mitochondrial regulation and energy sensing. It also corresponds with the favourable clinical phenotype of lower HOMA-IR, reduced inflammation and better lipid control.
However, expression measurements in circulating cells cannot be directly interpreted as evidence of restored signalling in pancreatic β-cells, skeletal muscle or liver. Gene expression is sensitive to recent food intake, circadian timing, physical activity, medication use and blood-cell composition. These pathways should therefore be treated as candidate systemic biomarkers until their relationship with tissue-specific metabolism is validated.
The integrated clinical and molecular models performed better than the clinical-only model, and LASSO produced the highest cross-validated area under the receiver operating characteristic curve. The selected predictors suggest that remission may be best characterised through a combination of weight loss, current glycaemic control, DNA methylation, telomerase activity and telomere length rather than through a single biomarker.
Despite the apparently strong performance, these models must be considered exploratory. Only 20 participants contributed to the direct comparison between remission and persistent T2DM, while the number of candidate predictors was large. This creates a substantial risk of overfitting, unstable variable selection and optimistic performance estimates. Riley et al. emphasised that clinical prediction models require sample sizes that are sufficient relative to the number of candidate predictors and outcome events, rather than relying only on simple rules of thumb [22].
Nested cross-validation and penalisation reduce bias but cannot fully overcome an extremely small dataset. The reported areas under the curve should not be interpreted as evidence that the models are ready for clinical use. A larger development cohort and an independent external-validation cohort are required before any biomarker panel can be recommended for predicting T2DM remission.
Strengths and limitations
The main strength of the study is its integration of three years of clinical records with prospective biochemical and molecular measurements. This design permits clinical trajectories to be examined alongside epigenetic, microRNA, telomere and telomerase biomarkers. The inclusion of remission, persistent T2DM and healthy-control groups also helps distinguish markers of disease persistence from markers approaching a healthy metabolic state. The focus on Kodagu provides preliminary molecular evidence from a population that is rarely represented in diabetes-remission research.
Several limitations require attention. First, the prospective sample size was small and was designed primarily for exploratory biomarker discovery. Second, the molecular analyses were cross-sectional, limiting conclusions about temporal change and causality. Third, peripheral blood measurements may not represent pancreatic islets or other metabolic tissues. Fourth, residual confounding may remain from diet, physical activity, coffee consumption, smoking, alcohol use, medications, comorbidities and inflammatory conditions. Fifth, multiple molecular comparisons increase the risk of false-positive findings despite false-discovery-rate adjustment. Finally, the prediction models were internally evaluated only and require independent validation.
The findings suggest that T2DM remission may represent a multidimensional biological state rather than an isolated reduction in HbA1c. Weight loss, improved insulin sensitivity, lower inflammation, favourable epigenetic regulation and improved telomere-maintenance activity may jointly characterise individuals who achieve remission.
A validated biomarker panel could eventually help identify patients with a high probability of remission, distinguish stable remission from temporary glycaemic improvement and detect individuals at risk of relapse. However, the present results should be regarded as hypothesis-generating. Future studies should recruit larger and more diverse populations, collect samples before and after remission, repeat telomere and epigenetic measurements over time and validate the final biomarker model externally.
CONCLUSION:
T2DM remission in the Kodagu cohort was associated with substantial weight reduction, improved glycaemic control, reduced insulin resistance and a lower inflammatory burden. Participants in remission also demonstrated more favourable DNA-methylation, microRNA, telomere, telomerase and metabolic gene-expression profiles than participants with persistent T2DM. These findings support the concept that diabetes remission may involve partial recovery across several molecular systems.
Nevertheless, the small exploratory sample and cross-sectional molecular assessment prevent causal conclusions. The reported molecular markers should not yet be considered validated indicators of remission. Larger longitudinal studies are needed to determine whether these biomarkers predict remission, change as a result of remission or identify individuals who are more biologically capable of achieving sustained metabolic recovery.
REFERENCES:
1. Anjana RM, Unnikrishnan R, Deepa M, Pradeepa R, Tandon N, Das AK, et al.; ICMR-INDIAB Collaborative Study Group. Metabolic non-communicable disease health report of India: the ICMR-INDIAB national cross-sectional study (ICMR-INDIAB-17). Lancet Diabetes Endocrinol. 2023;11(7):474-489. doi:10.1016/S2213-8587(23)00119-5.
2. Riddle MC, Cefalu WT, Evans PH, Gerstein HC, Nauck MA, Oh WK, et al. Consensus report: definition and interpretation of remission in type 2 diabetes. Diabetes Care. 2021;44(10):2438-2444. doi:10.2337/dci21-0034.
3. Lean MEJ, Leslie WS, Barnes AC, Brosnahan N, Thom G, McCombie L, et al. Primary care-led weight management for remission of type 2 diabetes (DiRECT): an open-label, cluster-randomised trial. Lancet. 2018;391(10120):541-551. doi:10.1016/S0140-6736(17)33102-1.
4. Lean MEJ, Leslie WS, Barnes AC, Brosnahan N, Thom G, McCombie L, et al. Durability of a primary care-led weight-management intervention for remission of type 2 diabetes: 2-year results of the DiRECT open-label, cluster-randomised trial. Lancet Diabetes Endocrinol. 2019;7(5):344-355. doi:10.1016/S2213-8587(19)30068-3.
5. Taylor R, Al-Mrabeh A, Zhyzhneuskaya S, Peters C, Barnes AC, Aribisala BS, et al. Remission of human type 2 diabetes requires decrease in liver and pancreas fat content but is dependent upon capacity for β-cell recovery. Cell Metab. 2018;28(4):547-556.e3. doi:10.1016/j.cmet.2018.07.003.
6. Chambers JC, Loh M, Lehne B, Drong A, Kriebel J, Motta V, et al. Epigenome-wide association of DNA methylation markers in peripheral blood from Indian Asians and Europeans with incident type 2 diabetes: a nested case-control study. Lancet Diabetes Endocrinol. 2015;3(7):526-534. doi:10.1016/S2213-8587(15)00127-8.
7. Nadiger N, Veed JK, Nataraj PC, Mukhopadhyay A. DNA methylation and type 2 diabetes: a systematic review. Clin Epigenetics. 2024;16(1):67. doi:10.1186/s13148-024-01670-6.
8. Zampetaki A, Kiechl S, Drozdov I, Willeit P, Mayr U, Prokopi M, et al. Plasma microRNA profiling reveals loss of endothelial miR-126 and other microRNAs in type 2 diabetes. Circ Res. 2010;107(6):810-817. doi:10.1161/CIRCRESAHA.110.226357.
9. Zvereva MI, Shcherbakova DM, Dontsova OA. Telomerase: structure, functions, and activity regulation. Biochemistry (Mosc). 2010;75(13):1563-1583. doi:10.1134/S0006297910130055.
10. Zhao J, Miao K, Wang H, Ding H, Wang DW. Association between telomere length and type 2 diabetes mellitus: a meta-analysis. PLoS One. 2013;8(11). doi:10.1371/journal.pone.0079993.
11. Cheng F, Luk AOY, Shi M, Huang C, Jiang G, Yang A, et al. Shortened leukocyte telomere length is associated with glycaemic progression in type 2 diabetes: a prospective and Mendelian randomisation analysis. Diabetes Care. 2022;45(3):701-709. doi:10.2337/dc21-1609.
12. Lim EL, Hollingsworth KG, Aribisala BS, Chen MJ, Mathers JC, Taylor R. Reversal of type 2 diabetes: normalisation of beta cell function in association with decreased pancreas and liver triacylglycerol. Diabetologia. 2011;54(10):2506-2514. doi:10.1007/s00125-011-2204-7.
13. Roncero-Ramos I, Gutierrez-Mariscal FM, Gomez-Delgado F, Villasanta-Gonzalez A, Torres-Peña JD, De La Cruz-Ares S, et al. Beta cell functionality and hepatic insulin resistance are major contributors to type 2 diabetes remission and starting pharmacological therapy: from CORDIOPREV randomized controlled trial. Transl Res. 2021;238:12-24. doi:10.1016/j.trsl.2021.07.001.
14. Fachim HA, Iqbal Z, Gibson JM, Baricevic-Jones I, Campbell AE, Geary B, et al. Relationship between the plasma proteome and changes in inflammatory markers after bariatric surgery. Cells. 2021;10(10):2798. doi:10.3390/cells10102798.
15. Yang BT, Dayeh TA, Volkov PA, Kirkpatrick CL, Malmgren S, Jing X, et al. Increased DNA methylation and decreased expression of PDX-1 in pancreatic islets from patients with type 2 diabetes. Mol Endocrinol. 2012;26(7):1203-1212. doi:10.1210/me.2012-1004.
16. Dayeh T, Volkov P, Salö S, Hall E, Nilsson E, Olsson AH, et al. Genome-wide DNA methylation analysis of human pancreatic islets from type 2 diabetic and non-diabetic donors identifies candidate genes that influence insulin secretion. PLoS Genet. 2014;10(3). doi:10.1371/journal.pgen.1004160.
17. Higuchi C, Nakatsuka A, Eguchi J, Teshigawara S, Kanzaki M, Katayama A, et al. Identification of circulating miR-101, miR-375 and miR-802 as biomarkers for type 2 diabetes. Metabolism. 2015;64(4):489-497. doi:10.1016/j.metabol.2014.12.003.
18. Balasubramanyam M, Aravind S, Gokulakrishnan K, Prabu P, Sathishkumar C, Ranjani H, et al. Impaired miR-146a expression links subclinical inflammation and insulin resistance in type 2 diabetes. Mol Cell Biochem. 2011;351(1-2):197-205. doi:10.1007/s11010-011-0727-3.
19. Adaikalakoteswari A, Balasubramanyam M, Ravikumar R, Deepa R, Mohan V. Association of telomere shortening with impaired glucose tolerance and diabetic macroangiopathy. Atherosclerosis. 2007;195(1):83-89. doi:10.1016/j.atherosclerosis.2006.12.003.
20. Ornish D, Lin J, Daubenmier J, Weidner G, Epel E, Kemp C, et al. Increased telomerase activity and comprehensive lifestyle changes: a pilot study. Lancet Oncol. 2008;9(11):1048-1057. doi:10.1016/S1470-2045(08)70234-1.
21. Kuhlow D, Florian S, von Figura G, Weimer S, Schulz N, Petzke KJ, et al. Telomerase deficiency impairs glucose metabolism and insulin secretion. Aging (Albany NY). 2010;2(10):650-658. doi:10.18632/aging.100200.
22. Riley RD, Ensor J, Snell KIE, Harrell FE Jr, Martin GP, Reitsma JB, et al. Calculating the sample size required for developing a clinical prediction model. BMJ. 2020;368. doi:10.1136/bmj.m441.