A PROSPECTIVE OBSERVATIONAL STUDY IN INDIAN POPULATION FOR ASSESSMENT OF THE SENSITIVITY AND SPECIFICITY OF PROSTATE HEALTH INDEX IN PATIENTS HAVING GREY ZONE PSA (4-10) AND PIRAD-3 MRI LESION AND UNDERGOING PROSTATE BIOPSY IN CLINICALLY SIGNIFICANT CARCINOMA PROSTATE.
- Krishan Suyal , Consultant Urologist, Department of Urology, Zeel hospital Sagwara.
- Yajuvendra Pratap Singh Rana , Senior Director, Department of Urology and Renal Transplant BLK Max Hospital, New Delhi.
- Swatantra Nagendra Rao , Senior Consultant, Department of Urology and Renal Transplant BLK Max Hospital, New Delhi.
- Bhabhtosh Das , Consultant, Department of Urology and Renal Transplant BLK Max Hospital, New Delhi.
- Deepak Taneja , Consultant Urologist, Department of Urology, PP Maniya Hospital, Surat.
Article Information:
Abstract:
Background: Prostate cancer (PCa) is the second most common cancer in men, with rising incidence, particularly in Asia. Prostate Health Index (PHI) is a promising biomarker that combines total PSA (tPSA), free PSA (fPSA), and [-2] pro PSA (p2PSA) to improve detection accuracy, reducing unnecessary biopsies. This study aims to assess PHI’s sensitivity and specificity in guiding transrectal ultrasound (TRUS) biopsies in patients with PSA levels between 4-10 ng/mL and PI-RADS 3 lesions. Material and Methods: This prospective observational study enrolled 100 patients aged >50 years, diagnosed with prostate carcinoma, and presenting with PSA levels of 4-10 ng/mL or suspicious digital rectal examinations. Multiparametric MRI (mpMRI) was performed, and PHI testing was conducted. TRUS biopsies were advised for all patients with PI-RADS scores ≥3. Sensitivity, specificity, positive predictive value (PPV), negative predictive value (NPV), and accuracy of PHI were calculated. Results: PHI demonstrated high sensitivity and specificity for predicting biopsy outcomes in different PI-RADS categories. For PI-RADS-3 patients, a PHI cutoff of >36 showed sensitivity of 85%, specificity of 66.7%, and an overall accuracy of 73.6%. For PI-RADS-4 and -5 patients, the accuracy improved to 88.2% and 92.3%, respectively. PHI was found to be a reliable predictor for clinically significant prostate cancer (csPCa), helping avoid unnecessary biopsies in PI-RADS 3 patients with a negative PHI result. Conclusion: PHI enhances the diagnostic accuracy of prostate cancer screening, particularly in men with PSA levels of 4–10 ng/mL, by improving the specificity of detecting clinically significant cancers and minimizing unnecessary biopsies. It is a valuable tool for clinical decision-making, especially in patients with equivocal or non-suspicious MRI findings.
Keywords:
Article :
INTRODUCTION:
Prostate cancer (PCa) is the second most common cancer in men worldwide, following lung cancer, representing 15% of all male cancers. [1] It also ranks as the sixth leading cause of cancer-related deaths, making up 7.4% of cancer fatalities. [2] Over recent years, PCa incidence in Asia has risen, with cases expected to double by 2030. [3] The value of prostate cancer screening remains contested among uro-oncologists, with discussions balancing its benefits against cost-effectiveness. Studies like the European Randomized Study of Screening for Prostate Cancer (ERSPC) and the GÖTEBORG-1 trial, both initiated in the 1990s, used PSA testing followed by systematic biopsies via transrectal ultrasonography. These trials showed reduced PCa mortality but also revealed a significant risk of overdiagnosis. [4]
Guidelines now recommend using risk stratification tools, such as biomarkers, risk calculators, and MRI, to improve the screening process. These tools help in decision-making, reducing unnecessary biopsies, and differentiating between aggressive and non-aggressive cancers. [5]
Among these biomarkers, the Prostate Health Index (PHI) is a notable advancement for predicting positive biopsy results. Approved by the FDA in 2012, PHI combines total PSA (tPSA), free PSA (fPSA), and [-2] pro PSA (p2PSA) into one score, aiding in distinguishing prostate carcinoma from benign conditions. [6] Research shows that PHI offers greater diagnostic accuracy than traditional PSA measures. [7,8] Multiparametric MRI (mpMRI) has become essential in prostate cancer (PCa) diagnosis, aiding in detection, localization, risk stratification, and staging. The Prostate Imaging Reporting and Data System version 2 (PI-RADS v2) helps identify clinically significant prostate cancer (csPCa) and guides biopsy decisions. [9,10] However, PI-RADS 3 lesions present challenges as they fall into a “grey zone” with a low positive predictive value for csPCa. [11] Despite MRI’s specificity, it has limited sensitivity for detecting extracapsular extension and metastases, and does not eliminate the need for pelvic lymph node dissection. [12]
Optimizing PCa diagnostics should focus on identifying csPCa to minimize patient burden while ensuring cost-effectiveness and acceptability for patients and healthcare providers. Clinically insignificant PCa is defined by the ‘Epstein’ criteria: Gleason score 3 + 3 = 6 (GrG1), fewer than two affected cores with <50% involvement, and PSA density <0.15 ng/ml per cm³. [13] Biomarkers, particularly PHI, show promise in reducing unnecessary biopsies without missing aggressive cancers. [14] However, data on combining PHI with mpMRI, particularly in patients stratified by PI-RADS, remain limited. [15,16] To address this gap, we conducted a prospective observational study in an Indian cohort with elevated PSA levels to assess PHI’s sensitivity and specificity in guiding TRUS biopsies, aiming to decrease negative biopsies in the PI-RADS 3 and PSA grey zone (4-10 ng/ml).
MATERIALS AND METHODS:
This prospective comparative study was conducted in the Department of Urology at Dr. BL Kapur Memorial Hospital, New Delhi, after obtaining approval from the institutional ethics committee. We enrolled 100 patients over age 50 diagnosed with prostate carcinoma who presented at the outpatient department, based on specific inclusion and exclusion criteria. Informed written consent was secured from each participant, with explanations provided in their native language to outline the procedure’s benefits and risks.
Inclusion Criteria
• All patients with age > 50 with 1.PSA 4-10ng/ml or
• Suspicious digital rectal examination, irrespective of PSA levels
• mpMRI – PIRAD- 3
• Patient who gave written Informed consent for the study
Exclusion criteria
• Patients less than 50 years of age.
• Acute prostatitis, UTI and Advanced stage carcinoma prostate.
• Patient on 5- alpha reductase inhibitors, unwilling or uncooperative patients
Methodology
All patients underwent a thorough evaluation that included their clinical history, a complete physical examination, and both routine and specific investigations to assess suspected prostate carcinoma. These investigations comprised complete blood counts, renal and liver function tests, total PSA, free PSA, pro-PSA, viral markers, coagulation profile, urine analysis (routine and microscopy), urine culture and sensitivity, ultrasound of the KUB region, and multiparametric MRI. The findings were systematically documented in the case-record proforma.
PHI score
The Beckman Coulter Prostate Health Index (phi) combines the results of three quantitative kallikrein immunoassays, total PSA (tPSA), free PSA (fPSA), and [-2] pro PSA (p2PSA) into a single numerical score –
PHI score: - (P2PSA/FPSA × √TPSA).
All patients underwent above mentioned test and patients with PIRADS Score≥ 3, irrespective of PHI score shall be advised for TRUS guided prostate biopsy (standard 12 Core + Suspicious lesion). Sensitivity and specificity of PHI was interpreted.
Statistical Analysis
Data analysis was performed using IBM SPSS Statistics version 22.0 for Windows (SPSS Inc; IBM, Chicago, IL, USA). Continuous variables are presented as Mean ± SD (Min-Max), and categorical variables as numbers (percentages). Quantitative data were analyzed using parametric or non-parametric tests based on normality. Sensitivity, specificity, PPV, and NPV were calculated to assess correlations, while the ROC curve determined the cutoff for positive cases. True positive and negative cases were identified based on these cut-offs. Chi-square tests were used for categorical variable associations, and a P value < 0.05 was considered statistically significant.
RESULTS:
A total of 116 patients with PSA levels between 4-10 ng/mL were initially recruited, all undergoing mpMRI and Prostate Health Index (PHI) testing per protocol. Sixteen patients with PIRADS-2 scores on mpMRI were excluded from the study, leaving a final sample of 100 patients for analysis.
Clinicodemographic Profile: The age distribution shows that the largest proportion of patients (31%) fell within the 65-70 years age group. This was followed by the 55-60 and 60-65 age groups, each comprising 23% of the sample. The smallest groups were the 50-55 years and ≥70 years categories, representing 11-12% of the patients. The PIRADS scoring distribution revealed that 53% of patients were categorized as PIRADS-3, 34% as PIRADS-4, and 13% as PIRADS-5. This indicates a higher concentration of patients in the intermediate-risk category (PIRADS-3). In the TRUS-guided biopsy results for the 100 patients, 41 (41%) were confirmed positive for prostate adenocarcinoma, while 59 (59%) had negative results. Patients with findings deemed clinically insignificant by the Epstein criteria were classified within the negative group, resulting in a final count of 41 positive and 59 negative cases. (Table 1)
Table 1. Clinicodemographic profile of the study participants
|
Parameter |
Frequency |
Percent |
|
Age Group |
||
|
50-55 Years |
11 |
11.0 |
|
55-60 Years |
23 |
23.0 |
|
60-65 Years |
23 |
23.0 |
|
65-70 Years |
31 |
31.0 |
|
>=70 Years |
12 |
12.0 |
|
PIRADS Score |
||
|
PIRADS-3 |
53 |
53.0 |
|
PIRADS-4 |
34 |
34.0 |
|
PIRADS-5 |
13 |
13.0 |
|
TRUS Biopsy Outcome |
||
|
Positive |
41 |
41.0 |
|
Negative |
59 |
59.0 |
Sensitivity, Specificity of PHI for PIRADS-3 Patients: A statistically significant association was observed between positive and negative cases as per PHI cutoff value and TRUS Biopsy score. (P<0.05) As per the ROC curve the cutoff value of PHI for PIRADS -3 patients was found to be >36 and area under curve was 72%. The cases having PHI value >36 was considered as positive cases, whereas cases having PHI value ≤36 were considered as negative cases. The PHI value showed higher sensitivity of 85%, with PPV of 60.7% for predicting positive cases (according to TRUS biopsy), along with moderate specificity of 66.7% but higher NPV of 88% for predicting negative cases. The overall accuracy for PHI value was high i.e. 73.6% which showed - PHI value can be used as one of the methods for predicting PIRADS-3 outcomes. (Table 2, Graph 1)
Table 2. Measure of Sensitivity, Specificity of PHI for PIRADS-3 Patients
|
PHI Outcome |
TRUS Biopsy Outcome |
Total |
|
|
|
Positive |
Negative |
|
|
Positive (>36) |
17 (85%) |
11 (33.3%) |
28 (52.8%) |
|
Negative (≤36) |
3 (15%) |
22 (66.7%) |
25 (47.2%) |
|
P value (Pearson Chi-Square) |
0.000 |
Significant |
|
|
Sensitivity |
85.0% |
||
|
Specificity |
66.7% |
||
|
PPV |
60.7% |
||
|
NPV |
88.0% |
||
|
Accuracy |
73.6% |
||
|
Area Under ROC Curve |
72.0% |
||
|
ROC Cutoff Value |
>36 |
||
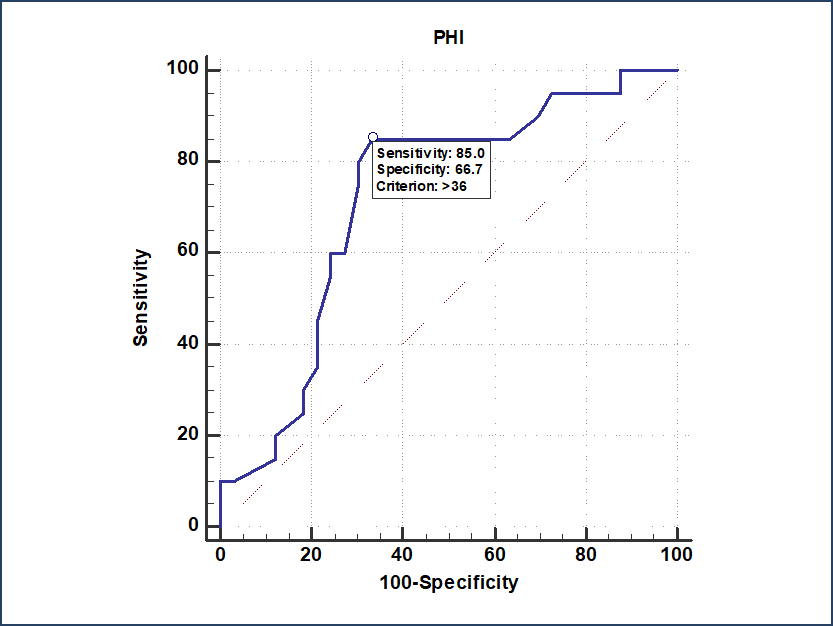
Graph 1. ROC CURVE ANALYSIS of PHI for PIRADS-3 Patients
Sensitivity, Specificity of PHI for PIRADS-4 Patients: A statistically significant association was observed between positive and negative cases as per PHI cutoff value and TRUS Biopsy score. (P<0.05) As per the ROC curve the cut-off value of PHI for PIRADS -4 patients was found to be >39 and area under curve was 92.7%. The cases having PHI value >39 was considered as positive cases, whereas cases having PHI value ≤39 were considered as negative cases. The PHI value shows the higher sensitivity of 92.3%, with PPV of 80% for predicting positive cases, along with higher specificity of 85.7% and higher NPV of 94.7% for predicting negative cases. The overall accuracy for PHI value was ≥ 88.2% which shows that PHI value can be used as one of the methods for predicting the PIRADS-4 outcomes. (Table 3, Graph 2)
Table 3. Measure of Sensitivity, Specificity of PHI for PIRADS-4 Patients
|
PHI Outcome |
TRUS Biopsy Outcome |
Total |
|
|
|
Positive |
Negative |
|
|
Positive (>39) |
12 (92.3%) |
3 (14.3%) |
15 (44.1%) |
|
Negative (≤39) |
1 (7.7%) |
18 (85.7%) |
19 (55.9%) |
|
P value (Pearson Chi-Square) |
0.000 |
Significant |
|
|
Sensitivity |
92.3% |
||
|
Specificity |
85.7% |
||
|
PPV |
80.0% |
||
|
NPV |
94.7% |
||
|
Accuracy |
88.2% |
||
|
Area Under ROC Curve |
92.7% |
||
|
ROC Cutoff Value |
>39 |
||
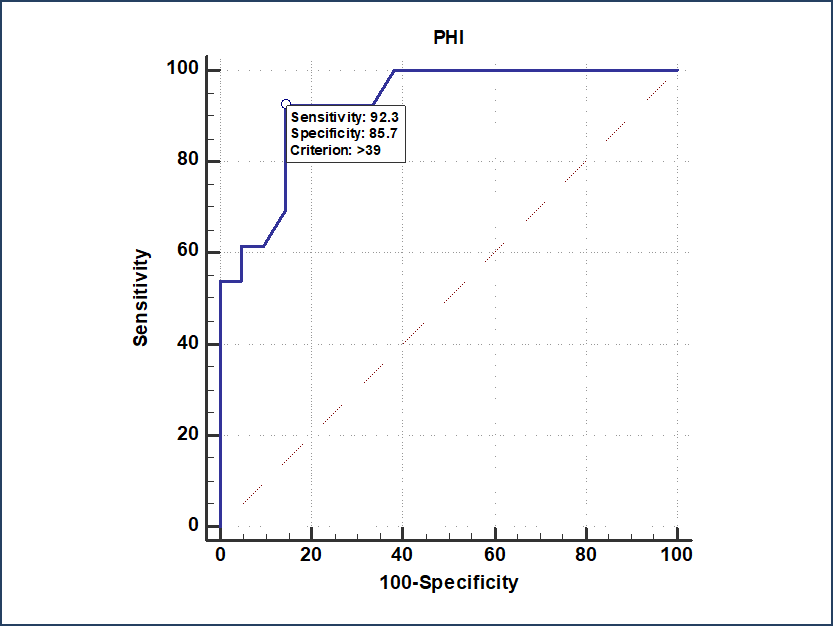
Graph 2. ROC CURVE ANALYSIS of PHI for PIRADS-4 Patients
Sensitivity, Specificity of PHI for PIRADS-5 Patients: A statistically significant association was observed between positive and negative cases as per PHI cut-off value and TRUS Biopsy score. (P<0.05) As per the ROC curve the cut-off value of PHI for PIRADS -5 patients was found to be >40 and area under curve was 91.7%. The cases having PHI value >40 was considered as positive cases, whereas cases having PHI value ≤40 were considered as negative cases. The PHI value shows the higher sensitivity of 100%, with PPV of 88.9% for predicting positive cases, along with higher specificity of 80% and higher NPV of 100% for predicting negative cases. The overall accuracy for PHI value was ≥92.3% which shows that PHI value can be used as one of the methods for predicting the PIRADS-5 outcomes. (Table 4, Graph 3)
Table 4. Measure of Sensitivity, Specificity of PHI for PIRADS-5 Patients
|
PHI Outcome |
TRUS Biopsy Outcome |
Total |
|
|
|
Positive |
Negative |
|
|
Positive (>40) |
8 (100%) |
1 (20%) |
9 (69.2%) |
|
Negative (≤40) |
0 (0%) |
4 (4%) |
4 (30.8%) |
|
P value (Pearson Chi-Square) |
0.002 |
Significant |
|
|
Sensitivity |
100.0% |
||
|
Specificity |
80.0% |
||
|
PPV |
88.9% |
||
|
NPV |
100.0% |
||
|
Accuracy |
92.3% |
||
|
Area Under ROC Curve |
91.3% |
||
|
ROC Cutoff Value |
>40 |
||
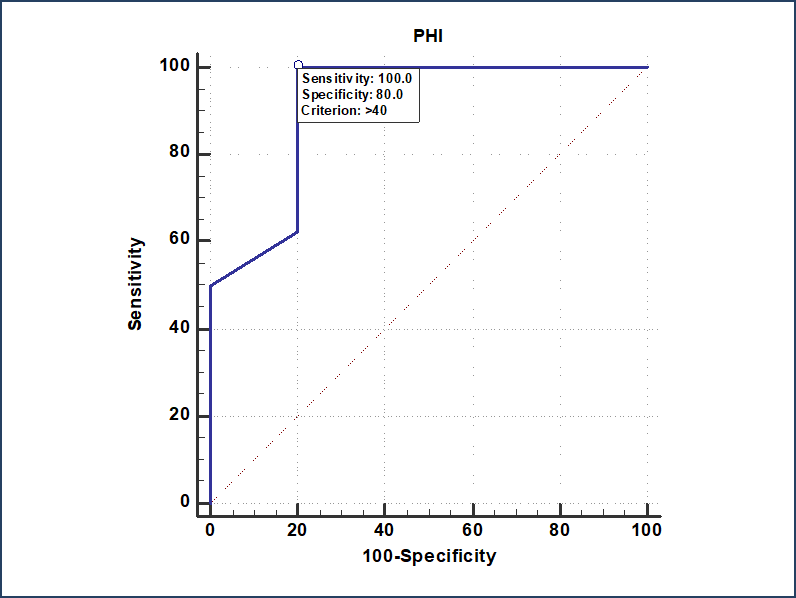
Graph 3. ROC CURVE ANALYSIS of PHI for PIRADS-5 Patients
Sensitivity, Specificity of PHI for all PIRADS Patients: A statistically significant association was observed between positive and negative cases as per PHI cut-off value and TRUS Biopsy score. (P<0.05) As per the ROC curve the cutoff value of PHI was found to be >39 and area under curve was 82.6%. The cases having PHI value >39 was considered as positive cases, whereas cases having PHI value ≤39 were considered as negative cases. The PHI value shows the higher sensitivity of 87.8%, with PPV of 69.2% for predicting positive cases, along with higher specificity of 72.9% and higher NPV of 89.6% for predicting negative cases. The overall accuracy for PHI value was ≥79% which shows that PHI value can be used as one of the methods for predicting the outcomes. (Table 5, Graph 4)
Table 5. Measure of Sensitivity, Specificity of PHI for all PIRADS Patients
|
PHI Outcome |
TRUS Biopsy Outcome |
Total |
|
|
|
Positive |
Negative |
|
|
Positive (>39) |
36 (87.8%) |
16 (27.1%) |
52 (52%) |
|
Negative (≤39) |
5 (12.2%) |
43 (72.9%) |
48 (48%) |
|
P value (Pearson Chi-Square) |
0.000 |
Significant |
|
|
Sensitivity |
87.8% |
||
|
Specificity |
72.9% |
||
|
PPV |
69.2% |
||
|
NPV |
89.6% |
||
|
Accuracy |
79.0% |
||
|
Area Under ROC Curve |
82.6% |
||
|
ROC Cutoff Value |
>39 |
||
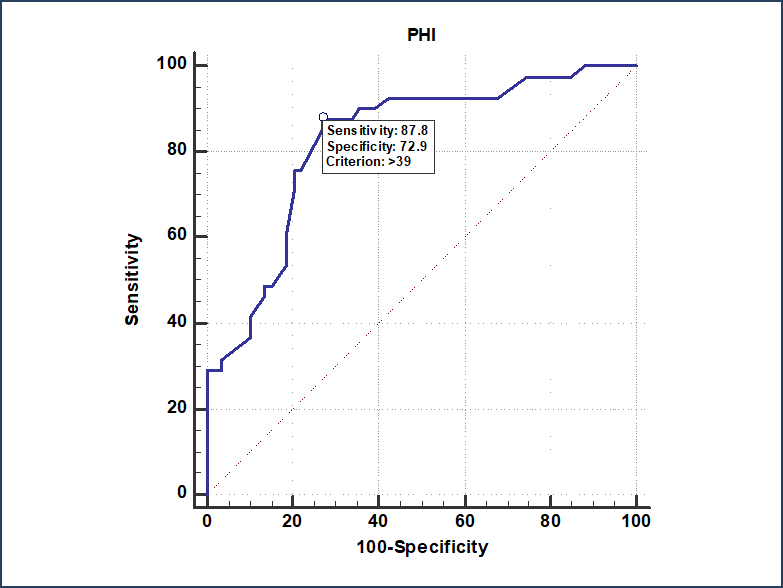
Graph 4. ROC CURVE ANALYSIS of PHI for all PIRADS Patients
DISCUSSION:
This prospective comparative study, conducted at Dr. BL Kapur Memorial Hospital, New Delhi (July 2022 to July 2024), evaluates the sensitivity and specificity of the Prostate Health Index (PHI) for guiding prostate biopsy in patients with raised serum PSA levels (4-10 ng/mL). A total of 100 patients aged >50 years with suspected carcinoma prostate were enrolled.
PSA-based screening often leads to unnecessary biopsies due to elevated PSA levels caused by benign conditions like benign prostatic hyperplasia and prostatitis, with low specificity (25%) for prostate cancer detection below 10 ng/mL [17,18]. Despite exploring derivatives like free PSA and PSA velocity, no PSA-based test has achieved high clinical specificity [19]. Prostate biopsy, the gold standard, carries risks, prompting alternative strategies like PSA-related indexes, PI-RADS scores, and biomarkers (e.g., p2PSA, PCA3), although no consensus exists on the best method [20].
The Prostate Health Index (PHI), FDA-approved in 2012, combines three biomarkers and offers higher specificity than free PSA and p2PSA, reducing unnecessary biopsies by 39%-57% [21,22]. PHI is particularly useful in PSA "gray zone" ranges (2-10 ng/mL or 4-10 ng/mL) for active surveillance, biochemical recurrence prediction, and identifying high-grade cancers. [22-24] Studies show PHI outperforms tPSA, PSA density, and prostate volume in detecting clinically significant prostate cancer (csPCa), with values above 31-34 indicating csPCa with 80%-85% sensitivity and 38%-46% specificity [23]. In Asian populations, a PHI threshold of ≥36.96 shows 90% sensitivity and 52.1% specificity for csPCa detection [25,26].
In our study, most patients (31%) were aged 65-70, with fewer patients in the ≥70 (12%) and 50-55 (11%) age groups. The PI-RADS v2 effectively identifies clinically significant prostate cancer (csPCa) in patients needing biopsies, especially those with PI-RADS scores of 4 or 5, while PI-RADS-3 (the "grey zone") shows csPCa in less than 15% of cases, necessitating additional diagnostic tools to reduce unnecessary biopsies [10]. PI-RADS-3 had a 0.49 PPV for csPCa, though some patients with negative mpMRI results were later diagnosed with high-grade prostate cancer [11].
In our patient group, 53% had a PI-RADS-3 score, 34% PI-RADS-4, and 13% PI-RADS-5. TRUS biopsy outcomes showed 59% negative and 41% positive results, with significant associations (P<0.05) between biopsy results and PHI values. PHI cutoff values were >36 for PI-RADS-3, >39 for PI-RADS-4, and >40 for PI-RADS-5, with values above these thresholds indicating positive results.
PHI accuracy in predicting biopsy outcomes was highest for PI-RADS-5 (92.3%), followed by PI-RADS-4 (88.2%) and PI-RADS-3 (73.6%). For PI-RADS-5, PHI reached 100% sensitivity, 88.9% PPV, 80% specificity, and 100% NPV. For PI-RADS-4, PHI showed 92.3% sensitivity, 80% PPV, 85.7% specificity, and 94.7% NPV. For PI-RADS-3, PHI had 85% sensitivity, 60.7% PPV, 66.7% specificity, and 88% NPV. For PI-RADS-3 patients, a PHI below 36 resulted in a high NPV (88%), suggesting that these patients have a low likelihood of positive biopsy results, thus supporting the safe avoidance of biopsies in this group.
Our study’s findings corroborate previous research demonstrating the Prostate Health Index’s (PHI) superior diagnostic performance over %fPSA for patients with PSA levels of 2-10 ng/mL and in predicting clinically significant prostate cancer (csPCa) in patients with PSA >10 ng/mL and prior negative biopsies. Specifically, a PHI threshold of ≥36.96 achieved 90% sensitivity and 52.1% specificity in an Asian cohort, further supporting its predictive accuracy [23-30].
We conducted a comparative analysis of PHI and TRUS biopsy outcomes, finding a significant association (P<0.05) with a PHI cutoff of >39 indicating positive results. PHI accuracy in predicting biopsy outcomes reached 79%, with sensitivity at 87.8%, specificity at 72.9%, PPV at 69.2%, and NPV at 89.6%.
Multiparametric MRI (mpMRI) has improved prostate cancer (PCa) detection, especially in triage before biopsy, and combining it with PHI enhances csPCa detection [31,32]. PI-RADS scores of 4 and 5 indicate high csPCa probability, but PI-RADS-3 remains challenging due to low csPCa rates (10%-30%), risking unnecessary biopsies [33,34]. Catalona et al. showed that PHI, with %fPSA, significantly enhances high-grade PCa specificity [35]. Jansen et al. also found PHI and %p2PSA valuable for PCa detection, though with limited high-grade cancer utility [28].
PHI’s effectiveness across various cohorts, including Asian populations, reinforces its clinical value. Studies by Tan LG et al. [36], Ng CF et al. [37], Yu GP et al. [22], and Chiu PK et al. [21] in Asian males show PHI’s predictive power, with AUCs significantly higher than tPSA alone and with substantial biopsy avoidance potential.
The use of PHI has improved the cost-effectiveness of prostate cancer detection by reducing the number of unnecessary biopsies, which lowered diagnostic and treatment costs by 17% and 1%, respectively [32,33]. A systematic review of studies involving Caucasian and Asian patients showed that PHI consistently outperformed tPSA in detecting prostate cancer, helping avoid unnecessary biopsies in 31–57% of cases. Western studies showed a higher cancer detection rate (40–55%) than Asian studies (10–26%), though the detection rate increased with PSA levels >10 ng/mL [38,17].
Our study supports PHI as a reliable predictor for clinically significant prostate cancer (csPCa) in PI-RADS-3 patients, with a positive predictive value (PPV) of 60.7% and a negative predictive value (NPV) of 88%. A PHI value below 36 can predict negative biopsy results, thus enabling the avoidance of unnecessary biopsies in such patients. This finding aligns with the use of PHI in patients with PSA levels of 4–10 ng/mL and negative DRE, improving specificity and reducing unnecessary procedures [39].
Limitations: This study was conducted on a small, single-center cohort of Asian men from a tertiary medical center, potentially limiting its applicability to the broader population. Furthermore, PHI cutoff values may vary between Asian and European populations, highlighting the need for additional research across larger, more diverse populations to confirm these findings.
CONCLUSION:
Our study shows that the Prostate Health Index (PHI) significantly enhances the specificity of prostate cancer detection in men with PSA levels of 4–10 ng/mL, improving the detection rate of high-grade cancers and minimizing unnecessary biopsies. The accuracy of PHI in predicting biopsy outcomes based on PI-RADS scores was highest for PI-RADS-5 (92.3%), followed by PI-RADS-4 (88.2%) and PI-RADS-3 (73.6%). For PI-RADS-3 patients, a PHI value below 36 reliably predicted negative biopsy results (PPV 60.7%, NPV 88%), enabling safe avoidance of biopsies. Additionally, PHI effectively predicts clinically significant prostate cancer (csPCa), serving as a triage tool to reduce missed diagnoses in patients with non-suspicious or equivocal MRI results (PI-RADS ≤3). Our study confirms that PHI is the best predictor of csPCa in these patients, supporting clinical decision-making and reducing unnecessary biopsies.
REFERENCES:
1. Kızılay F, Çelik S, Narter F, Sözen S, Özen H, Akdoğan B, Aslan G, Türkeri L, İzol V, Şahin B, Eskiçorapçı S. Members of Turkish Urooncology Association. Determination of the PSA Cut-off Value to Predict the Clinically Significant Prostate Cancer in Patients with Positive Multiparametric MRI: A Population based Study. Bull Urooncol 2023;22(3):100-105.
2. Jemal A, Bray F, Center MM, et al. Global cancer statistics. CA: Cancer J Clin 2011;61:69–90
3. Zhang K, Bangma CH, Roobol MJ. Prostate cancer screening in Europe and Asia. Asian J Urol 2017;4:86–95.
4. Hugosson J, Roobol MJ, Månsson M, et al. A 16-yr follow-up of the European randomized study of screening for prostate cancer. Eur Urol 2019;76:43-51.
5. Kim JH, Hong SK. Clinical utility of current biomarkers for prostate cancer detection. Investig Clin Urol. 2021 Jan;62(1):1-13.
6. Loeb S, Catalona WJ (2014) The prostate health index: a new test for the detection of prostate cancer. Ther Adv Urol 6(2):74–7.
7. Catalona WJ, Partin AW, Sanda MG, Wei JT, Klee GG, Bangma CH, et al. (2011) A multicenter study of [−2]pro-prostate specific antigen combined with prostate specific antigen and free prostate specific antigen for prostate cancer detection in the 2.0 to 10.0 ng/ml prostate specific antigen range. J Urol 185(5):1650–5.
8. Sokoll LJ, Sanda MG, Feng Z, Kagan J, Mizrahi I A., Broyles DL, et al. (2010) A prospective, multicenter, national cancer institute early detection research network study of [−2]proPSA: Improving prostate cancer detection and correlating with cancer aggressiveness. Cancer Epidemiol Biomarkers Prev 19(5):1193–200.
9. Kasivisvanathan V., Rannikko A.S., Borghi M., Panebianco V., Mynderse L.A., Vaarala M.H., Briganti A., Budaus L., Hellawell G., Hindley R.G., et al. MRI-Targeted or Standard Biopsy for Prostate-Cancer Diagnosis. N. Engl. J. Med. 2018;378:1767–1777.
10. Weinreb J.C., Barentsz J.O., Choyke P.L., Cornud F., Haider M.A., Macura K.J., Margolis D., Schnall M.D., Shtern F., Tempany C.M., et al. PI-RADS Prostate Imaging-Reporting and Data System: 2015, Version 2. Eur. Urol. 2016;69:16–40.
11. Ferro M, Crocetto F, Bruzzese D, Imbriaco M, Fusco F, Longo N, Napolitano L, La Civita E, Cennamo M, Liotti A, Lecce M, Russo G, Insabato L, Imbimbo C, Terracciano D. Prostate Health Index and Multiparametric MRI: Partners in Crime Fighting Overdiagnosis and Overtreatment in Prostate Cancer. Cancers (Basel). 2021 Sep 21;13(18):4723.
12. Ferro M., De Cobelli O., Lucarelli G., Porreca A., Busetto G.M., Cantiello F., Damiano R., Autorino R., Musi G., Vartolomei M.D., et al. Beyond PSA: The Role of Prostate Health Index (phi) Int. J. Mol. Sci. 2020;21:1184.
13. Matoso A, Epstein JI. Defining clinically significant prostate cancer on the basis of pathological findings. Histopathology. 2019 Jan;74(1):135-145.
14. Tiago Oliveira, Luís Amaral Ferreira, Carlos Miguel Marto, Cristina Marques, Carlos Oliveira, Paulo Donato. The Role of Multiparametric MRI in the Local Staging of Prostate Cancer. Front. Biosci. (Elite Ed) 2023, 15(3), 21.
15. Tosoian J.J., Druskin S.C., Andreas D., Mullane P., Chappidi M., Joo S., Ghabili K., Agostino J., Macura K.J., Carter H.B., et al. Use of the Prostate Health Index for detection of prostate cancer: Results from a large academic practice. Prostate Cancer Prostatic Dis. 2017;20:228–233.
16. Fan Y.H., Pan P.H., Cheng W.M., Wang H.K., Shen S.H., Liu H.T., Cheng H.M., Chen W.R., Huang T.H., Wei T.C., et al. The Prostate Health Index aids multi-parametric MRI in diagnosing significant prostate cancer. Sci. Rep. 2021;11:1286.
17. Semjonow A., Kopke T., Eltze E., Pepping-Schefers B., Bürgel H., Darte C. Pre-analytical in-vitro stability of [-2] proPSA in blood and serum. Clin Biochem. 2010;43:926–928.
18. Wang W., Wang M., Wang L., Adams T.S., Tian Y., Xu J. Diagnostic ability of %p2PSA and Prostate Health Index for aggressive prostate cancer: a meta-analysis. Sci Rep. 2014;4:512
19. Sivaraman A, Bhat KRS. Screening and Detection of Prostate Cancer-Review of Literature and Current Perspective. Indian J Surg Oncol. 2017;8(2):160-168
20. EAU. EAU-EANM-ESUR-ESTRO-SIOG guidelines on prostate cancer 2020 [Internet] Arnhem: EAU; 2020
21. Chiu P.K., Teoh J.Y., Lee W.M., Yee C.H., Chan E.S., Hou S.M. Extended use of Prostate Health Index and percentage of [-2]pro-prostate-specific antigen in Chinese men with prostate specific antigen 10-20 ng/mL and normal digital rectal examination. Investig Clin Urol. 2016;57:336–342.
22. Yu G.P., Na R., Ye D.W., Qi J., Liu F., Chen H.T., Wu Y.S. Performance of the Prostate Health Index in predicting prostate biopsy outcomes among men with a negative digital rectal examination and transrectal ultrasonography. Asian J Androl. 2016;18:633–638.
23. Loeb S., Sanda M.G., Broyles D.L., Shin S.S., Bangma C.H., Wei J.T. The Prostate Health Index selectively identifies clinically significant prostate cancer. J Urol. 2015;193:1163–1169.
24. Lazzeri M., Haese A., de la Taille A., Palou Redorta J., McNicholas T., Lughezzani G. Serum isoform [-2]proPSA derivatives significantly improve prediction of prostate cancer at initial biopsy in a total PSA range of 2-10 ng ml-1: a multicentric European study. Eur Urol. 2013;63:986–994
25. Chiu ST, Cheng YT, Pu YS, Lu YC, Hong JH, Chung SD, et al. Prostate health index density outperforms prostate health index in clinically significant prostate cancer detection. Front Oncol. 2021;11:772182.
26. Peters R, Stephan C, Jung K, Lein M, Friedersdorff F, Maxeiner A. Comparison of PHI and PHI density for prostate cancer detection in a large retrospective caucasian cohort. Urol Int. 2022;106:878–883.
27. Bruzzese D, Mazzarella C, Ferro M, Perdonà S, Chiodini P, Perruolo G, et al. Prostate health index vs percent free prostate-specific antigen for prostate cancer detection in men with “gray” prostate-specific antigen levels at first biopsy: systematic review and meta-analysis. Transl Res. 2014;164:444–451.
28. Na R, Ye D, Qi J, Liu F, Helfand BT, Brendler CB, et al. Prostate health index significantly reduced unnecessary prostate biopsies in patients with PSA 2-10 ng/mL and PSA >10 ng/mL: results from a Multicenter Study in China. Prostate. 2017;77:1221–1229
29. Liu AQ, Remmers S, Lau SY, Yip SY, Leung CH, Mak CW, et al. Initial Prostate Health Index (phi) and phi density predicts future risk of clinically significant prostate cancer in men with initial negative prostate biopsy: a 6-year follow-up study. Prostate Cancer Prostatic Dis. 2022;25:684–689.
30. Peters R, Stephan C, Jung K, Lein M, Friedersdorff F, Maxeiner A. Comparison of PHI and PHI density for prostate cancer detection in a large retrospective caucasian cohort. Urol Int. 2022;106:878–883.
31. Schoots IG, Padhani AR, Rouvière O, Barentsz JO, Richenberg J. Analysis of magnetic resonance imaging-directed biopsy strategies for changing the paradigm of prostate cancer diagnosis. Eur Urol Oncol. 2020;3:32–41.
32. Nichol M.B., Wu J., An J.J., Huang J., Denham D., Frencher S. Budget impact analysis of a new prostate cancer risk index for prostate cancer detection. Prostate Cancer Prostatic Dis. 2011;14:253–261
33. Nichol M.B., Wu J., Huang J., Denham D., Frencher S.K., Jacobsen S.J. Cost-effectiveness of Prostate Health Index for prostate cancer detection. BJU Int. 2012;110:353–362
34. Chiu PK, Ng CF, Semjonow A, Zhu Y, Vincendeau S, Houlgatte A, et al. A multicentre evaluation of the role of the Prostate Health Index (PHI) in regions with differing prevalence of prostate cancer: adjustment of PHI reference ranges is needed for European and Asian settings. Eur Urol. 2019;75:558–561
35. Catalona WJ, Partin AW, Sanda MG, Wei JT, Klee GG, Bangma CH, et al. A multicenter study of [-2]pro-prostate specific antigen combined with prostate specific antigen and free prostate specific antigen for prostate cancer detection in the 2.0 to 10.0 ng/ml prostate specific antigen range. J Urol. 2011;185:1650–1655. Erratum in: J Urol 2011;186:354
36. Tan L.G., Tan Y.K., Tai B.C., Tan K.M., Gauhar V., Tiong H.Y. Prospective validation of %p2PSA and the Prostate Health Index, in prostate cancer detection in initial prostate biopsies of Asian men, with total PSA 4-10 ng ml-1. Asian J Androl. 2017;19:286–290.
37. Ng C.F., Chiu P.K., Lam N.Y., Lam H.C., Lee K.W., Hou S.S. The Prostate Health Index in predicting initial prostate biopsy outcomes in Asian men with prostate-specific antigen levels of 4-10 ng ml-1. Int Urol Nephrol. 2014;46:711–717
38. Mikolajczyk S.D., Catalona W.J., Evans C.L., Linton H.J., Millar L.S., Marker K.M. Proenzyme forms of prostate-specific antigen in serum improve the detection of prostate cancer. Clin Chem. 2004;50:1017–1025
39. Sriplakich S, Lojanapiwat B, Chongruksut W, et al. Prospective performance of the Prostate Health Index in prostate cancer detection in the first prostate biopsy of men with a total prostatic specific antigen of 4-10 ng/mL and negative digital rectal examination. Prostate Int. 2018;6(4):136-139.