Analysis of Renal Function by EGFR – A Comparison between Two Equations – A Retrospective Study.
- Geetha J. , Professor, Department of Anaesthesia, Dhanalakshmi Srinivasan Medical College and Hospital, Siruvachur, Perambalur, Tamil Nadu, India
- R. Juanita Ranjini , Postgraduate, Department of Anaesthesia, Dhanalakshmi Srinivasan Medical College and Hospital, Siruvachur, Perambalur, Tamil Nadu, India
- Sathiya Priya B , CRMI, Department of Anaesthesia, Dhanalakshmi Srinivasan Medical College and Hospital, Siruvachur, Perambalur, Tamil Nadu, India
- Aadhavan M , CRMI, Department of Anaesthesia, Dhanalakshmi Srinivasan Medical College and Hospital, Siruvachur, Perambalur, Tamil Nadu, India
- Arun M. , CRMI, Department of Anaesthesia, Dhanalakshmi Srinivasan Medical College and Hospital, Siruvachur, Perambalur, Tamil Nadu, India.
Article Information:
Abstract:
Background: Renal dysfunction could occur due to prerenal, intrarenal and post renal causes. The intrarenal causes and the renal dysfunction could be best assessed by glomerular filtration rate. Further pathological changes in heart and liver secondary to renal disorders classified as cardiorenal and hepatorenal syndromes respectively could also be predicted by glomerular filtration rate (GFR). GFR is best measured by (mGFR) radio isotope tagged renal inert substances such as hippuran which is not feasible in routine clinical situations. Hence a feasible, economical and easy estimation of GFR (eGFR) that would offer an idea of mGFR was evaluated by various equations using commonly available parameters such as creatinine, age, weight, BMI and BSA with correction factors for gender and ethnicity. In this study, we intend to compare eGFR calculated by two equations, the widely used Cockcroft Gault equation and Mayo Quadratic equation and analyse their clinical applications. Aim: To analyze renal function by eGFR calculated by two formulae namely: CG formula and MQ-formula. MATERIALS AND METHODS: Case records including lab reports from different wards and intensive care units available during the study period. Methods: The case records of patients from various wards and units of various age groups were analysed and study parameters were tabulated. Study Parameters: Age, gender, diagnosis, height, weight, BMI, Urea, creatinine, eGFR1 by Cockcroft Gault formula, eGFR2 by Mayo Quadratic formula class 1 = classification of CKD by CG formula. eGFR2 = calculation by Mayo Quadratic formula. class 2 = classification of CKD by MQ formula. RESULTS: The age group of patient had predominance between 20 and 65 years and BMI had a mode between 25 and 35. The scatter plot between the two equations had eGFR with Pearson correlation r of 0.682. The distribution of stages of CKD from both equations in box plots showed similar results from both equation in stages 4 and 5. Hyperbolic relationship between creatinine and equation one is well depicted by the study. CONCLUSION: Several equations have been invented to evaluate eGFR. Each equation has to be chosen as that to be the most suitable for a particular clinical situation. Cockcroft Gault equation could be applicable in any clinical situation to obtain an idea of CKD status, Mayo Quadratic equation is weight independent and has the same results as Cockcroft Gault in CKD stages beyond stage 3. MDRD equation may be useful in cases with preserved renal functions whereas CKD EPI equation is the most accurate and close to measured GFR though cystatinSeveral equations have been invented to evaluate eGFR. Each equation has to be chosen as that to be the most suitable for a particular clinical situation. Cockcroft Gault equation could be applicable in any clinical situation to obtain an idea of CKD status, Mayo Quadratic equation is weight independent and has the same results as Cockcroft Gault in CKD stages beyond stage 3. MDRD equation may be useful in cases with preserved renal functions whereas CKD EPI equation is the most accurate and close to measured GFR though cystatic C values may be needed. eGFR is more informative than serum creatinine to infer renal functions well depicted by the hyperbolic curve between them and variability of serum creatinine in elderly and thin patients who may have normal creatinine in spite of deranged renal functions. C values may be needed. eGFR is more informative than serum creatinine to infer renal functions well depicted by the hyperbolic curve between them and variability of serum creatinine in elderly and thin patients who may have normal creatinine in spite of deranged renal functions.
Keywords:
Article :
INTRODUCTION:
Nephron is the functional unit of kidney. Kidney itself performs essential homeostatic functions that include: excretion of metabolic wastes and foreign chemicals, regulation of water and electrolyte balance, regulation of body fluid osmolality and electrolyte concentrations, regulation of arterial pressure, regulation of acid base balance, secretion, metabolism and excretion of hormones and gluconeogenesis. Renal dysfunction is often triggered by systemic illnesses such as diabetes mellitus and systemic hypertension.
Conventionally estimation of blood urea, serum creatinine and urine output constitute tests of renal function. In contrast we observe patients with high urea with normal urine output, patients with normal serum creatinine with rapid deterioration of renal functions proving that these tests do not directly infer glomerular functions.
The glomerular filtration rate (GFR) is determined by (1) balance of hydrostatic and colloid osmotic forces acting across the capillary membrane and (2) capillary filtration coefficient (KF), which is the product of permeability and surface area of the capillaries. GFR is about 20% of renal plasma flow. Thus normal GFR is 120 ml/min/1.73 m² and filtration fraction calculated as GFR/RPF is 0.2.
About six formulae exist to calculate GFR with available clinical indices such as Age, Height, Weight, BMI and Serum Creatinine. In this study we intend to compare estimated GFR from two formulae namely Cockcroft-Gault formula and Mayo Quadratic formula; the former one has weight included while the second one is weight-independent.
Aim
To analyze renal function by eGFR calculated by two formulae namely: CG formula and MQ-formula.
Objectives
1. To compare eGFR estimated by two formulae; one is weight-dependent and the other is weight-independent.
2. To calculate eGFR for a wide range of patients over various age groups and various systemic-disorders.
3. To evaluate the indication and choice of appropriate formula correlating to the clinical condition.
MATERIALS AND METHODS:
Case records including lab reports from different wards and intensive care units available during the study period.
Study Design
Retrospective observational comparative clinical study.
Study Period
May 2026 – June 2026.
Study Sample
Convenient sample of 168 case records in the above study period.
Methods
The case records of patients from various wards and units of various age groups were analysed and study parameters were tabulated.
Study Parameters
Age, gender, diagnosis, height, weight, BMI, Urea, creatinine, eGFR1 by Cockcroft Gault formula, eGFR2 by Mayo Quadratic formula
class 1 = classification of CKD by CG formula. eGFR2 = calculation by Mayo Quadratic formula.
class 2 = classification of CKD by MQ formula.
RESULTS:
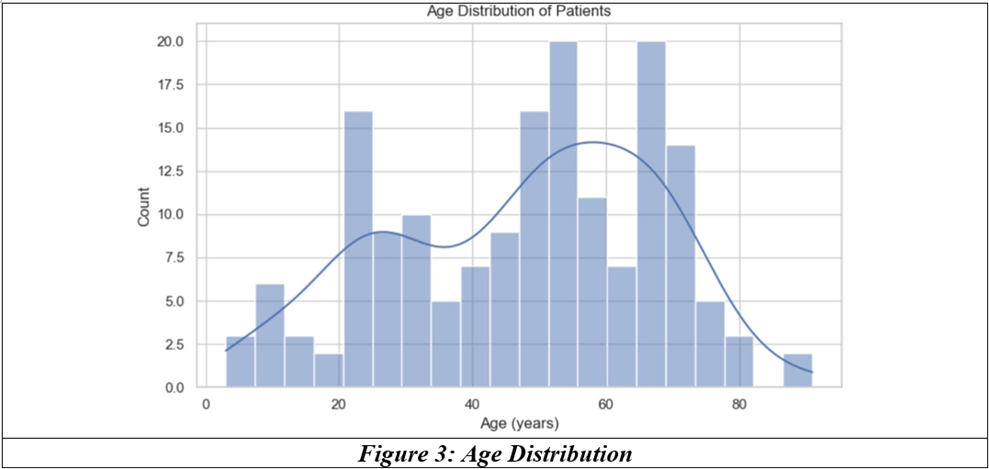
The age histogram shows the spread of patients undergoing pre-anaesthetic renal assessment. A roughly bell-shaped or slightly right-skewed distribution here would suggest the sample is dominated by middle-aged to older adults, the group in which renal function screening before anaesthesia is most clinically relevant (age-related decline in GFR, higher likelihood of comorbidities). In a pre-anaesthetic screening context, age is one of the strongest non-modifiable risk factors for reduced renal reserve, slower drug clearance, and higher perioperative complication risk. If this histogram shows a cluster of patients above roughly 60 years, that subgroup warrants closer attention to dose adjustment for renally-cleared anaesthetic agents, since even a ‘normal’ creatinine can mask a clinically meaningful eGFR decline in older patients due to their lower baseline muscle mass (and therefore lower creatinine production).
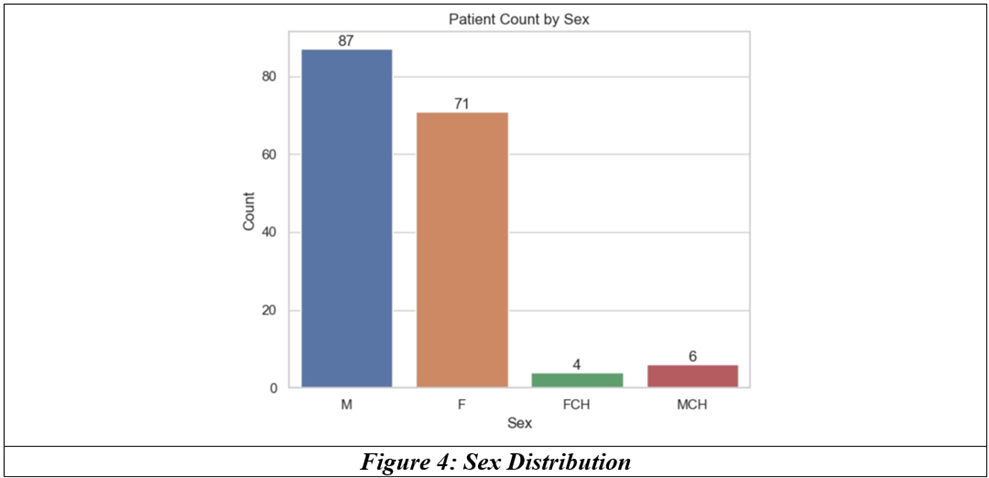
This shows the male/female balance of the cohort. Since Cockcroft-Gault applies a correction factor for sex (and both formulas use sex-specific constants), a skewed sex ratio is worth keeping in mind when interpreting aggregate eGFR results, and is directly tested for confounding in the statistical section below.
Beyond the formula correction itself, a skewed sex ratio also affects the statistical power of any sex-based comparison performed later in this notebook - the smaller of the two groups will have wider confidence intervals and less ability to detect a true difference, even if one exists. This is worth keeping in mind when reading the Mann-Whitney U results in the Statistical Analysis section: a non-significant p-value there could reflect either a genuine absence of difference, or simply an underpowered comparison due to sample size imbalance.
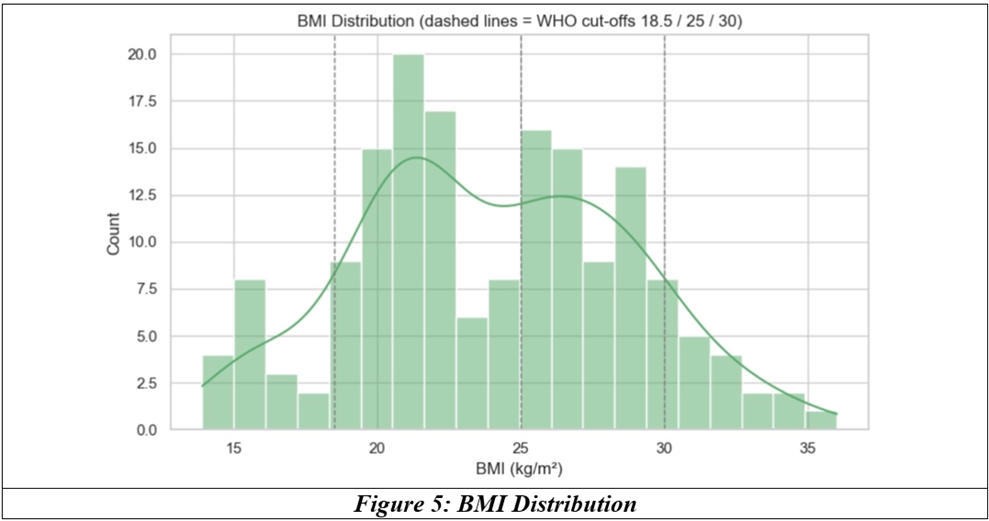
BMI is relevant to anaesthesia risk stratification and to the accuracy of weight-based formulas like Cockcroft-Gault. The reference lines mark WHO underweight/normal/overweight/obese cut-offs - a large fraction of the mass sitting above 25 or 30 indicates an overweight-dominant cohort, which can systematically inflate Cockcroft-Gault eGFR (it uses raw weight, not lean mass). Weight-based dosing errors are a recognized source of perioperative medication risk, and Cockcroft-Gault’s reliance on raw (rather than lean or ideal) body weight is a well-documented limitation in the nephrology and anaesthesia literature - it tends to overestimate eGFR in obese patients because it attributes their extra adipose mass to functional kidney-filtering capacity that isn’t actually there. Where this histogram shows a substantial overweight/obese subgroup, expect the Bland-Altman analysis later in this notebook to reveal a corresponding systematic bias between the two eGFR formulas in that same subgroup.
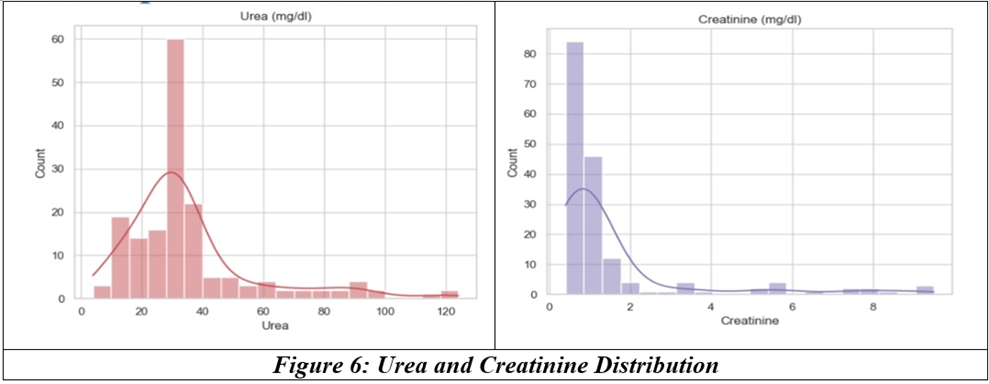
Both renal markers are right-skewed, as expected - the bulk of patients have normal renal clearance (low urea/creatinine) while a minority with renal impairment stretch the right tail. Because both eGFR formulas are driven directly by creatinine, this skew is what ultimately produces the skew we’ll see in the eGFR distributions. Because both eGFR formulas invert creatinine (higher creatinine implies lower filtration), the right-skew visible here propagates directly into a left-skew in both eGFR columns - most patients cluster at a comfortably ‘normal’ eGFR, while the impaired-renal-function tail produces a smaller number of low-eGFR, high-stage outliers. Recognizing this shared origin is useful context for interpreting the CKD stage distribution graph later: the stage categories are not artificial buckets, they are a direct, non-linear recoding of this same creatinine skew.
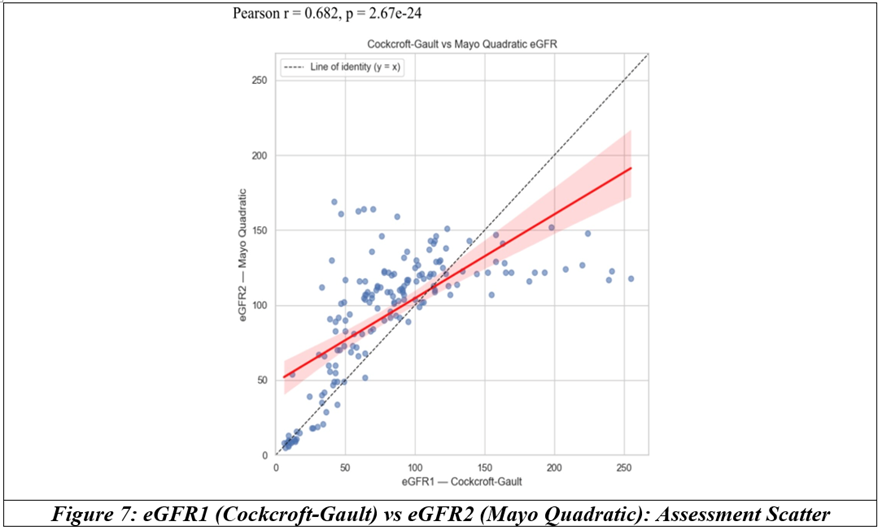
Points falling on the dashed line of identity indicate perfect agreement between formulas. Systematic deviation above or below the line (rather than random scatter) indicates that one formula consistently over- or under-estimates GFR relative to the other - Cockcroft-Gault is known to be weight-sensitive, so in an overweight cohort we'd expect points to sit above the line (CG reading higher than Mayo Quadratic, which does not use weight). The Pearson correlation quantifies the strength of the *linear* relationship, but a high correlation can still mask a systematic offset - which is why we follow up with a Bland-Altman plot below. It's also worth checking whether the scatter is tighter at low eGFR values and wider at high eGFR values, or vice versa - this kind of heteroscedasticity (non-constant spread) is common in eGFR comparisons because both formulas become more sensitive to small creatinine measurement error at high filtration rates. If present, it reinforces why a single global correlation coefficient can be a misleading summary on its own, and why the Bland-Altman plot (which explicitly plots the difference against the mean, making any such funnel shape visible) is the more informative agreement diagnostic that follows next.
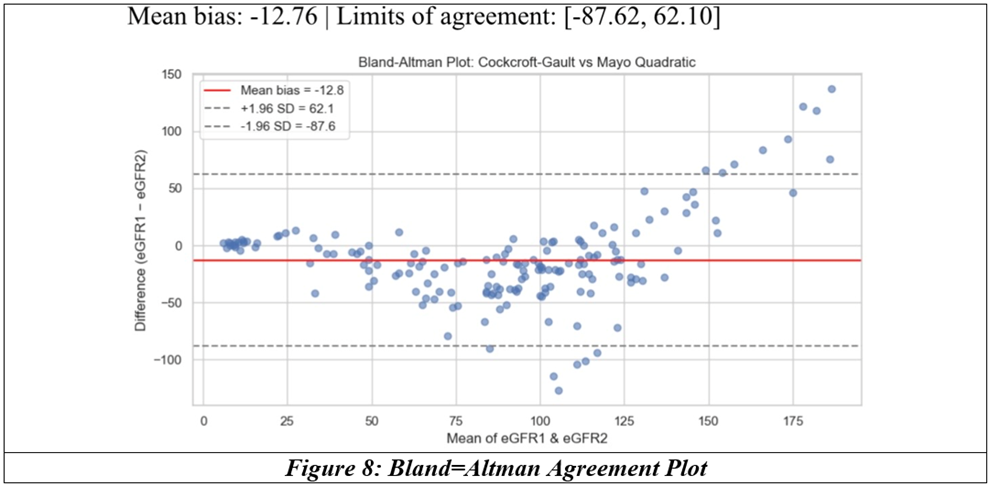
This is the gold-standard way to assess agreement between two clinical measurement methods (Bland & Altman, 1986) - it directly shows systematic bias (mean difference) and the range within which 95% of individual differences fall (limits of agreement), rather than relying on correlation, which can be high even when methods disagree substantially. A non-zero mean bias confirms which formula reads systematically higher; wide limits of agreement mean the two formulas cannot be used interchangeably for an individual patient, even if they correlate well at a population level. Any funnel/fan shape (differences widening at higher means) would indicate the disagreement is proportional to GFR level, not constant. In practice, if the limits of agreement span, say, ±30 mL/min/1.73m², that range is wide enough to move a patient across two or more CKD stages depending purely on which formula happens to be used - which is precisely the kind of discrepancy that matters for real clinical decisions like contrast-agent dosing, nephrotoxic drug avoidance, or anaesthetic drug selection. A tight, near-zero-centered band, by contrast, would support using either formula interchangeably in routine pre-operative screening. The Cohen's Kappa statistic computed later translates this same disagreement into a stage-level agreement score, which is often the more clinically actionable number of the two.
Figure 9: CKD Stage Classification: Class 1 vs Class 2 Comparision
|
Class1 (Cockcroft-Gault) |
Class2 (Mayo Quadratic) |
|
|
1 |
64 |
113 |
|
2 |
42 |
19 |
|
3A |
18 |
9 |
|
3B |
23 |
5 |
|
4 |
5 |
6 |
|
5 |
16 |
16 |
This grouped bar chart directly compares how many patients each formula assigns to each CKD stage. If the two formulas agreed perfectly, the blue and orange bars would be identical at every stage. Divergences - e.g. Cockcroft-Gault classifying more patients into stage 3A/3B while Mayo Quadratic keeps them at stage 1/2 - have real clinical consequences, since CKD stage often drives dose adjustments and referral decisions. This motivates the Cohen's Kappa agreement statistic computed below. It's also worth checking whether disagreements are concentrated at the boundary between adjacent stages (e.g. patients flipping between stage 2 and 3A depending on formula) rather than spread randomly across all stages - boundary disagreement is the more clinically forgivable failure mode, since it reflects borderline cases rather than a formula being fundamentally unreliable. A patient whose stage assignment swings from 1 to 4 depending on the formula, by contrast, would be a red flag worth manually rechecking the underlying creatinine and weight values for a data-entry error.
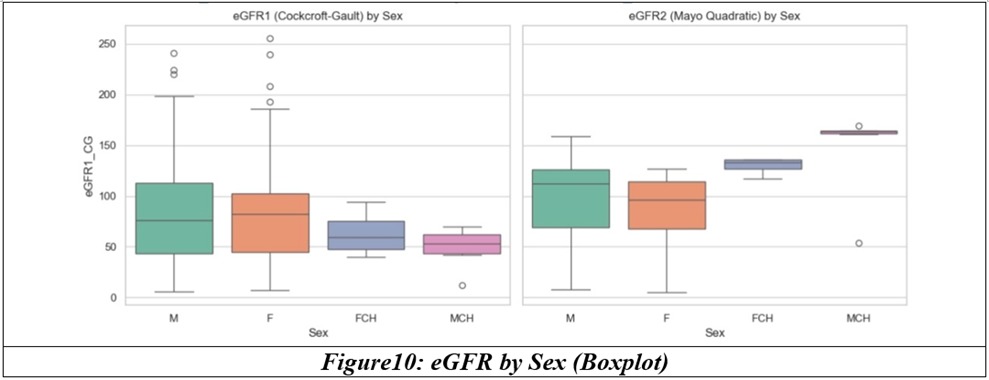
Both formulas include a sex-adjustment term (women are assumed to have lower muscle mass / creatinine generation for a given creatinine level), so eGFR distributions across sex should already be roughly balanced by design. Any large remaining gap here would instead reflect real differences in this cohort's age, weight, or renal function between men and women rather than a formula artifact. This is formally tested below with a Mann-Whitney U test. If a real (not just formula-driven) sex difference in eGFR is confirmed by the Mann-Whitney test below, the next natural question is whether it's explained by a difference in age or BMI between the sexes in this specific cohort, rather than a true sex-linked physiological difference in renal function - this is exactly the kind of follow-up question a multivariable regression (eGFR ~ Age + Sex + BMI) could answer more cleanly than any single pairwise test, and would be a reasonable next step if this dataset is used for further research beyond this exploratory notebook.
This matrix summarizes every pairwise linear relationship at once. The expected strong pattern is a negative correlation between Creatinine and both eGFR columns (higher creatinine → lower filtration rate, by construction of both formulas), and a positive correlation between Weight(kg) and eGFR1(CG) specifically (since Cockcroft-Gault is the only one of the two that uses body weight) eGFR2(Mayo) should show a visibly weaker weight correlation, which is itself evidence of the structural difference between the two formulas). One subtlety worth flagging: a correlation heatmap only captures *linear* association. Age and eGFR in particular are known from the wider nephrology literature to often have a threshold-like relationship (little decline until a certain age, then a steeper drop), which a single Pearson correlation coefficient can understate. If the Age-eGFR cell in this matrix looks weaker than clinically expected, that's a reason to look at the Age-vs-eGFR relationship directly with a scatter plot before concluding age isn't relevant in this cohort.
This plot makes the inverse (roughly hyperbolic) relationship between creatinine and eGFR visually explicit, and overlays the resulting stage assignment. It's a useful sanity check: stage should decrease monotonically as eGFR decreases (i.e. color should transition smoothly from stage 1 at the top-left to stage 5 at the bottom-right) - any patient whose colour looks out of sequence would flag a data-entry inconsistency worth double-checking against the original chart. This chart is also a useful internal quality-control tool for the dataset itself, beyond its interpretive value: since CKD stage is deterministically computed from eGFR, any point whose colour doesn't fall into a clean left-to-right band ordering by stage is either a genuine borderline case sitting near a stage cut-off, or a sign that the stage was computed from a different creatinine/eGFR pairing than the one shown here (e.g. a transcription mismatch between rows during data entry) and is worth a manual spot-check against the source chart.
DISCUSSION:
The kidney is one of the most highly differentiated organs in the body with almost 30 different cell types that form a multitude of filtering capillaries and segmented nephrons enveloped by a dynamic interstitium.[1] The excretory system begins with a plasma ultrafiltrate from renal cortical glomerulus, modified by renal tubules of the nephron and ends with the excretion of urinary water and solutes.[2] The prerenal or renal causes of kidney disease have differentiating factors in common features and symptomatology. Urine output, clinical history, urine chemistry and laboratory studies tend to differentiate prerenal, renal and postrenal causes of renal injury.
Table 1: Causes of Renal Injury
|
Features |
Prerenal |
Renal |
|
Urine output |
Oliguria Anuria |
Oliguria Normal Polyuria |
|
Clinical history |
Trauma Shock Fluid loss |
Haemolysis Interstitial nephritis |
|
Urine analysis |
Hyaline cast Crystalline cast |
Granular cast RBC cast WBC cast |
|
Urine chemistry |
Fractional excreted sodium <1% U/P Cr >40 U/P osmolality >1 |
FES >1–3% U/P Cr <40 Iso-osmotic |
|
Labs |
BUN/Cr ratio high ↑ Uric acid |
↑ PO4 ↓ Ca ↑ PTH ↓ NaHCO3 |
Stages of Chronic Kidney Disease (CKD)
Table 2: Stages of Chronic Kidney Disease
|
Stage of CKD (Abnormality >3 Months) |
Range of eGFR |
Clinical Features |
Importance |
|
1 |
>60 mL/min/1.73 m² |
Abnormal urinalysis, abnormal renal imaging |
Risk of progression to later stages increases with increased proteinuria and dependent on cause of disease |
|
2 |
>60 mL/min/1.73 m² |
Abnormal urinalysis, abnormal renal imaging |
Mild risk of progression to later stages increases with increased proteinuria and dependent on cause of disease |
|
3a |
45–60 mL/min/1.73 m² |
Cardiovascular disease or other organ damage |
Moderate risk of progression of disease. Pay attention to other vascular risk factors, high BP, lipids, smoking, weight |
|
3b |
30–45 mL/min/1.73 m² |
Proteinuria |
High risk of progression |
|
4 |
15–30 mL/min/1.73 m² |
— |
High likelihood of progression to ESRD, need preparation and education regarding choices for RRT including transplant and dialysis |
|
5 |
<15 mL/min/1.73 m² |
— |
Highest risk of requiring RRT |
Abbreviations: BP- Blood Pressure; eGFR-Estimated Glomerular Filtration Rate; ESRD- End-Stage Renal Disease; RRT- Renal Replacement Therapy.
Staging of Acute Kidney Injury Severity
Table 3: Staging of Acute Kidney Injury Severity
|
Stage |
Serum Creatinine |
Urine Output |
|
1 |
1.5–1.9 times baseline OR ≥0.3 mg/dL (≥26.5 μmol/L) increase |
<0.5 mL/kg per h for 6–12 h |
|
2 |
2.0–2.9 times baseline |
<0.5 mL/kg per h for ≥12 h |
|
3 |
3.0 times baseline OR increase in serum creatinine to ≥4.0 mg/dL (≥353.6 μmol/L) OR initiation of renal replacement therapy OR, in patients <18 years of age, decrease in eGFR to <35 mL/min per 1.73 m² |
<0.3 mL/kg per h for ≥24 h OR Anuria for ≥12 h |
The nephron architecture is unique and specifically modified by nature to effectively perform its functions. Kidneys develop from intermediate mesoderm under the timed or sequential control of genes. Sasser in 1987 postulated stages of nephrogenesis which is still now corresponding to the discovery of multiple sets of genes governing the stages of development of nephron. These involve:
a. Ureteric bud induction and condensation – Pax2 gene group
b. Pre tubular aggregation – Bm1 gene gp
c. Comma shaping – Notch 2 gene group
d. S shape – Hnf, VEGF gp
e. Capillary loop stage – Tcf 21 gene group
f. Mature glomerulus – Pdgfb group
Urinary excretion is a combination of three renal processes:
1) Glomerular filtration
2) Tubular reabsorption
3) Tubular secretion
Urinary excretion rate = Filtration rate − Reabsorption rate + Secretion rate.
Renal plasma flow is only 3 litres while GFR is 180 litres/24 hours. Hence substances are filtered about 60 times. This high GFR compared to plasma volume guarantees efficient and rapid removal of waste substances. The filtration fraction is calculated as GFR by renal plasma flow. The glomerular capillary membrane has three major layers: capillary endothelium, basement membrane and epithelial cells or podocytes surrounding outer surface of capillary membrane. Filtration occurs through pores or fenestrations in all the layers of the glomerular capillary membrane. Filterability of solutes is inversely proportional to their size. Negatively charged large molecules are filtered less easily than positively charged molecules of equal molecular size.
Table 4: Filterability through Glomerular Capillary Membrane
|
Substance |
Molecular Weight |
Filterability |
|
Water |
18 |
1.0 |
|
Sodium |
23 |
1.0 |
|
Glucose |
180 |
1.0 |
|
Inulin |
5,500 |
1.0 |
|
Myoglobin |
17,000 |
0.75 |
|
Albumin |
69,000 |
0.005 |
GFR is determined by the sum of hydrostatic and colloid osmotic forces across the glomerular membrane which gives the net filtration pressure and (b) glomerular capillary filtration coefficient Kf. GFR = Kf × Net filtration pressure.
The net filtration pressure operates according to the Starling law of diffusion. Flow = Kf (Pc − Pi) − σ (πc − πi). In this context, Pc = glomerular capillary hydrostatic pressure. Pi = Hydrostatic pressure of interstitium or Bowman's capsule outside the capillaries. πc = colloid osmotic pressure of glomerular capillary plasma proteins. πi = colloid osmotic pressure of proteins in interstitium or Bowman's capsule. Pc and πi promote glomerular filtration; in other words, hydrostatic pressure within glomerular capillaries and colloid osmotic pressure due to proteins in Bowman's capsule promote filtration whereas hydrostatic pressure of Bowman's capsule and colloid osmotic pressure of capillaries (Pi and πc) oppose glomerular filtration. Pc = 60 mmHg, Pi = 18 mmHg, πc = 32 mmHg, πi = zero [60 − 18 − 32 − 0]. Thus net filtration pressure is 10 mmHg.
Kf and GFR are directly proportional to each other. Total GFR is about 125 ml/min and net filtration pressure is 10 mmHg then Kf is calculated as 125/10 = 12.5 ml/min/mmHg. The high Kf of glomerular capillaries contribute to rapid rate of fluid filtration.
Renal blood flow is increasingly higher with kidneys than with any other internal organs. Kidneys constitute only 0.4 percent of total body weight and the combined blood flow through both kidneys is about 1.1 litre/minute, about 22% of cardiac output. The mechanisms that regulate renal blood flow are linked to the control of GFR and excretory functions of kidneys. The renal blood flow is determined by the pressure gradient across the renal vasculature (that is, the difference between renal artery and renal vein hydrostatic pressures) divided by total renal vascular resistance. Renal artery pressure is about equal to systemic arterial pressure and renal vein pressure averages to 3–4 mmHg. Most of the renal vascular resistance resides in three major segments: interlobular arteries, afferent arterioles and efferent arterioles. GFR remains relatively constant over an arterial pressure range between 80mmHg & 170 mmHg by autoregulation.
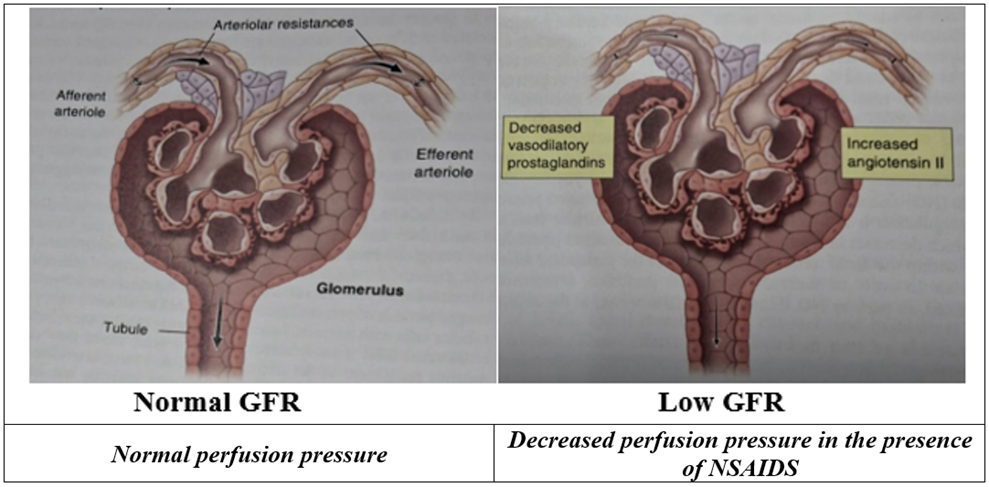
The determinants of GFR subject to physiologic control include glomerular hydrostatic & pressure and glomerular capillary colloid osmotic pressure. These are in turn influenced by the sympathetic nervous system, hormones and autacoids (epinephrine, norepinephrine and endothelin). These autacoids constrict renal blood vessels and reduce GFR. Prostaglandins, bradykinin, endothelium derived nitric oxide increase GFR whereas angiotensin II constricts efferent arterioles. In a healthy resting person sympathetic tone appears to have little influence on renal blood flow.[3]
The decline in hydraulic pressure between renal artery and glomerular capillaries is greatest along the afferent arteriole, whereas 70% of the decline in post glomerular hydraulic pressure occurs at the efferent arteriole. The last 50–150 µm of afferent arteriole and first early part of efferent arteriole provide most of the pre- and post-glomerular resistances. The barrier to the filtration of fluid and macromolecules includes the glycocalyx lining the endothelial cells, fenestrations of the endothelial layer of glomerular capillaries, the layers of glomerular basement membrane, the filtration slits between the podocytes surrounding the capillaries and the filtration slit diaphragm extending along the filtration slits to connect adjacent foot processes. Breakdown or injury in any of these restrictive barriers may lead to increased passage of albumin and other proteins. The principal resistance change due to autoregulatory adjustments is primarily localized to the preglomerular vasculature. The autoregulation thus occurs with both renal blood flow and GFR. These autoregulation mechanisms provide a powerful mechanism to maintain the intrarenal hemodynamic environment in balance with metabolically determined tubular transport function.[4] The myogenic and tubuloglomerular feedback mechanisms are primarily responsible for the autoregulatory responses. Overall renal hemodynamic function is regulated by complex and intrinsic mechanisms, including sympathetic nervous system, circulating vasoactive factors, endothelial nitric oxide, intrarenal angiotensin II, arachidonic acid metabolites, purinergic factors and paracrine mediators, including ATP, adenosine, nitric oxide and arachidonic acid metabolites.
Body weight has a direct impact on estimated glomerular filtration rate (eGFR). Standard eGFR formulae assume an average adult body surface area of 1.73 m². If a patient's weight or muscle mass differs significantly from this average then calculation of eGFR may prove inaccurate. Standard eGFR formulae overestimate kidney function in obesity.[5] Substantial weight loss may actually reduce absolute filtration though indexed eGFR may stay similar. Studies published by American Society of Nephrologists recommend use of ideal body weight calculated by DuBois formula. eGFR and GFR that were calculated had no bias with BMI > 40.[6] Formulae for eGFR: The standard and widely applicable formula also used in biochemical analyser equipment is the Cockcroft-Gault formula. It was first published in 1976 by asthmalogist Donald William Cockcroft and nephrologist Mathew Henry Gault (1925–2003).
The formula is as follows
(140 - age) × wt / (serum creatinine × 72)
The value was adjusted to body surface area taking 1.73 m² as the standard. This actually estimates creatinine clearance in ml/min. This was primarily used to calculate and modify drug dosages in patients with impaired renal function. The numerator was multiplied by a factor of 0.85 if female, which is named as gender multiplier. Serum creatinine is in mg/dl but if it has been measured in µmol/L then it is divided by 88.4 to convert into mg/dl.
MD calc or clincalc are two eGFR calculator applications that are available.
According to KDIGO 2012 clinical Practice Guidelines:
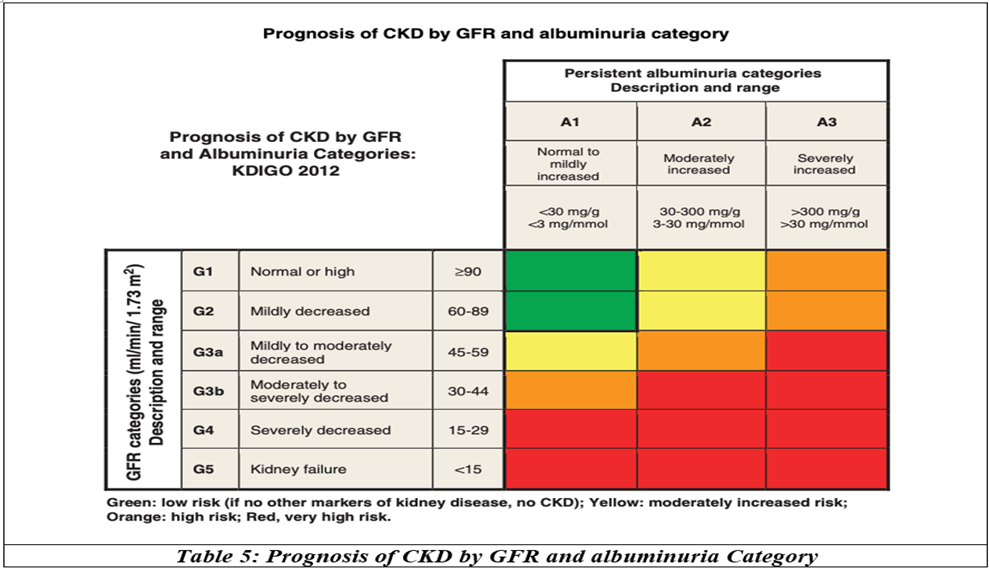
Mayo Quadratic equation was developed to estimate GFR in patients with preserved kidney function. MDRD and other formulae underestimate GFR in patients with preserved kidney function and are only useful to grade an already existing CKD. Rule et al derived the formula considering age and serum creatinine.[7] Diabetes mellitus is the commonest cause of nephropathy and this equation is especially used in prediction of GFR in DM.[8]
Other related calculators of eGFR include
a. MDRD GFR equation which uses creatinine and patient characteristics.
b. CKD-EPI equation which estimates GFR in CKD patients using serum creatinine, cystatin-C or both.
c. Revised Schwartz equation calculates GFR in paediatric patients.
Various nephrology societies have conducted large studies comparing the different formulae and analysed individualised applications of each of them.[9] Cockcroft Gault considered age, weight and serum creatinine, MDRD study explained Modification of Diet in Renal Disease and CKD-EPI equations expanded to Chronic Kidney Disease Epidemiology Collaboration.
However the gold standard GFR measurement is by using Iodine-125-iothalamate, within strata of GFR, gender, age, BMI and body weight. Generally the bias of all formulae were related to age. MDRD and CKD EPI were more close to accuracy according to the above study. The radioisotope tracers I-125 iothalamate and I-131 hippuran were given as continuous infusion after a bolus and plasma creatinine was determined by isotope dilution mass spectrometry.
Calculators with Cockcroft Gault equation estimate clearance of creatinine[10] whereas MDRD estimates GFR.[11] The abbreviated MDRD estimate of kidney function was calculated as 175 × plasma creatinine^-1.154 × age^-0.203
The CKD-EPI estimate[12] of renal function was calculated as follows:
· For women with plasma creatinine < 0.7; (plasma creatinine / 0.7)^-0.329 × (0.993)^age×166 if black; ×144 if white
· For women with plasma creatinine > 0.7; the ratio was (plasma creatinine / 0.7)^-1.209 while other parts of formula were the same.
· For men with plasma creatinine < 0.9; (plasma creatinine / 0.9)^-0.411 × (0.993)^age ×(163 if black) 141 if others
· For men with plasma creatinine > 0.9 (plasma creatinine / 0.9)^-1.209 while other parts of equation remain the same.
It is often necessary to note the differences between eGFR (estimated GFR) and measured GFR (mGFR). eGFR estimates the ability of kidneys to filter the wastes such as creatinine from muscles due to wear and tear or cystatin C, a small protein that slows down the breakdown of other protein cells. This is widely available, cost effective, needs lesser time for results but may be less accurate in cases with early stages of kidney disease (stage 1 & 2). mGFR estimates the ability of kidneys to filter compounds not produced in the body such as inulin (a fibre in plant food), iohexol (a contrast agent). This test is not widely available, more expensive, more time consuming but more accurate and detects early kidney disease. eGFR in pregnancy needs special mention as increased body fluids complicate the application of formula based on BSA. The hyperdynamic circulatory state induces hyperfiltration in pregnancy and the average serum creatinine value of gestational week (GW) from 0 to 3 was the representative serum creatinine value of non pregnant states.[13]
Serum creatinine level typically decreases during pregnancy due to physiologic glomerular hyperfiltration. The clinical practice of estimated GFR based on SCr concentrations might be inapplicable to pregnant women with kidney disease since it does not take into account of the pregnancy-related biological changes.[14] MDRD formula could be used as normal reference range for pregnant women with abnormal kidney function because it does not reflect normal physiological changes during pregnancy.[15]. Women with renal disorders face increased risk of complications such as preeclampsia and preterm delivery.[16] eGFR and obesity: Indexation of mGFR with body surface area using ideal body weight gives less bias than mGFR with body surface area using real body weight.[17]
CONCLUSION:
Estimated Glomerular Filtration Rate has become an integral part of evaluation protocols at least in patient populations with increased risk of renal impairment such as sepsis, trauma, obesity and pre-eclampsia. Radioactive isotope clearance study with I-125 iothalamate or I-131 Hippuran has been the gold standard to calculate or measure GFR called mGFR, but due to constraints in routine feasibility of the above, 2 simple formulae for eGFR were taken up and compared for applications namely Cockcroft Gault and Mayo Quadratic equations. The former was weight dependent and the latter weight independent.
In this study of 168 patients with variable age, diagnosis and BMI distributions it appeared that both the formulae had same results with stage III and IV of kidney disease whereas early detection of CKD was better with Cockcroft Gault (P = 0.02).
Though MDRD and CKD EPI had better sensitivity for detection of early renal dysfunction the former had limitations in patients with preserved renal functions and the latter was practically less feasible in clinical situations as cystatin C estimations were needed.
REFERENCES:
1. George AL, Neilson EG. Cell biology and physiology of kidney. Chap- 320. In: Longo DL, Fauci AS, Kasper DL, et al. Harrison’s Internal Medicine. 22nd edn. McGraw Hill 2025: p: 2363.
2. Seifter JL. Approach to patient with Kidney disease. Chap- 319 In: Longo DL, Fauci AS, Kasper DL, et al. Harrison’s Internal Medicine. 22nd edn. McGraw Hill 2025: p. 2353.
3. Urine formation by kidneys. Chap- 26. In: Hall JE, ed. Guyton and Hall, Textbook of Medical Physiology. 12th edn. Saunders Elsevier 2010:303-23.
4. Luis Gabriel Navar David A. Maddox, Karren A Munger. Renal circulations and glomerular filtration. Chap- 3. In: Yu ASL Brenner and Rector Vol. 1. 11th edn. Elsevier 2020: p. 80.
5. Lemoine S, Guebre-Egziabher F, Sens F, et al. Accuracy of GFR estimation in obese patients. Clin J Am Soc Nephrol 2014;9(4):720-7.
6. Hsu CY, McCulloch CE, Iribarren C, et al. Body mass index and risk for end-stage renal disease. Ann Intern Med 2006;144(1):21-8.
7. Rule AD, Larson TS, Bergstralh EJ, et al. Using serum creatinine to estimate glomerular filtration rate: accuracy in good health and in chronic kidney disease. Ann Intern Med 2004;141(12):929-37.
8. Rigalleau V, Lasseur C, Raffaitin C, et al. The Mayo Clinic quadratic equation improves the prediction of glomerular filtration rate in diabetic subjects. Nephrol Dial Transplant 2007;22(3):813-8.
9. Michels WM, Grootendorst DC, Verduijn M, et al. Performance of the Cockcroft-Gault, MDRD, and new CKD-EPI formulas in relation to GFR, age, and body size. Clin J Am Soc Nephrol 2010;5(6):1003-9.
10. Cockcroft DW, Gault MH. Prediction of creatinine clearance from serum creatinine. Nephron 1976;16(1):31-41.
11. Levey AS, Coresh J, Greene T, et al. Using standardized serum creatinine values in the modification of diet in renal disease study equation for estimating glomerular filtration rate. Ann Intern Med 2006;145(4):247-54.
12. Levey AS, Stevens LA, Schmid CH, et al. A new equation to estimate glomerular filtration rate. Ann Intern Med 2009;150(9):604-12.
13. Ahn K, Lee T, Kang J, et al. Development of a formula for estimated glomerular filtration rate in pregnant women from physiological hyperfiltration of serum creatinine. Sci Rep 2024;14(1):7229.
14. Smith MC, Moran P, Ward MK, et al. Assessment of glomerular filtration rate during pregnancy using the MDRD formula. BJOG 2008;115(1):109-12.
15. Maynard SE, Thadhani R. Pregnancy and the kidney. J Am Soc Nephrol 2009;20:14-22.
16. Harel Z, Park AL, Ray JG. Blunted glomerular hyperfiltration in pregnancy and risk of adverse perinatal outcomes. Am J Kidney Dis 2020;76(2):297-9.
17. de Jong PE, Verhave JC, Pinto-Sietsma SJ, et al. Obesity and target organ damage: the kidney. Int J Obes Relat Metab Disord 2002;26 Suppl 4:S21-4.