Assessment of Obesity and Metabolic Risk Profiles Among Urban and Rural Schoolchildren: A Comparative Cross-Sectional Study.
- Sowmyashree P. , Specialist Medical Officer, Department of Peadiatrics, Subdivision Hospital Kollegal, India.
- Sunitha , Specialist Medical Officer, Department of ENT, Subdivision Hospital Kollegal, India.
- Abhaykiran P. , Assistant Professor, Department of General Medicine, CIMS, Chamarajanagar, India.
Article Information:
Abstract:
Background: Childhood obesity is increasingly associated with early cardiometabolic abnormalities, including central adiposity, hypertension, dyslipidaemia and impaired glucose regulation. Urbanization may increase this risk through dietary transition, physical inactivity and sedentary behaviour. Aim: To assess and compare obesity and metabolic-risk profiles among urban and rural schoolchildren. Materials and Methods: This comparative cross-sectional study included 100 schoolchildren, comprising 50 urban and 50 rural participants. Sociodemographic characteristics, dietary habits, physical activity, screen time and family history were recorded using a structured questionnaire. Height, weight, BMI-for-age, waist circumference, waist-to-height ratio and blood pressure were assessed. Fasting plasma glucose and serum lipid profile were measured using standard laboratory methods. Urban and rural groups and overweight/obese and normal/thin groups were compared using the independent-samples t-test, chi-square test or Fisher’s exact test. Associations were expressed as odds ratios with 95% confidence intervals, and P<0.05 was considered statistically significant. Results: The mean age was 13.5 (2.1) years, and 56.0% of participants were male. Urban children had significantly higher BMI (20.8 versus 18.7 kg/m²; P=0.008), waist circumference (72.4 versus 66.1 cm; P=0.004), systolic blood pressure (113.8 versus 108.9 mmHg; P=0.016) and triglyceride levels (112.4 versus 98.7 mg/dL; P=0.038), as well as lower HDL cholesterol (43.1 versus 47.5 mg/dL; P=0.014). Combined overweight or obesity was more prevalent among urban than rural children (38.0% versus 18.0%; OR=2.79, 95% CI: 1.11-7.00; P=0.026). Central obesity (34.0% versus 14.0%; P=0.019) and waist-to-height ratio ≥0.50 (32.0% versus 12.0%; P=0.016) were also more frequent in urban children. Overweight or obese children had higher odds of elevated blood pressure, impaired fasting glucose, elevated triglycerides, reduced HDL cholesterol and dyslipidaemia. Excessive screen time, insufficient physical activity, frequent sugar-sweetened beverage consumption and a positive family history were significantly associated with overweight or obesity. Conclusion: Urban schoolchildren had a greater burden of general and central obesity and a less favourable metabolic-risk profile than rural children. Excess body weight was associated with clustering of haemodynamic, biochemical, behavioural and familial risk factors. Comprehensive school-based screening and early lifestyle interventions are required to reduce future cardiometabolic disease.
Keywords:
Article :
Introduction:
Childhood obesity has emerged as a major public-health concern because of its rapidly increasing prevalence and its association with cardiometabolic disease during adolescence and adulthood. Globally, more than 390 million children and adolescents aged 5-19 years were overweight in 2022, including over 160 million living with obesity.[1] Obesity during childhood is not merely an excess of body weight; it is a complex condition characterized by abnormal adiposity, insulin resistance, dyslipidaemia, elevated blood pressure and impaired glucose metabolism. These abnormalities may cluster as metabolic syndrome and increase the lifetime risk of type 2 diabetes mellitus, cardiovascular disease, non-alcoholic fatty liver disease and premature mortality. The worldwide prevalence of obesity among children and adolescents has increased substantially over recent decades, with changes in dietary patterns, reduced physical activity, excessive screen time, inadequate sleep and exposure to obesogenic environments contributing to this trend.[2]
India is experiencing a nutritional transition in which childhood undernutrition coexists with a growing burden of overweight and obesity. Urbanization, increasing household income, easy availability of energy-dense processed foods, motorized transportation and reduced opportunities for outdoor activity have contributed to excessive weight gain among schoolchildren. Urban children may have greater exposure to these risk factors than rural children; however, rural communities are also undergoing rapid lifestyle and dietary changes. Indian studies have reported a higher prevalence of obesity and sustained hypertension among urban schoolchildren compared with their rural counterparts, indicating important geographical and socioeconomic disparities.[3] Nevertheless, body mass index alone may not adequately reflect cardiometabolic risk because children with a normal BMI may have central adiposity or biochemical abnormalities. Assessment of waist circumference, waist-to-height ratio, blood pressure, fasting glucose and serum lipid concentrations can therefore provide a more comprehensive evaluation of metabolic risk.
Age- and sex-specific growth references are necessary when assessing obesity among children. The World Health Organization classifies children aged 5-19 years as overweight when their BMI-for-age is above +1 standard deviation and obese when it is above +2 standard deviations of the WHO growth reference.[4] For children aged 10 years and above, the International Diabetes Federation criteria provide a practical framework for identifying metabolic syndrome based on central obesity accompanied by elevated triglycerides, reduced high-density lipoprotein cholesterol, elevated blood pressure or raised fasting plasma glucose.[5] Comparative evidence regarding anthropometric and metabolic risk profiles among urban and rural schoolchildren remains limited in many local settings. Identifying these differences is essential for developing context-specific school health interventions. The present study was therefore undertaken to compare obesity and selected metabolic risk factors among urban and rural schoolchildren.
Aim
To assess and compare obesity and metabolic risk profiles among urban and rural schoolchildren.
Objectives
1. To determine and compare the prevalence of overweight, general obesity and central obesity among urban and rural schoolchildren.
2. To assess and compare blood pressure, fasting glucose, lipid profile and lifestyle-related risk factors and determine their association with obesity among the study participants.
Materials and Methods:
Source of Data
The data were obtained from schoolchildren enrolled in selected urban and rural schools situated within the field-practice area of the study institution. Primary data were collected through interviews, anthropometric measurements, clinical examinations and laboratory investigations. Information regarding age and class of study was verified from school records.
Study Design
A school-based comparative cross-sectional study was conducted.
Study Location
The study was conducted in selected urban and rural schools located in the field-practice areas. One or more schools from each geographical area were selected after obtaining permission from the respective education authorities and school administrations.
Study Duration
The study was conducted over a period of 12 months. This period included participant recruitment, data collection, laboratory investigations, data entry and statistical analysis.
Sample Size
A total of 100 schoolchildren were included. To ensure direct comparison, 50 children were recruited from urban schools and 50 from rural schools. Participants fulfilling the eligibility criteria were selected using stratified random sampling, with strata based on place of residence, age group and sex wherever feasible.
Inclusion Criteria
· Schoolchildren aged 10-18 years enrolled in the selected schools.
· Children who had resided in the respective urban or rural area for at least one year.
· Children whose parents or guardians provided written informed consent.
· Children who provided assent and were willing to undergo anthropometric, clinical and biochemical assessment.
· Children who reported after an overnight fast of 8-12 hours for blood collection.
Exclusion Criteria
· Children with a known endocrine or genetic disorder affecting growth or body weight, including hypothyroidism, Cushing syndrome or syndromic obesity.
· Children receiving corticosteroids, antipsychotic drugs or other medications known to influence weight, glucose or lipid metabolism.
· Children with known diabetes mellitus, chronic kidney disease, chronic liver disease or severe systemic illness.
· Children with physical disabilities that prevented accurate anthropometric measurement.
· Children who were acutely ill at the time of assessment.
· Children or parents who did not provide assent or informed consent.
· Children who did not complete the required clinical or biochemical assessments.
Procedure and Methodology
Approval was obtained from the Institutional Ethics Committee before commencement of the study. Administrative permission was obtained from the education authorities and heads of the selected schools. Parents or guardians received an information sheet explaining the purpose, procedures, potential discomforts and benefits of participation. Written informed consent and child assent were obtained.
A predesigned, pretested questionnaire was used to record sociodemographic characteristics, residence, family type, parental education, socioeconomic status, family history of obesity, hypertension or diabetes, dietary habits, frequency of fruit, vegetable, sweetened beverage and fast-food consumption, physical activity, outdoor play, screen time and sleep duration.
Height was measured without footwear using a portable stadiometer to the nearest 0.1 cm. Weight was measured in light clothing using a calibrated digital weighing scale to the nearest 0.1 kg. Body mass index was calculated as:
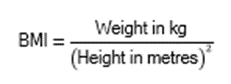
BMI-for-age Z-scores were derived using the WHO 2007 growth reference. Children with BMI-for-age above +1 SD to +2 SD were classified as overweight, while those above +2 SD were classified as obese. Waist circumference was measured midway between the lowest rib and the upper border of the iliac crest at the end of normal expiration. Central obesity was assessed using age- and sex-specific waist-circumference percentiles. Waist-to-height ratio was calculated, with a value ≥0.50 considered indicative of increased central adiposity.
Blood pressure was measured using an appropriately sized cuff after the child had rested for at least five minutes. Two readings were recorded five minutes apart, and their average was used. Abnormal blood pressure was classified according to age-, sex- and height-appropriate paediatric criteria.
Metabolic risk was assessed using fasting plasma glucose, triglycerides, total cholesterol, low-density lipoprotein cholesterol and high-density lipoprotein cholesterol. Among participants aged 10 years or above, metabolic syndrome was assessed using the International Diabetes Federation paediatric criteria: central obesity plus any two of elevated triglycerides, reduced HDL cholesterol, elevated blood pressure or elevated fasting plasma glucose.
Sample Processing
Approximately 5 mL of venous blood was collected under aseptic precautions after an overnight fast of 8-12 hours. Blood for fasting plasma glucose was collected in a fluoride-containing tube, while blood for lipid estimation was collected in a plain or serum-separator tube. Samples were appropriately labelled and transported to the institutional laboratory while maintaining the required temperature conditions.
The serum sample was allowed to clot and was centrifuged at approximately 3,000 revolutions per minute for 10 minutes. Fasting plasma glucose and lipid parameters were estimated using standard enzymatic methods on a calibrated automated biochemistry analyser. Internal quality-control procedures were followed for each analytical batch. Samples that were haemolysed, insufficient or improperly labelled were excluded and recollected whenever feasible. Abnormal findings were communicated confidentially to parents, with advice to seek appropriate medical evaluation.
Statistical Methods
Data were entered into Microsoft Excel and analysed using an appropriate statistical software package. Continuous variables were presented as mean and standard deviation when normally distributed and as median and interquartile range when skewed. Categorical variables were summarized as frequencies and percentages. Prevalence estimates were reported with 95% confidence intervals.
The independent-samples Student’s t-test was used to compare normally distributed continuous variables between urban and rural children. The Mann-Whitney U test was used for non-normally distributed variables. The chi-square test or Fisher’s exact test was applied to compare categorical variables. Associations between obesity and metabolic risk factors were expressed using odds ratios with 95% confidence intervals. Pearson’s or Spearman’s correlation analysis was used to examine relationships between anthropometric and biochemical measurements. Multivariable binary logistic regression was performed to identify independent predictors of overweight/obesity or metabolic risk. A two-sided p value <0.05 was considered statistically significant.
Data Collection
Data were collected using a structured case-record form containing the following sections:
· Sociodemographic and family characteristics.
· Dietary habits and food-frequency information.
· Physical activity, screen time and sleep pattern.
· Family history of obesity and metabolic disorders.
· Height, weight, BMI, waist circumference and waist-to-height ratio.
· Systolic and diastolic blood pressure.
· Fasting plasma glucose and complete lipid profile.
· Final nutritional-status and metabolic-risk classification.
Each participant was assigned a unique identification number. Completed forms were checked daily for accuracy and completeness. Data were stored securely, and participant confidentiality was maintained throughout the study.
Results:
Table 1: Overall comparison of obesity and metabolic-risk profiles among urban and rural schoolchildren (N=100)
|
Variable |
Total (N=100), Mean (SD) or n (%) |
Urban (n=50) |
Rural (n=50) |
Effect estimate (95% CI) |
Test of significance |
P value |
|
Age, years |
13.5 (2.1) |
13.6 (2.1) |
13.3 (2.0) |
MD=0.30 (−0.51 to 1.11) |
t=0.73 |
0.467 |
|
Male sex |
56 (56.0) |
27 (54.0) |
29 (58.0) |
OR=0.85 (0.39-1.87) |
χ²=0.16 |
0.685 |
|
BMI, kg/m² |
19.8 (4.0) |
20.8 (4.2) |
18.7 (3.5) |
MD=2.10 (0.57-3.63) |
t=2.72 |
0.008* |
|
Waist circumference, cm |
69.3 (11.0) |
72.4 (11.2) |
66.1 (9.8) |
MD=6.30 (2.12-10.48) |
t=2.99 |
0.004* |
|
Systolic blood pressure, mmHg |
111.4 (10.3) |
113.8 (10.6) |
108.9 (9.4) |
MD=4.90 (0.92-8.88) |
t=2.45 |
0.016* |
|
Fasting plasma glucose, mg/dL |
89.8 (10.0) |
91.6 (10.8) |
87.9 (8.7) |
MD=3.70 (−0.19 to 7.59) |
t=1.89 |
0.062 |
|
Triglycerides, mg/dL |
105.6 (33.4) |
112.4 (35.6) |
98.7 (29.4) |
MD=13.70 (0.75-26.65) |
t=2.10 |
0.038* |
|
HDL cholesterol, mg/dL |
45.3 (9.1) |
43.1 (9.2) |
47.5 (8.4) |
MD=−4.40 (−7.90 to −0.90) |
t=−2.50 |
0.014* |
|
At least one metabolic-risk abnormality |
34 (34.0) |
23 (46.0) |
11 (22.0) |
OR=3.02 (1.27-7.21) |
χ²=6.42 |
0.011* |
MD: mean difference; OR: odds ratio; HDL: high-density lipoprotein. Reference category for OR: rural children. *Statistically significant at P<0.05.
Among the 100 schoolchildren, the mean age was 13.5 (2.1) years, and 56.0% were male. The urban and rural groups were comparable regarding age (13.6 versus 13.3 years; MD=0.30, 95% CI: −0.51 to 1.11; P=0.467) and sex distribution (54.0% versus 58.0% male; OR=0.85, 95% CI: 0.39-1.87; P=0.685). Urban children had a significantly higher mean BMI than rural children (20.8 versus 18.7 kg/m²; MD=2.10, 95% CI: 0.57-3.63; P=0.008), as well as a greater waist circumference (72.4 versus 66.1 cm; MD=6.30, 95% CI: 2.12-10.48; P=0.004). Mean systolic blood pressure was also significantly higher among urban children (113.8 versus 108.9 mmHg; MD=4.90, 95% CI: 0.92-8.88; P=0.016). Although urban children had a higher mean fasting plasma glucose level than rural children (91.6 versus 87.9 mg/dL), the difference was not statistically significant (MD=3.70, 95% CI: −0.19 to 7.59; P=0.062). Urban children had significantly higher triglyceride levels (112.4 versus 98.7 mg/dL; MD=13.70, 95% CI: 0.75-26.65; P=0.038) and lower HDL cholesterol levels (43.1 versus 47.5 mg/dL; MD=−4.40, 95% CI: −7.90 to −0.90; P=0.014). At least one metabolic-risk abnormality was identified in 34.0% of all participants and was significantly more prevalent among urban than rural children (46.0% versus 22.0%; OR=3.02, 95% CI: 1.27-7.21; P=0.011). Thus, urban residence was associated with a less favourable anthropometric and metabolic-risk profile.
Table 2: Comparison of overweight, general obesity and central obesity among urban and rural schoolchildren (N=100)
|
Nutritional-status indicator |
Total (N=100), n (%) |
Urban (n=50), n (%) |
Rural (n=50), n (%) |
Effect estimate (95% CI) |
Test of significance |
P value |
|
Normal BMI-for-age |
61 (61.0) |
26 (52.0) |
35 (70.0) |
OR=0.46 (0.20-1.05) |
χ²=3.40 |
0.065 |
|
Thinness |
11 (11.0) |
5 (10.0) |
6 (12.0) |
OR=0.81 (0.23-2.83) |
Fisher’s exact test |
1.000 |
|
Overweight |
17 (17.0) |
11 (22.0) |
6 (12.0) |
OR=2.07 (0.70-6.12) |
χ²=0.89 |
0.347 |
|
General obesity |
11 (11.0) |
8 (16.0) |
3 (6.0) |
OR=2.98 (0.74-12.01) |
χ²=1.27 |
0.259 |
|
Combined overweight or obesity |
28 (28.0) |
19 (38.0) |
9 (18.0) |
OR=2.79 (1.11-7.00) |
χ²=4.96 |
0.026* |
|
Central obesity based on waist circumference |
24 (24.0) |
17 (34.0) |
7 (14.0) |
OR=3.16 (1.17-8.49) |
χ²=5.48 |
0.019* |
|
Waist-to-height ratio ≥0.50 |
22 (22.0) |
16 (32.0) |
6 (12.0) |
OR=3.45 (1.22-9.75) |
χ²=5.83 |
0.016* |
BMI: body mass index; OR: odds ratio. Overweight: BMI-for-age >+1 to +2 SD; general obesity: BMI-for-age >+2 SD. Reference category for OR: rural children. *Statistically significant at P<0.05.
Of the 100 schoolchildren, 61.0% had normal BMI-for-age, while 11.0% had thinness, 17.0% were overweight and 11.0% had general obesity. Normal BMI-for-age was more prevalent among rural than urban children (70.0% versus 52.0%); however, the difference did not reach statistical significance (OR=0.46, 95% CI: 0.20-1.05; P=0.065). The prevalence of thinness was similar in urban and rural children (10.0% versus 12.0%; OR=0.81, 95% CI: 0.23-2.83; P=1.000). Overweight was more frequent among urban children than rural children (22.0% versus 12.0%; OR=2.07, 95% CI: 0.70-6.12; P=0.347), as was general obesity (16.0% versus 6.0%; OR=2.98, 95% CI: 0.74-12.01; P=0.259), although these individual differences were not statistically significant. When combined, overweight or obesity was significantly more prevalent in urban children than in rural children (38.0% versus 18.0%; OR=2.79, 95% CI: 1.11-7.00; P=0.026). Similarly, central obesity based on waist circumference was significantly more common among urban children (34.0% versus 14.0%; OR=3.16, 95% CI: 1.17-8.49; P=0.019). A waist-to-height ratio ≥0.50 was observed in 32.0% of urban children compared with 12.0% of rural children, with urban children having approximately 3.5 times higher odds of increased central adiposity (OR=3.45, 95% CI: 1.22-9.75; P=0.016).
Table 3: Association of blood pressure, biochemical and lifestyle-related risk factors with overweight/obesity among schoolchildren (N=100)
|
Risk factor |
Overweight/obese (n=28), Mean (SD) or n (%) |
Normal/thin (n=72), Mean (SD) or n (%) |
Effect estimate (95% CI) |
Test of significance |
P value |
|
Systolic blood pressure, mmHg |
117.9 (10.4) |
108.9 (8.7) |
MD=9.00 (4.59-13.41) |
t=4.02 |
<0.001* |
|
Fasting plasma glucose, mg/dL |
93.8 (11.3) |
87.6 (8.4) |
MD=6.20 (1.50-10.90) |
t=2.68 |
0.010* |
|
Triglycerides, mg/dL |
128.6 (38.7) |
96.9 (27.2) |
MD=31.70 (15.77-47.63) |
t=4.04 |
<0.001* |
|
HDL cholesterol, mg/dL |
39.8 (7.6) |
47.1 (8.5) |
MD=−7.30 (−10.77 to −3.83) |
t=−4.18 |
<0.001* |
|
Elevated blood pressure |
9 (32.1) |
5 (6.9) |
OR=6.35 (1.90-21.18) |
χ²=10.59 |
0.001* |
|
Impaired fasting glucose |
6 (21.4) |
3 (4.2) |
OR=6.27 (1.45-27.13) |
χ²=7.06 |
0.008* |
|
Elevated triglycerides |
11 (39.3) |
8 (11.1) |
OR=5.18 (1.80-14.88) |
χ²=10.79 |
0.001* |
|
Reduced HDL cholesterol |
13 (46.4) |
16 (22.2) |
OR=3.03 (1.20-7.67) |
χ²=5.73 |
0.017* |
|
Any dyslipidaemia |
17 (60.7) |
21 (29.2) |
OR=3.75 (1.50-9.39) |
χ²=8.45 |
0.004* |
|
Screen time ≥2 hours/day |
19 (67.9) |
23 (31.9) |
OR=4.50 (1.75-11.56) |
χ²=10.64 |
0.001* |
|
Physical activity <60 minutes/day |
18 (64.3) |
20 (27.8) |
OR=4.68 (1.82-12.07) |
χ²=11.22 |
<0.001* |
|
Sugar-sweetened beverages ≥3 times/week |
20 (71.4) |
27 (37.5) |
OR=4.17 (1.59-10.91) |
χ²=9.28 |
0.002* |
|
Family history of obesity, diabetes or hypertension |
14 (50.0) |
18 (25.0) |
OR=3.00 (1.20-7.47) |
χ²=5.85 |
0.016* |
MD: mean difference; OR: odds ratio; HDL: high-density lipoprotein. Odds ratios represent the odds of exposure or abnormality among overweight/obese children relative to normal/thin children. *Statistically significant at P<0.05.
Overweight or obese children had a significantly less favourable cardiometabolic profile than normal or thin children. Their mean systolic blood pressure was higher by 9.00 mmHg (117.9 versus 108.9 mmHg; 95% CI: 4.59-13.41; P<0.001), while their fasting plasma glucose was higher by 6.20 mg/dL (93.8 versus 87.6 mg/dL; 95% CI: 1.50-10.90; P=0.010). They also had substantially higher triglyceride levels (128.6 versus 96.9 mg/dL; MD=31.70, 95% CI: 15.77-47.63; P<0.001) and lower HDL cholesterol levels (39.8 versus 47.1 mg/dL; MD=−7.30, 95% CI: −10.77 to −3.83; P<0.001). Elevated blood pressure was present in 32.1% of overweight or obese children compared with 6.9% of normal or thin children (OR=6.35, 95% CI: 1.90-21.18; P=0.001). Similarly, overweight or obesity was significantly associated with impaired fasting glucose (21.4% versus 4.2%; OR=6.27, 95% CI: 1.45-27.13; P=0.008), elevated triglycerides (39.3% versus 11.1%; OR=5.18, 95% CI: 1.80-14.88; P=0.001), reduced HDL cholesterol (46.4% versus 22.2%; OR=3.03, 95% CI: 1.20-7.67; P=0.017) and any dyslipidaemia (60.7% versus 29.2%; OR=3.75, 95% CI: 1.50-9.39; P=0.004). Lifestyle-related risk factors were also more prevalent among overweight or obese children, including screen time ≥2 hours/day (67.9% versus 31.9%; OR=4.50; P=0.001), physical activity below 60 minutes/day (64.3% versus 27.8%; OR=4.68; P<0.001) and consumption of sugar-sweetened beverages at least three times per week (71.4% versus 37.5%; OR=4.17; P=0.002). A family history of obesity, diabetes or hypertension was also significantly associated with overweight or obesity (50.0% versus 25.0%; OR=3.00, 95% CI: 1.20-7.47; P=0.016).
Discussion:
The present comparative cross-sectional study demonstrated a distinctly less favourable obesity and metabolic-risk profile among urban schoolchildren. Although the urban and rural groups were comparable in age and sex distribution, urban children had significantly higher BMI, waist circumference, systolic blood pressure and triglyceride concentrations and significantly lower HDL cholesterol. These findings reflect the growing influence of urbanization, dietary transition and sedentary behaviour on childhood cardiometabolic health. The global pooled analysis by the NCD Risk Factor Collaboration et al. (2024)[1] showed that obesity among children and adolescents increased approximately fourfold between 1990 and 2022, confirming that childhood obesity has become a major concern in both high-income and developing countries.
In the present study, mean BMI was significantly higher among urban than rural children (20.8 versus 18.7 kg/m²; P=0.008), while mean waist circumference was 6.3 cm greater in the urban group (P=0.004). These findings agree with Mohan et al. (2019)[2], who studied urban and rural adolescents in North India and reported obesity prevalences of 11.0% and 2.7%, respectively. They also found that urban residence was independently associated with obesity. Greater purchasing power, availability of energy-dense foods, reliance on motorized transport, reduced outdoor activity and longer screen exposure may account for the higher adiposity observed among urban children.
Ranjani et al. (2016)[3], in a systematic review of Indian studies, reported that the pooled prevalence of combined childhood overweight and obesity after 2010 was approximately 19.3%. They also noted a progressive increase in obesity among children from different socioeconomic groups. The combined prevalence of overweight or obesity in the present study was higher at 28.0%, including 17.0% overweight and 11.0% general obesity. Differences in age composition, geographical location, socioeconomic status, diagnostic criteria and the relatively small sample may explain the higher prevalence. Verma et al. (2023)[4], using data from India’s Comprehensive National Nutrition Survey, reported overweight or obesity in 4.18% of school-age children and 4.99% of adolescents. Their lower national estimates included children from diverse socioeconomic and geographical settings, whereas the current study included equal numbers of urban and rural schoolchildren and may have captured a population experiencing a more rapid nutritional transition.
Combined overweight or obesity was significantly more prevalent among urban than rural children in the present study (38.0% versus 18.0%; OR=2.79, 95% CI: 1.11-7.00; P=0.026). Although overweight and general obesity were individually more common in urban children, their separate comparisons were not statistically significant. The wide confidence intervals indicate limited precision due to the small number of children in each category. Nevertheless, the consistent direction of the effect across BMI, waist circumference and waist-to-height ratio strengthens the evidence of an urban excess. The persistence of thinness in 11.0% of participants, alongside a 28.0% prevalence of overweight or obesity, also illustrates the double burden of malnutrition among Indian schoolchildren.
Central obesity based on waist circumference affected 24.0% of all participants and was significantly more prevalent in urban children than rural children (34.0% versus 14.0%; OR=3.16; P=0.019). Similarly, a waist-to-height ratio ≥0.50 was found in 32.0% of urban and 12.0% of rural children (OR=3.45; P=0.016). Sardinha et al. (2016)[5] found that BMI, waist circumference and waist-to-height ratio were all useful for identifying increased cardiometabolic risk among children and adolescents. Their findings support the inclusion of measures of abdominal adiposity alongside BMI in school health screening. Al-Domi et al. (2019)[6] further demonstrated that children with greater waist circumference had higher blood pressure, triglyceride and LDL cholesterol levels, lower HDL cholesterol and evidence of subclinical atherosclerosis. Thus, the higher prevalence of central obesity observed in the current urban group may have important long-term cardiovascular implications.
Urban children also had significantly higher systolic blood pressure than rural children (113.8 versus 108.9 mmHg; P=0.016). This finding corresponds with Mohan et al. (2019)[2], who reported sustained hypertension in 8.4% of urban compared with 5.7% of rural adolescents. In the present analysis, overweight or obese children had a mean systolic blood pressure 9.0 mmHg higher than normal or thin children (P<0.001), and the odds of elevated blood pressure were more than six times greater (OR=6.35, 95% CI: 1.90-21.18). These results indicate that obesity-related haemodynamic alterations are already detectable during school age and support routine blood-pressure measurement in overweight and obese children.
The biochemical profile also differed by residence and nutritional status. Urban children had significantly higher triglycerides and lower HDL cholesterol than rural children. Among overweight or obese children, mean triglycerides were 31.7 mg/dL higher, while mean HDL cholesterol was 7.3 mg/dL lower than in normal or thin children. Elevated triglycerides, reduced HDL cholesterol and any dyslipidaemia were associated with approximately fivefold, threefold and fourfold higher odds, respectively, among overweight or obese participants. Al-Domi et al. (2019)[6] similarly observed higher triglycerides and lower HDL cholesterol in children with greater abdominal adiposity. Sawant et al. (2019)[7], in a study of overweight and obese Indian children, showed that clustering of waist circumference, blood pressure, glucose and lipid abnormalities could be captured using a continuous metabolic-syndrome score. These findings emphasize that apparently healthy obese children may already possess multiple cardiovascular risk factors.
Fasting plasma glucose was higher among urban than rural children, but the difference narrowly missed statistical significance (91.6 versus 87.9 mg/dL; P=0.062). In contrast, overweight or obese children had significantly higher mean fasting glucose than normal or thin children (93.8 versus 87.6 mg/dL; P=0.010), and impaired fasting glucose was approximately six times more likely among them. The absence of a significant urban-rural difference may reflect the relatively early stage of glucose dysregulation in this young population. Nevertheless, its significant association with excess body weight indicates emerging insulin resistance. The simultaneous presence of high triglycerides, low HDL cholesterol, elevated blood pressure and impaired fasting glucose represents early clustering of metabolic-syndrome components.
At least one metabolic-risk abnormality was present in 34.0% of all children and was more frequent among urban than rural participants (46.0% versus 22.0%; OR=3.02; P=0.011). This observation is consistent with the findings of Kirti et al. (2023)[8], who analysed nationally representative Indian adolescent data and demonstrated an association between obesogenic dietary patterns and metabolic-syndrome components. The results suggest that geographic residence influences metabolic health through an interrelated group of dietary, behavioural, socioeconomic and environmental exposures rather than through a single risk factor.
Lifestyle characteristics were strongly associated with overweight or obesity. Screen time of at least two hours per day was reported by 67.9% of overweight or obese children compared with 31.9% of normal or thin children, corresponding to an OR of 4.50. Physical activity below 60 minutes per day was similarly associated with excess body weight (OR=4.68). Al-Saadi et al. (2023)[9] reported substantial prevalences of overweight, obesity and central obesity among schoolchildren and highlighted the contribution of unhealthy lifestyle behaviours. Excessive screen use may promote weight gain through reduced energy expenditure, prolonged sitting, exposure to food advertising and increased snacking. However, because the current study was cross-sectional, reverse causation is possible: children with obesity may also be less inclined to participate in physical activity.
Frequent consumption of sugar-sweetened beverages was observed in 71.4% of overweight or obese participants compared with 37.5% of normal or thin children and was associated with more than four times higher odds of overweight or obesity. This supports the results of Kirti et al. (2023)[8], who linked obesogenic dietary patterns with an unfavourable metabolic profile among Indian adolescents. Consumption of sweetened beverages contributes substantial rapidly absorbable carbohydrate without producing equivalent satiety and may promote excessive caloric intake, hepatic lipogenesis, hypertriglyceridaemia and insulin resistance.
A family history of obesity, diabetes or hypertension was also significantly associated with overweight or obesity (OR=3.00; P=0.016). This association may reflect genetic susceptibility as well as shared family dietary practices, physical-activity patterns and socioeconomic conditions. Afshin et al. (2017)[10] demonstrated that elevated BMI contributes substantially to cardiovascular disease, diabetes and other chronic health outcomes worldwide. Identification of children with a positive family history may therefore enable targeted counselling and earlier metabolic screening.
Conclusion:
The study demonstrated a substantial burden of overweight, obesity and associated metabolic abnormalities among schoolchildren, with urban children having a significantly less favourable risk profile than rural children. Urban participants had higher BMI, waist circumference, systolic blood pressure and triglyceride levels, lower HDL cholesterol and approximately three times greater odds of having at least one metabolic-risk abnormality. Combined overweight or obesity, central obesity and a waist-to-height ratio ≥0.50 were also significantly more prevalent among urban children. Irrespective of residence, overweight or obese children showed greater frequencies of elevated blood pressure, impaired fasting glucose, dyslipidaemia, physical inactivity, prolonged screen time and frequent consumption of sugar-sweetened beverages. These findings emphasize the need for integrated school-based screening using BMI-for-age, waist circumference, waist-to-height ratio and blood pressure, followed by biochemical assessment of high-risk children. Early lifestyle interventions involving schools, families and health services are essential to prevent the progression of childhood obesity to diabetes and cardiovascular disease in adulthood.
LIMITATIONS
The study had several limitations. First, its cross-sectional design identified associations but could not establish temporal or causal relationships between lifestyle factors, obesity and metabolic abnormalities. Second, the sample size was relatively small, comprising only 100 children, which reduced statistical power and resulted in wide confidence intervals for some estimates. Third, the study was conducted in selected schools from a limited geographical area; therefore, the findings may not be generalizable to all urban and rural schoolchildren. Fourth, dietary habits, physical activity, screen time and family history were self-reported and were susceptible to recall and social-desirability bias. Fifth, a single assessment of fasting glucose, lipid profile and blood pressure might have resulted in measurement variability or misclassification. Pubertal stage, which can influence adiposity, insulin sensitivity and lipid concentrations, was not evaluated. Other potentially important variables, including insulin levels, glycated haemoglobin, liver enzymes, dietary energy intake, sleep quality, parental BMI and detailed socioeconomic indicators, were also not assessed. Finally, residual confounding could not be excluded, and longitudinal studies with larger representative samples are required to confirm the findings.
References:
1. NCD Risk Factor Collaboration (NCD-RisC). Worldwide trends in underweight and obesity from 1990 to 2022: a pooled analysis of 3663 population-representative studies with 222 million children, adolescents, and adults. Lancet. 2024;403(10431):1027-50.
2. Mohan B, Verma A, Singh K, Singh K, Sharma S, Bansal R, et al. Prevalence of sustained hypertension and obesity among urban and rural adolescents: a school-based, cross-sectional study in North India. BMJ Open. 2019;9(9):e027134.
3. Ranjani H, Mehreen TS, Pradeepa R, Anjana RM, Garg R, Anand K, et al. Epidemiology of childhood overweight and obesity in India: a systematic review. Indian J Med Res. 2016;143(2):160-74.
4. Verma M, Aditi A, Kapoor N, Sharma P, Kakkar M, Kakkar R, et al. Childhood obesity and essential micronutrients: insights from India’s Comprehensive National Nutrition Survey (2016-18). Diabetes Ther. 2023;14(8):1267-83.
5. Sardinha LB, Santos DA, Silva AM, Grøntved A, Andersen LB, Ekelund U. A comparison between BMI, waist circumference, and waist-to-height ratio for identifying cardiometabolic risk in children and adolescents. PLoS One. 2016;11(2):e0149351.
6. Al-Domi H, Al-Shorman A. Increased waist circumference is associated with subclinical atherosclerosis in schoolchildren. Diabetes Metab Syndr. 2019;13(1):264-9.
7. Sawant SP, Amin AS. Use of continuous metabolic syndrome score in overweight and obese children. Indian J Pediatr. 2019;86(10):909-14.
8. Kirti K, Singh SK. Obesogenic diet and metabolic syndrome among adolescents in India: data-driven cluster analysis. BMC Cardiovasc Disord. 2023;23(1):393.
9. Al-Saadi A, Al-Harbi M, Waly M, Al-Daghri N. Obesity and lifestyle behaviours among in-school children in Oman: a cross-sectional study. East Mediterr Health J. 2023;29(8):608-16.
10. Afshin A, Forouzanfar MH, Reitsma MB, Sur P, Estep K, Lee A, et al. Health effects of overweight and obesity in 195 countries over 25 years. N Engl J Med. 2017;377(1):13-27.