Correlation Of Aspartate Aminotransferase-To-Platelet Ratio Index (Apri) With Child–Turcotte–Pugh (Ctp) And Model For End-Stage Liver Disease (Meld) Scores In Patients Of Liver Cirrhosis: A Cross-Sectional Observational Study.
- Shravankumar Potkar , Assistant Professor, Department of General Medicine, BLDE (DU) Shri B M Patil Medical College,Hospital and Research Centre, Vijayapura, Karnataka.
- Suma V Halligudi , Assistant Professor, Department of Pediatrics, KIMS, Koppal, Karnataka.
- Manjunath S Hiremani , Assistant Professor, Department of Medical Oncology, Kidwai Memorial Institute of Oncology,Kalaburagi,Karnataka
Article Information:
Abstract:
Background: Liver cirrhosis is a major contributor to global mortality. Bedside prognostic scores such as the Child–Turcotte–Pugh (CTP) and Model for End-Stage Liver Disease (MELD) are widely used, but rely on a combination of clinical and biochemical inputs. The aspartate aminotransferase-to-platelet ratio index (APRI) is a simpler non-invasive index originally validated for fibrosis prediction. The relationship of APRI with established prognostic scores in heterogeneous cirrhotic cohorts remains incompletely characterised. Objectives: To study the correlation of APRI score with CTP and MELD scores in patients of liver cirrhosis, and to evaluate the diagnostic performance of APRI for detection of cirrhosis. Methods: A prospective, observational, cross-sectional study was conducted at a tertiary care teaching hospital in Vijayapura, Karnataka, from May 2023 to April 2024. Fifty-one patients of liver cirrhosis aged ≥18 years (cases) and fifty healthy volunteers (controls) were enrolled. Demographic, clinical, and biochemical parameters were recorded, and APRI, CTP, and MELD scores were calculated. Data were analysed using SPSS v22.0; Pearson and Spearman correlations were computed, and receiver operating characteristic (ROC) curve analysis was performed. Results: Cases (92.2% male, mean age 45.65 ± 11.97 years) had significantly higher APRI scores than controls (2.02 ± 2.10 vs 0.33 ± 0.17; p < 0.0001). Within cirrhotic cases, APRI showed weak, statistically non-significant correlation with CTP (r = −0.122, p = 0.395) and MELD (r = −0.086, p = 0.554). APRI demonstrated excellent discriminatory ability for cirrhosis versus healthy controls (AUC = 0.919; sensitivity 86.3%, specificity 92.0% at cut-off 0.553). CTP and MELD were strongly correlated (r = 0.809, p < 0.001). Conclusion: APRI is a powerful screening index for liver cirrhosis but does not reliably grade severity once cirrhosis is established. CTP and MELD remain superior for severity stratification.
Keywords:
Article :
INTRODUCTION:
Liver cirrhosis represents the end-stage of progressive hepatic fibrosis and is characterised by diffuse architectural distortion of the liver parenchyma with regenerative nodules surrounded by fibrous bands. It is among the leading non-communicable causes of mortality worldwide and constitutes a substantial proportion of preventable adult deaths. According to the Global Burden of Disease (GBD) 2017 collaborators, cirrhosis and other chronic liver diseases were responsible for approximately 1.32 million deaths globally in 2017, with India contributing a disproportionate share owing to the rising prevalence of viral hepatitis, alcohol use, and non-alcoholic fatty liver disease.1 Liver disease has emerged as the tenth leading cause of death across the country, and the burden continues to rise in younger working-age adults.2 This makes accurate, accessible, and reproducible assessment of disease severity a clinical and public health priority.
The aetiological landscape of cirrhosis in India has shifted notably over the past two decades. While viral hepatitis B and C dominated earlier cohorts, alcohol-related liver disease has now emerged as the most common cause across multi-centre Indian series, accounting for approximately 34.3% of all chronic liver disease cases, followed by viral hepatitis (B + C ≈ 31.7%) and non-alcoholic fatty liver disease (≈14.4%).3 This aetiological diversity has implications for prognostic assessment, because biomarkers that perform well in one aetiology, such as hepatitis C where most fibrosis markers were originally derived, may not extrapolate uniformly to alcohol-related or non-alcoholic cirrhosis cohorts encountered in Indian practice.
Several bedside scoring systems are routinely used to stratify cirrhosis severity. The Child–Turcotte–Pugh (CTP) score, originally derived by Pugh and colleagues in 1973 from work on oesophageal variceal bleeding, combines serum bilirubin, serum albumin, prothrombin time or international normalised ratio (INR), presence and grade of ascites, and grade of hepatic encephalopathy.4 Patients are categorised into Class A (5–6 points, well-compensated), Class B (7–9, significant functional compromise), and Class C (10–15, decompensated). Despite its widespread acceptance, the CTP score has limitations: ascites and encephalopathy are subjectively graded with limited inter-observer reliability, and the score uses a ceiling effect for serum bilirubin and prothrombin time that may not reflect very advanced disease.
To overcome these limitations, the Model for End-Stage Liver Disease (MELD) score was introduced by Kamath and colleagues in 2001 as an entirely objective, continuous, laboratory-based index using serum bilirubin, creatinine, and INR.5 Originally developed to predict short-term mortality after transjugular intrahepatic portosystemic shunt (TIPS), MELD has since been adopted as the principal allocation tool for liver transplantation in most western and many Asian countries. MELD has been shown to predict three-month and one-year mortality with greater consistency than CTP, particularly in patients with decompensated cirrhosis and renal dysfunction.6 A large systematic review by Cholongitas et al. demonstrated that MELD outperformed CTP for prediction of mortality in the immediate peri-transplant period, while CTP retained value for stratifying outpatient cirrhotic cohorts.7
Despite their utility, both CTP and MELD require multiple laboratory parameters and, in the case of CTP, clinician-graded clinical findings. There is therefore continuing interest in simpler indices that can be derived from routine laboratory tests already available in primary and secondary care settings. The aspartate aminotransferase-to-platelet ratio index (APRI) was introduced by Wai and colleagues in 2003 as a non-invasive predictor of significant fibrosis and cirrhosis in patients with chronic hepatitis C.8 APRI is calculated using the formula: APRI = [(AST/upper limit of normal AST) × 100] / Platelet count (×10⁹/L). The rationale is straightforward: hepatocellular injury releases AST, while progressive portal hypertension and bone-marrow suppression cause thrombocytopenia; the ratio therefore captures two pathophysiological hallmarks of advancing liver disease in a single, easily computable number.
The original Wai et al. study reported that APRI ≥ 1.5 had sensitivity of 76% and specificity of 71% for predicting cirrhosis, with an AUROC of 0.89.8 Subsequent systematic reviews and meta-analyses by Shaheen and Myers (22 studies; summary AUROC of 0.84 for cirrhosis) and by Lin et al. (40 studies; n = 8,739; summary AUROC of 0.83 for cirrhosis with cut-off 1.0 yielding sensitivity 76% and specificity 72%) confirmed the diagnostic accuracy of APRI in hepatitis C–related fibrosis.9,10 The Loaeza-del-Castillo et al. cohort extended these findings to non-hepatitis C aetiologies, including alcoholic and cryptogenic cirrhosis, demonstrating reasonable—though somewhat reduced—performance across causes.11 Snyder and colleagues subsequently validated APRI in an independent United States cohort and emphasised its operational advantage in resource-limited settings where transient elastography is unavailable.12
While the value of APRI for detecting cirrhosis is well established, its role in grading the severity of established cirrhosis is less clear. Biologically, AST and platelet count are markers of ongoing hepatocellular necrosis and portal hypertension respectively, whereas CTP and MELD capture synthetic dysfunction, renal involvement, and clinical decompensation. The mechanistic overlap is therefore partial, and one might expect APRI to correlate moderately—but not strongly—with severity scores once frank cirrhosis is established. In burnt-out cirrhosis with low hepatocellular turnover, AST may paradoxically decline even as functional reserve continues to deteriorate. Conversely, episodes of acute-on-chronic liver injury may elevate AST and inflate APRI without proportionate changes in CTP or MELD.13
Studies addressing the APRI–CTP and APRI–MELD relationship have produced inconsistent results. Some have reported moderate positive correlations (r = 0.3–0.5), supporting APRI as an adjunct severity marker, while others have found weak or non-significant associations once the analysis is confined to patients with established cirrhosis. The natural-history work of D'Amico, Garcia-Tsao and Pagliaro summarising 118 studies underscores that prognostication in cirrhosis depends critically on the disease stage (compensated versus decompensated) and the dominant complications, suggesting that no single biomarker is likely to capture severity uniformly across the disease spectrum.14 The systematic review and meta-analysis by Peng, Qi and Guo comparing CTP and MELD in 44 studies further illustrated that even between these two established scores, performance varies substantially with clinical context.15
In view of this, the present study was undertaken at a tertiary care centre in Karnataka, India, where the aetiological mix of cirrhosis differs substantially from the western hepatitis C–dominated cohorts in which APRI was originally validated. Alcohol-related cirrhosis predominates in our region, and patients frequently present in a decompensated state. We therefore evaluated whether APRI correlated with CTP and MELD scores in this cohort, and how well APRI distinguished cirrhotic patients from healthy controls. By examining all three scoring systems concurrently in the same patients, we aimed to provide clinicians with practical guidance on whether APRI can serve as a stand-alone severity index, or whether it should be regarded primarily as a screening tool for the presence of cirrhosis.
AIMS AND OBJECTIVES
Aim: To study the correlation between Aspartate Aminotransferase to Platelet Ratio Index (APRI) and Child–Turcotte–Pugh score (CTP) and Model for End Stage Liver Disease (MELD) score in patients of liver cirrhosis.
Primary Objective: To assess the correlation of APRI score with CTP score in patients of liver cirrhosis.
Secondary Objectives: (i) To assess the correlation of APRI score with MELD score in patients of liver cirrhosis; (ii) To evaluate the diagnostic accuracy of APRI in distinguishing cirrhotic patients from healthy controls.
MATERIALS AND METHODS:
Study design and setting
This was a prospective, observational, cross-sectional study conducted in the Department of General Medicine at Shri B. M. Patil Medical College Hospital and Research Centre, Vijayapura, Karnataka, India, a tertiary care teaching hospital catering to a predominantly rural and semi-urban population of north Karnataka.
Study duration
The study was carried out over a period of twelve months, from May 2023 to April 2024.
Study population
A total of 101 participants were enrolled and stratified into two groups. Group I (cases) comprised 51 adult patients of liver cirrhosis who were either admitted to the medical wards or attended the outpatient department during the study period. Group II (controls) comprised 50 age- and sex-matched healthy volunteers recruited from attendants of unrelated patients and hospital staff.
Sample size
Sample size was calculated using a convenience sampling approach based on the projected case load of cirrhotic patients at the institution during the study period. Fifty-one cases and fifty controls were considered adequate to detect a moderate correlation coefficient (r ≈ 0.4) between APRI and severity scores with 80% power at a two-sided alpha of 0.05.
Inclusion criteria
• Patients aged 18 years or older, of either sex.
• Patients diagnosed with liver cirrhosis on the basis of clinical features (jaundice, ascites, hepatic encephalopathy, gastrointestinal bleed, hepatosplenomegaly) supported by ultrasonographic evidence of a coarse echotexture liver, surface nodularity, and/or features of portal hypertension.
• Patients who provided written informed consent.
Exclusion criteria
• Patients with hepatic disorders other than cirrhosis (acute viral hepatitis, drug-induced liver injury, hepatocellular carcinoma without underlying cirrhosis).
• Patients with haematological disorders or known malignancy.
• Patients with co-existing significant chronic illnesses such as uncontrolled diabetes mellitus, hypertension, cardiac disease, chronic kidney disease, or recent major surgery.
• Patients who declined to participate.
Data collection
After obtaining written informed consent, a detailed history was elicited covering presenting symptoms, duration of illness, alcohol intake, risk factors for viral hepatitis, drug history, comorbidities, and family history. A complete general physical and systemic examination was performed. Venous blood samples were drawn under aseptic precautions and analysed for complete blood count, liver function tests (serum bilirubin, AST, ALT, total protein, albumin), renal function tests (urea, creatinine), serum ammonia, coagulation profile (prothrombin time, INR), and viral serology where indicated. Abdominal ultrasonography was performed in all participants to confirm cirrhosis-related morphological changes and to document ascites, splenomegaly, and portal vein diameter.
Score calculation
The APRI score was calculated using the formula: APRI = [(AST observed ÷ AST upper limit of normal) × 100] ÷ Platelet count (×10⁹/L), with the upper limit of normal AST taken as 40 IU/L per the laboratory reference range. The CTP score was calculated as the sum of points assigned to serum bilirubin, serum albumin, INR, ascites, and hepatic encephalopathy per the standard 5–15 point scale, and patients were classified as Class A (5–6), B (7–9), or C (10–15). The MELD score was calculated as 3.78 × ln(bilirubin mg/dL) + 11.2 × ln(INR) + 9.57 × ln(creatinine mg/dL) + 6.43, rounded to the nearest whole number per the United Network for Organ Sharing (UNOS) convention.
Statistical analysis
Data were entered into Microsoft Excel and analysed using SPSS version 22.0 (IBM Corporation, Armonk, NY, USA). Continuous variables were summarised as mean ± standard deviation (SD) or median with interquartile range depending on the distribution as assessed by the Shapiro–Wilk test. Categorical variables were summarised as frequencies and percentages. The independent samples t-test or Mann–Whitney U test was used to compare continuous variables between cases and controls, as appropriate.
Pearson's product–moment correlation coefficient (r) and Spearman's rank correlation (ρ) were calculated to study the relationship of APRI with CTP and MELD scores. Receiver operating characteristic (ROC) curve analysis was performed to determine the diagnostic performance of APRI, with the optimal cut-off identified using the Youden index. A two-sided p-value < 0.05 was considered statistically significant.
Ethical considerations
The study was conducted in accordance with the Declaration of Helsinki and Good Clinical Practice guidelines. Institutional Ethics Committee approval was obtained prior to commencement, and written informed consent was obtained from every participant.
RESULTS:
A total of 101 participants — 51 cirrhotic patients (Group I) and 50 healthy controls (Group II) — were enrolled and analysed.
Baseline characteristics and biochemical profile
The two groups were comparable for age (45.65 ± 11.97 vs 48.10 ± 16.14 years; p = 0.393) and sex distribution (males 92.2% vs 78.0%; χ² p = 0.085). All measured biochemical parameters except serum creatinine were significantly different between cases and controls. Cases demonstrated markedly elevated serum ammonia, AST, ALT, bilirubin, prothrombin time, INR, and significantly lower platelet counts compared with controls. The CTP, MELD, and APRI scores were all significantly higher in cases than controls (all p < 0.0001). Detailed comparison is presented in Table 1.
Table 1. Comparison of demographic, biochemical, and prognostic score parameters between cases and controls.
|
Parameter |
Cases (n = 51) |
Controls (n = 50) |
Test |
p-value |
|
Age (years), mean ± SD |
45.65 ± 11.97 |
48.10 ± 16.14 |
t-test |
0.393 |
|
Sex — Male, n (%) |
47 (92.2%) |
39 (78.0%) |
χ² |
0.085 |
|
Sex — Female, n (%) |
4 (7.8%) |
11 (22.0%) |
— |
— |
|
Serum ammonia (μmol/L) |
33.14 ± 10.10 |
17.20 ± 4.03 |
MWU |
< 0.0001 |
|
Platelet count (×10³/μL) |
159.06 ± 91.61 |
258.84 ± 105.00 |
MWU |
< 0.0001 |
|
Serum creatinine (mg/dL) |
0.96 ± 0.48 |
1.29 ± 3.25 |
MWU |
0.302 |
|
Serum bilirubin (mg/dL) |
5.46 ± 7.65 |
0.84 ± 0.35 |
MWU |
< 0.0001 |
|
SGOT/AST (IU/L) |
97.78 ± 76.23 |
28.96 ± 10.16 |
MWU |
< 0.0001 |
|
SGPT/ALT (IU/L) |
44.61 ± 32.50 |
29.57 ± 13.63 |
MWU |
0.028 |
|
Prothrombin time (sec) |
15.56 ± 5.44 |
11.00 ± 0.43 |
MWU |
< 0.0001 |
|
INR |
1.34 ± 0.44 |
0.94 ± 0.09 |
MWU |
< 0.0001 |
|
CTP score |
8.96 ± 1.62 |
5.00 ± 0.00 |
MWU |
< 0.0001 |
|
MELD score |
14.28 ± 6.08 |
6.00 ± 0.00 |
MWU |
< 0.0001 |
|
APRI score |
2.02 ± 2.10 |
0.33 ± 0.17 |
MWU |
< 0.0001 |
MWU = Mann–Whitney U test. p < 0.05 considered statistically significant.
Severity stratification within cirrhotic cases
Among 51 cirrhotic cases, the majority were in CTP Class B (58.8%) and Class C (35.3%), with only 5.9% falling in Class A. By MELD strata, 68.0% had MELD scores between 10 and 19, while 16.0% had MELD ≥ 20. By APRI categories, 51.0% had APRI > 1.5 indicating high probability of cirrhosis, 35.3% fell in the intermediate range (0.5–1.5), and 13.7% had APRI < 0.5 despite established cirrhosis. The full distribution is presented in Table 2.
Table 2. Distribution of cirrhotic cases across CTP classes, MELD severity strata, and APRI categories.
|
Severity category |
n |
% |
|
CTP class (n = 51) |
|
|
|
Class A (5–6) |
3 |
5.9 |
|
Class B (7–9) |
30 |
58.8 |
|
Class C (10–15) |
18 |
35.3 |
|
MELD score stratum (n = 50) |
|
|
|
< 10 |
8 |
16.0 |
|
10–19 |
34 |
68.0 |
|
20–29 |
7 |
14.0 |
|
≥ 30 |
1 |
2.0 |
|
APRI category (n = 51) |
|
|
|
< 0.5 (no significant fibrosis) |
7 |
13.7 |
|
0.5–1.5 (significant fibrosis) |
18 |
35.3 |
|
> 1.5 (cirrhosis) |
26 |
51.0 |
Correlation of APRI with CTP and MELD scores (primary and secondary objectives)
Within the cirrhotic cohort, APRI showed weak negative and statistically non-significant correlation with both CTP and MELD scores. In contrast, CTP and MELD demonstrated a strong, highly significant positive correlation, consistent with their shared dependence on bilirubin and INR. Results are summarised in Table 3 and visualised in Figures 1, 2 and 3.
Table 3. Correlation of APRI score with CTP and MELD scores in cirrhotic cases.
|
Correlation pair |
n |
Pearson r |
95% CI |
p (Pearson) |
Spearman ρ |
p (Spearman) |
|
APRI vs CTP |
51 |
−0.122 |
−0.384 to 0.159 |
0.395 |
0.080 |
0.578 |
|
APRI vs MELD |
50 |
−0.086 |
−0.356 to 0.197 |
0.554 |
0.054 |
0.711 |
|
CTP vs MELD |
50 |
0.809 |
0.685 to 0.888 |
< 0.001 |
0.725 |
< 0.001 |
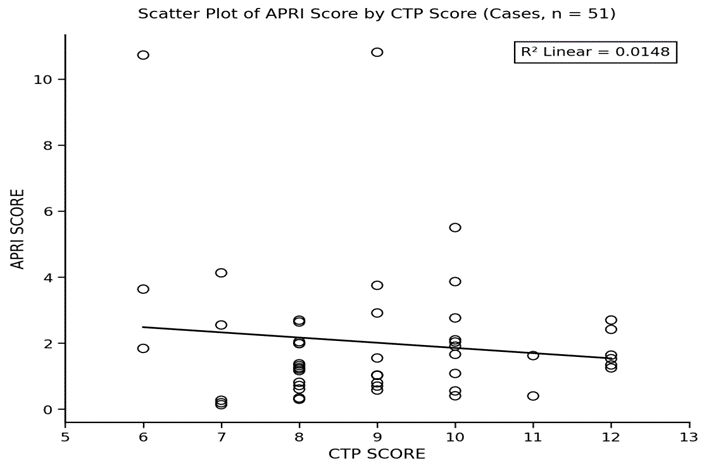
Figure 1. Scatter plot of APRI score by CTP score in cirrhotic cases (n = 51). R² Linear = 0.0148; Pearson r = −0.122 (95% CI −0.384 to 0.159); p = 0.395.
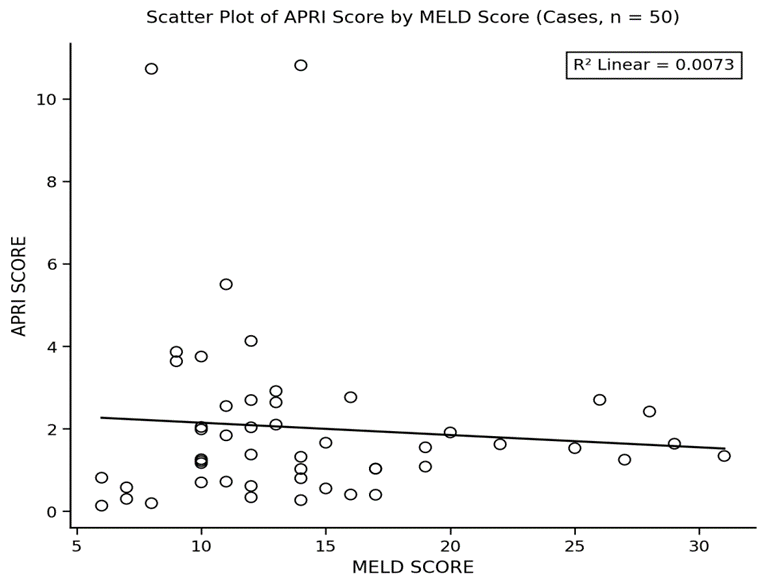
Figure 2. Scatter plot of APRI score by MELD score in cirrhotic cases (n = 50). R² Linear = 0.0074; Pearson r = −0.086 (95% CI −0.356 to 0.197); p = 0.554.
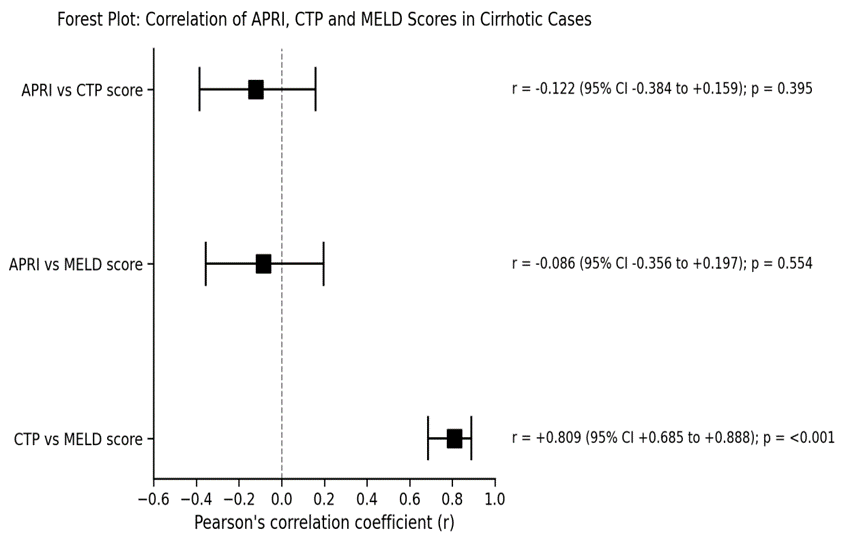
Figure 3. Forest plot of Pearson correlation coefficients with 95% confidence intervals for APRI–CTP, APRI–MELD and CTP–MELD pairs in cirrhotic cases. The vertical dashed line at r = 0 represents the null effect.
APRI distribution across CTP classes and MELD strata
Mean APRI did not increase progressively with worsening CTP class. The small Class A subgroup (n = 3) had higher mean APRI than Classes B and C, driven by patients with acute hepatocellular injury superimposed on early cirrhosis. A similar non-linear pattern was observed across MELD strata. Findings are presented in Table 4.
Table 4. Mean APRI score across CTP classes and MELD severity strata in cirrhotic cases.
|
Stratum |
n |
APRI (mean ± SD) |
Statistical test |
p-value |
|
CTP classes |
|
|
ANOVA F = 4.74 |
0.013 |
|
|
|
|
Kruskal–Wallis H = 5.66 |
0.059 |
|
Class A (5–6) |
3 |
5.40 ± 3.84 |
|
|
|
Class B (7–9) |
30 |
1.73 ± 1.97 |
|
|
|
Class C (10–15) |
18 |
1.93 ± 1.21 |
|
|
|
MELD strata |
|
|
Kruskal–Wallis H = 1.47 |
0.480 |
|
< 10 |
8 |
2.53 ± 3.41 |
|
|
|
10–19 |
34 |
1.95 ± 1.93 |
|
|
|
20–29 |
7 |
1.87 ± 0.48 |
|
|
|
≥ 30 |
1 |
1.34 |
|
|
Diagnostic performance of APRI
ROC curve analysis confirmed excellent discriminatory performance of APRI for distinguishing cirrhotic patients from healthy controls. The area under the ROC curve was 0.919 (95% CI 0.85 to 0.97). The diagnostic performance of APRI at multiple cut-off values is presented in Table 5, with the corresponding ROC curve shown in Figure 4. At the optimal cut-off identified by the Youden index (APRI = 0.553), the index provided sensitivity of 86.3%, specificity of 92.0%, positive predictive value of 91.7%, negative predictive value of 86.8%, and overall accuracy of 89.1%.
Table 5. ROC analysis — diagnostic performance of APRI score at multiple cut-off values for detection of liver cirrhosis (cases vs healthy controls; AUC = 0.919; 95% CI 0.85 to 0.97).
|
APRI cut-off |
Sensitivity (%) |
Specificity (%) |
PPV (%) |
NPV (%) |
Accuracy (%) |
Youden's J |
|
0.30 |
94.1 |
48.0 |
64.9 |
88.9 |
71.3 |
0.421 |
|
0.40 |
90.2 |
72.0 |
76.7 |
87.8 |
81.2 |
0.622 |
|
0.50 |
86.3 |
92.0 |
91.7 |
86.8 |
89.1 |
0.783 |
|
0.553 (optimal) |
86.3 |
92.0 |
91.7 |
86.8 |
89.1 |
0.783 |
|
0.75 |
76.5 |
98.0 |
97.5 |
80.3 |
87.1 |
0.745 |
|
1.00 |
72.5 |
100.0 |
100.0 |
78.1 |
86.1 |
0.725 |
|
1.50 |
51.0 |
100.0 |
100.0 |
66.7 |
75.2 |
0.510 |
|
2.00 |
33.3 |
100.0 |
100.0 |
59.5 |
66.3 |
0.333 |
PPV = positive predictive value; NPV = negative predictive value. Optimal cut-off identified by Youden's J index (highlighted row).
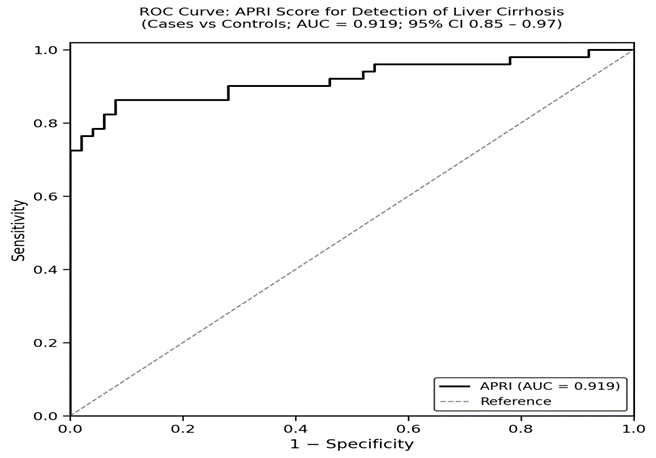
Figure 4. Receiver operating characteristic (ROC) curve showing the diagnostic performance of APRI score for detection of liver cirrhosis (cases vs healthy controls). AUC = 0.919 (95% CI 0.85 to 0.97). The reference diagonal corresponds to chance performance.
DISCUSSION:
The present cross-sectional study evaluated the relationship of APRI with two established prognostic scores — CTP and MELD — in 51 patients of liver cirrhosis at a tertiary centre in northern Karnataka, with comparison to 50 age- and sex-matched healthy controls. Our findings yielded two principal observations that warrant careful interpretation.
First, APRI was strikingly elevated in cirrhotic cases compared with healthy controls (2.02 ± 2.10 vs 0.33 ± 0.17; p < 0.0001) and demonstrated excellent diagnostic accuracy for distinguishing cirrhosis from health, with an area under the ROC curve of 0.919, sensitivity of 86.3%, and specificity of 92.0% at a cut-off of 0.553. This performance is consistent with — and indeed at the upper end of — the range reported in the original derivation cohort by Wai et al., which described an AUROC of 0.89 in chronic hepatitis C patients.8 The subsequent systematic review by Shaheen and Myers across 22 studies estimated a summary AUROC of 0.84 for APRI in detection of cirrhosis, while the larger meta-analysis by Lin and colleagues across 40 studies (n = 8,739) reported a summary AUROC of 0.83 with an APRI threshold of 1.0 yielding sensitivity of 76% and specificity of 72% for cirrhosis.9,10 Our slightly higher AUROC likely reflects the structural design of the study (cirrhotic patients with established disease versus completely healthy controls rather than patients across a fibrosis spectrum), which produces a wider biological separation and consequently better discrimination.
Second, and contrary to the prevailing assumption that APRI may serve as a proxy for severity, our analysis demonstrated weak and statistically non-significant correlation of APRI with both CTP (Pearson r = −0.122, p = 0.395) and MELD (Pearson r = −0.086, p = 0.554) within the cirrhotic group. The CTP–MELD correlation was, in contrast, strong and highly significant (r = 0.809, p < 0.001), confirming the internal consistency of the dataset and the methodological validity of the score computation. Several mechanistic explanations may account for the dissociation between APRI and the prognostic scores in established cirrhosis. APRI is principally a marker of ongoing hepatocellular injury (reflected by AST) and portal hypertension–related thrombocytopenia (reflected by platelet count). Once cirrhosis is fully established, AST levels often decline or fluctuate — a phenomenon described in advanced burnt-out cirrhosis — while CTP and MELD continue to rise as a function of failing synthetic capacity, accumulating bilirubin, and progressive renal involvement.13
These findings echo the heterogeneity in the published literature. Loaeza-del-Castillo and colleagues reported that APRI's performance was preserved across non-hepatitis-C aetiologies, but emphasised that its primary value was in fibrosis prediction rather than severity grading.11 Snyder et al. similarly noted that APRI's clinical advantage was its simplicity for ruling cirrhosis in or out at the bedside, rather than tracking severity once cirrhosis was diagnosed.12 On the prognostic side, the systematic review by Peng, Qi and Guo of 119 eligible studies (42 included in meta-analysis) comparing CTP and MELD showed that even between these two well-validated scores, performance differs substantially with clinical context, with MELD generally outperforming CTP in decompensated and transplant-candidate populations and CTP retaining value for compensated outpatient cirrhotics.15 Our data are consistent with that body of work in showing the strong CTP–MELD correlation (r = 0.809), and they add the observation that APRI, despite being mathematically simpler, occupies a different biological niche.
The aetiological backdrop of our cohort is relevant. Multi-centric Indian data from Mukherjee and colleagues confirmed that alcohol is the dominant aetiology of chronic liver disease in India (34.3%), with non-alcoholic fatty liver disease and viral hepatitis sharing the remainder.3 Alcohol-related cirrhosis is particularly prone to episodes of acute hepatocellular flare with disproportionate AST elevation (the classic AST:ALT ratio > 2 pattern), which would be expected to inflate APRI variably and disconnect it from underlying functional reserve. This mechanism likely underlies the weak APRI–CTP correlation observed in our cohort and contrasts with the cleaner correlation patterns reported in hepatitis C–dominant western series.
A further consideration is the natural-history framework articulated by D'Amico, Garcia-Tsao and Pagliaro across 118 studies of cirrhosis prognostication, which emphasised that risk in cirrhosis is determined predominantly by the presence and number of decompensating events (variceal bleed, ascites, encephalopathy, jaundice) rather than by any single static biomarker.14 In this conceptual scheme, CTP and MELD are weighted to reflect such events, whereas APRI is not — it remains a purely biochemical surrogate of fibrosis and platelet turnover. This theoretical distinction is reinforced by our data and suggests that APRI should be regarded as complementary to, rather than a substitute for, the established prognostic scores.
It is worth noting that the published literature is not unanimous. Some smaller series, particularly in hepatitis B–dominant cohorts, have reported moderate positive correlations between APRI and CTP/MELD scores (typically r ≈ 0.3 to 0.5). The variability across studies underscores that the APRI–severity relationship is sensitive to aetiological mix, sample size, and the spectrum of disease severity included. Our finding of essentially no within-cirrhotic correlation may therefore reflect both the predominantly alcohol-related aetiology and the relatively narrow severity range (the majority of patients were CTP Class B or C, with very few in Class A).
LIMITATIONS
This study has several limitations. First, the sample size of 51 cases is modest and limits statistical power, particularly for subgroup analyses such as the Class A stratum (n = 3) where mean APRI was unstable. Second, this was a single-centre study, limiting external generalisability. Third, longitudinal outcomes (mortality, decompensation events, need for transplantation) were not captured, so the prognostic value of APRI relative to CTP and MELD could not be directly tested. Fourth, transient elastography and liver biopsy — the reference standards for fibrosis — were not available, so fibrosis stage could not be confirmed independently of clinical-radiological criteria. Larger, multi-centre prospective studies with longitudinal follow-up are required to define the precise clinical role of APRI alongside established prognostic scores in Indian cirrhotic populations.
CONCLUSION:
The Aspartate Aminotransferase to Platelet Ratio Index (APRI) is a simple, inexpensive, and rapidly computable bedside index that demonstrated excellent diagnostic accuracy for the detection of liver cirrhosis in our cohort, with an area under the ROC curve of 0.919 and 86.3% sensitivity and 92.0% specificity at a cut-off of 0.553. However, within the cirrhotic patient group, APRI did not correlate significantly with either the Child–Turcotte–Pugh (CTP) or the Model for End-Stage Liver Disease (MELD) scores, indicating that APRI cannot reliably grade the severity of established cirrhosis. By contrast, CTP and MELD scores correlated strongly with each other (r = 0.809, p < 0.001), reaffirming their interchangeability for severity stratification in clinical practice. APRI is best positioned as a non-invasive screening tool for the presence of cirrhosis, particularly in primary-care and resource-limited settings where ultrasonography and elastography are not readily available, while CTP and MELD remain the preferred instruments for severity grading and prognostication. Larger multi-centre prospective studies with longitudinal mortality data are warranted to define the complementary role of APRI alongside the established prognostic scores.
REFERENCES:
1. GBD 2017 Cirrhosis Collaborators. The global, regional, and national burden of cirrhosis by cause in 195 countries and territories, 1990-2017: a systematic analysis for the Global Burden of Disease Study 2017. Lancet Gastroenterol Hepatol. 2020;5(3):245-66.
2. Asrani SK, Devarbhavi H, Eaton J, Kamath PS. Burden of liver diseases in the world. J Hepatol. 2019;70(1):151-71.
3. Mukherjee PS, Vishnubhatla S, Amarapurkar DN, Das K, Sood A, Chawla YK, et al. Etiology and mode of presentation of chronic liver diseases in India: a multi centric study. PLoS One. 2017;12(10):e0187033.
4. Pugh RN, Murray-Lyon IM, Dawson JL, Pietroni MC, Williams R. Transection of the oesophagus for bleeding oesophageal varices. Br J Surg. 1973;60(8):646-9.
5. Kamath PS, Wiesner RH, Malinchoc M, Kremers W, Therneau TM, Kosberg CL, et al. A model to predict survival in patients with end-stage liver disease. Hepatology. 2001;33(2):464-70.
6. Botta F, Giannini E, Romagnoli P, Fasoli A, Malfatti F, Chiarbonello B, et al. MELD scoring system is useful for predicting prognosis in patients with liver cirrhosis and is correlated with residual liver function: a European study. Gut. 2003;52(1):134-9.
7. Cholongitas E, Marelli L, Shusang V, Senzolo M, Rolles K, Patch D, et al. A systematic review of the performance of the model for end-stage liver disease (MELD) in the setting of liver transplantation. Liver Transpl. 2006;12(7):1049-61.
8. Wai CT, Greenson JK, Fontana RJ, Kalbfleisch JD, Marrero JA, Conjeevaram HS, et al. A simple noninvasive index can predict both significant fibrosis and cirrhosis in patients with chronic hepatitis C. Hepatology. 2003;38(2):518-26.
9. Shaheen AA, Myers RP. Diagnostic accuracy of the aspartate aminotransferase-to-platelet ratio index for the prediction of hepatitis C-related fibrosis: a systematic review. Hepatology. 2007;46(3):912-21.
10. Lin ZH, Xin YN, Dong QJ, Wang Q, Jiang XJ, Zhan SH, et al. Performance of the aspartate aminotransferase-to-platelet ratio index for the staging of hepatitis C-related fibrosis: an updated meta-analysis. Hepatology. 2011;53(3):726-36.
11. Loaeza-del-Castillo A, Paz-Pineda F, Oviedo-Cárdenas E, Sánchez-Ávila F, Vargas-Vorácková F. AST to platelet ratio index (APRI) for the noninvasive evaluation of liver fibrosis. Ann Hepatol. 2008;7(4):350-7.
12. Snyder N, Gajula L, Xiao SY, Grady J, Luxon B, Lau DT, et al. APRI: an easy and validated predictor of hepatic fibrosis in chronic hepatitis C. J Clin Gastroenterol. 2006;40(6):535-42.
13. Durand F, Valla D. Assessment of the prognosis of cirrhosis: Child-Pugh versus MELD. J Hepatol. 2005;42 Suppl(1):S100-7.
14. D'Amico G, Garcia-Tsao G, Pagliaro L. Natural history and prognostic indicators of survival in cirrhosis: a systematic review of 118 studies. J Hepatol. 2006;44(1):217-31.
15. Peng Y, Qi X, Guo X. Child-Pugh versus MELD score for the assessment of prognosis in liver cirrhosis: a systematic review and meta-analysis of observational studies. Medicine (Baltimore). 2016;95(8):e2877.