Role of Renal Doppler Ultrasonography in Type 2 Diabetes Mellitus: A Comparative Study with Nondiabetic Individuals
- Saurabh Atram , Professor, Department of Radiodiagnosis, MGMMC and MYH Indore (M.P)
- Alka Agrawal , Professor and Head of Department, Department of Radiodiagnosis, MGMMC and MYH Indore (M.P)
- Suraj Mathur , Assistant Professor, Department of Radiodiagnosis, MGMMC and MYH Indore (M.P)
- Shrikant Shukla , Junior Resident, Department of Radiodiagnosis, MGMMC and MYH Indore (M.P)
- Soham Roy Chowdhury , Junior Resident, Department of Radiodiagnosis, MGMMC and MYH Indore (M.P)
- Shankar , Junior Resident, Department of Radiodiagnosis, MGMMC and MYH Indore (M.P)
Article Information:
Abstract:
ound: Renal Doppler ultrasonography may provide useful information about intrarenal haemodynamic changes in type 2 diabetes mellitus (T2DM). This study compared renal morphology and resistive index (RI) between patients with T2DM and nondiabetic individuals and examined their relationship with renal function. Methods: This prospective cross-sectional comparative study included 100 adults with T2DM and 100 nondiabetic controls. Bilateral renal morphology and intrarenal RI were assessed using B-mode and Doppler ultrasonography. Clinical and biochemical parameters were recorded. Between-group comparisons and Pearson’s correlation analysis were performed, with p<0.05 considered statistically significant. Results: Patients with T2DM had higher serum creatinine and BUN and lower eGFR than controls (all p<0.001). Bilateral parenchymal thickness was significantly lower, while abnormal cortical echogenicity was present in 82% of patients with T2DM and none of the controls. Mean RI was significantly higher in the T2DM group (0.732 ± 0.115) than in controls (0.620 ± 0.054; p<0.001). RI ≥0.70 was observed in 54% of patients with T2DM and 9% of controls. RI correlated positively with HbA1c (r=0.779), diabetes duration (r=0.761), serum creatinine (r=0.705), and BUN (r=0.341), and inversely with eGFR (r=−0.669); all p<0.001. Conclusion: Intrarenal RI is increased in T2DM and is associated with glycaemic control, disease duration, renal dysfunction, and morphological renal changes. Renal Doppler may be a useful non-invasive adjunct for assessing diabetic kidney involvement.
Keywords:
Article :
INTRODUCTION:
Diabetes mellitus is a major global health problem. According to the IDF Diabetes Atlas 2025, approximately 589 million adults worldwide have diabetes, and this number may reach 853 million by 2050. India has nearly 89.8 million adults with diabetes, placing a substantial burden on healthcare services.1
Diabetic nephropathy is a serious microvascular complication of type 2 diabetes mellitus (T2DM) and a leading cause of end-stage renal disease. It develops in approximately 20–40% of patients with T2DM. Routine markers such as serum creatinine, estimated glomerular filtration rate (eGFR), and urinary albumin may remain normal during the early stages of renal damage. Renal biopsy is invasive, while conventional ultrasonography usually detects structural changes only after the disease has progressed.2,3
Renal Doppler ultrasonography is a non-invasive, radiation-free, and widely available method for assessing intrarenal blood flow. The resistive index (RI) reflects renal vascular resistance and may identify early haemodynamic changes before obvious biochemical or structural abnormalities appear.4 Previous studies have reported higher RI and pulsatility index values among diabetic patients than among nondiabetic individuals.5,6 Therefore, this study compared renal morphology and intrarenal RI between patients with T2DM and matched nondiabetic controls and examined their relationship with nephropathy stage, HbA1c, serum creatinine, eGFR, and diabetes duration.
MATERIALS AND METHODS:
This prospective cross-sectional comparative study was conducted in the Department of Radiodiagnosis, Mahatma Gandhi Memorial Medical College and M.Y. Hospital, Indore, over 12 months after approval from the Institutional Ethics Committee. Written informed consent was obtained from all participants.
The study included 200 adults recruited through consecutive purposive sampling: 100 patients with type 2 diabetes mellitus (T2DM) and 100 age- and sex-matched nondiabetic controls. Patients with T2DM were recruited from the Medicine outpatient and inpatient departments. Adults aged ≥18 years with an established diagnosis of T2DM were eligible as cases. Controls were individuals without diabetes who underwent renal ultrasonography during the study period. Participants with hypertension, congenital renal anomalies, obstructive uropathy, glomerular or tubulointerstitial renal disease unrelated to diabetes, relevant previous surgery, or unwillingness to participate were excluded.
Clinical information was recorded using a structured proforma, including age, sex, duration of diabetes, antidiabetic treatment, associated diabetic complications, and relevant personal and family history. Available biochemical findings, including HbA1c, serum creatinine, blood urea nitrogen, estimated glomerular filtration rate (eGFR), and urinary albumin-to-creatinine ratio, were documented.
Participants were instructed to fast for 4–6 hours before examination. Ultrasonography was performed using a 3.5–5-MHz curvilinear transducer. Initial scanning was undertaken in the supine position, followed by contralateral decubitus positioning when required. Both kidneys were examined in longitudinal and transverse planes. Renal length was measured three times, and the mean value was recorded. Parenchymal thickness, corticomedullary differentiation, and cortical echogenicity were also assessed. Cortical echogenicity was graded from 0 to III by comparison with the adjacent liver or spleen.
Colour Doppler was used to map the intrarenal vessels. Pulsed-wave Doppler waveforms were obtained from interlobar or arcuate arteries at the upper, middle, and lower poles of each kidney. The pulse repetition frequency was adjusted to avoid aliasing, and the insonation angle was maintained below 60°, preferably below 30°. Resistive index (RI) was calculated as: RI = (peak systolic velocity − end-diastolic velocity)/peak systolic velocity. Pulsatility index was also recorded. At least three measurements were obtained from each kidney, and the mean of six bilateral measurements was used for analysis. An RI of 0.50–0.70 was considered normal, whereas RI >0.70 was considered elevated. All examinations were performed by one trained observer between 9:00 AM and 1:00 PM (Figure 1).
Data were entered into Microsoft Excel and analysed using IBM SPSS Statistics for Windows, version 25.0 (IBM Corp., Armonk, NY, USA). Continuous variables were expressed as mean and standard deviation, while categorical variables were presented as frequencies and percentages. Continuous variables were compared between the T2DM and control groups using Welch’s independent-samples t-test. Categorical variables were compared using the chi-square test or Fisher’s exact test, as appropriate. Pearson’s correlation coefficient was used to assess the relationship of mean intrarenal resistive index with HbA1c, duration of diabetes, serum creatinine, eGFR, and BUN. All statistical tests were two-sided, and a p-value <0.05 was considered statistically significant.
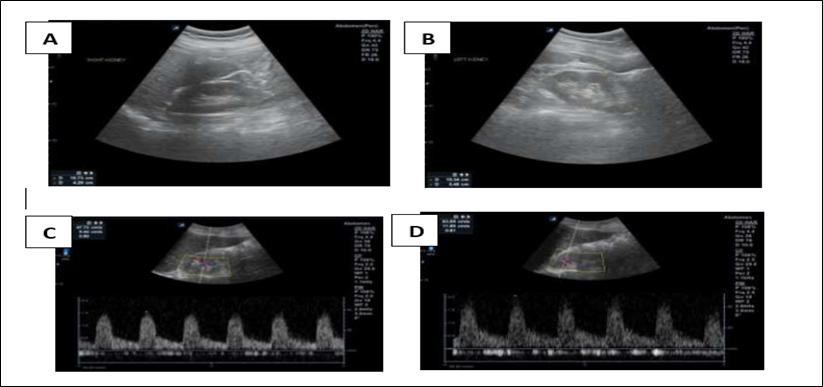
Figure 1. Renal ultrasonography and Doppler findings in a 56-year-old woman with a 9-year history of diabetes mellitus. (A) B-mode image of the right kidney measuring 8.6 × 3.7 cm. (B) B-mode image of the left kidney measuring 8.6 × 3.7 cm. (C) Colour Doppler imaging of the right renal segmental artery showing a resistive index (RI) of 0.80. (D) Colour Doppler imaging of the left renal segmental artery showing an RI of 0.81. The mean bilateral intrarenal RI was 0.805, exceeding the conventional upper threshold of 0.70.
RESULTS:
A total of 200 participants were evaluated, including 100 patients with T2DM and 100 nondiabetic controls. Patients with T2DM were slightly older than controls (54.53 ± 13.29 vs 49.71 ± 17.94 years; p=0.032). They had significantly higher HbA1c, BUN, and serum creatinine levels. Mean eGFR was substantially lower in the T2DM group than in controls (33.4 ± 22.8 vs 88.6 ± 14.2 mL/min/1.73 m²; p<0.001), indicating poorer renal function among diabetic participants (Table 1).
Right renal length did not differ significantly between the groups (p=0.195). However, left renal length was significantly lower in patients with T2DM (p<0.001). Bilateral parenchymal thickness was also significantly reduced in the T2DM group. Abnormal cortical echogenicity was observed in 82% of patients with T2DM but was absent among controls (p<0.001) (Table 2).
The overall mean intrarenal RI was significantly higher in patients with T2DM than in controls (0.732 ± 0.115 vs 0.620 ± 0.054; p<0.001). Similar differences were found for the right- and left-kidney RI values. An elevated RI of ≥0.70 was observed in 54% of patients with T2DM compared with only 9% of controls (p<0.001) (Table 3).
Among patients with T2DM, mean RI showed strong positive correlations with HbA1c (r=0.779), duration of diabetes (r=0.761), and serum creatinine (r=0.705). A strong inverse correlation was found between RI and eGFR (r=−0.669), while BUN showed a weaker positive correlation (r=0.341). All correlations were statistically significant (p<0.001) (Table 4).
Table 1. Demographic and biochemical characteristics of the study groups
|
Variable |
T2DM group (n=100) |
Control group (n=100) |
p-value |
|
Age (years) |
54.53 ± 13.29 |
49.71 ± 17.94 |
0.032 |
|
HbA1c (%) |
9.72 ± 1.42 |
5.40 ± 0.30 |
<0.001 |
|
BUN (mg/dL) |
58.4 ± 28.7 |
22.6 ± 6.8 |
<0.001 |
|
Serum creatinine (mg/dL) |
2.48 ± 1.61 |
0.89 ± 0.18 |
<0.001 |
|
eGFR (mL/min/1.73 m²) |
33.4 ± 22.8 |
88.6 ± 14.2 |
<0.001 |
|
Welch’s independent-samples t-test was used. p-value <0.05 statistically significant. |
|||
Table 2. Comparison of renal morphological parameters between the study groups
|
Parameter |
T2DM group (n=100) |
Control group (n=100) |
p-value |
|
Right renal length (mm) |
99.8 ± 9.5 |
101.4 ± 7.8 |
0.195 |
|
Left renal length (mm) |
95.5 ± 10.9 |
100.7 ± 9.0 |
<0.001 |
|
Right parenchymal thickness (mm) |
13.0 ± 3.0 |
18.9 ± 3.2 |
<0.001 |
|
Left parenchymal thickness (mm) |
12.4 ± 3.2 |
17.7 ± 3.4 |
<0.001 |
|
Abnormal cortical echogenicity, n (%) |
82 (82.0) |
0 (0.0) |
<0.001 |
|
Welch’s independent-samples t-test and Fisher’s exact test were used. p-value <0.05 statistically significant. |
|||
Table 3. Comparison of intrarenal Doppler resistive index between the study groups
|
Parameter |
T2DM group (n=100) |
Control group (n=100) |
p-value |
|
Mean RI |
0.732 ± 0.115 |
0.620 ± 0.054 |
<0.001 |
|
Right kidney RI |
0.731 ± 0.118 |
0.619 ± 0.054 |
<0.001 |
|
Left kidney RI |
0.729 ± 0.121 |
0.621 ± 0.056 |
<0.001 |
|
RI ≥0.70, n (%) |
54 (54.0) |
9 (9.0) |
<0.001 |
|
Welch’s independent-samples t-test and Fisher’s exact test were used. p-value <0.05 statistically significant. |
|||
Table 4. Correlation of mean resistive index with clinical and biochemical parameters in patients with T2DM
|
Parameter |
Pearson’s r |
p-value |
|
HbA1c |
0.779 |
<0.001 |
|
Duration of diabetes |
0.761 |
<0.001 |
|
Serum creatinine |
0.705 |
<0.001 |
|
eGFR |
−0.669 |
<0.001 |
|
BUN |
0.341 |
<0.001 |
|
Pearson’s correlation test was used. p-value <0.05 was statistically significant. |
||
DISCUSSION:
The present study assessed renal morphology and intrarenal resistive index (RI) in patients with type 2 diabetes mellitus (T2DM) and nondiabetic controls. Patients with T2DM were slightly older than controls, although sex distribution was similar. Since age can influence vascular resistance, the significant age difference between the groups should be considered while interpreting Raut et al. (2012) and Atalabi et al. (2015) also reported an increase in diabetic renal involvement with advancing age.7,8
Patients with T2DM had significantly higher HbA1c, BUN, and serum creatinine levels and lower eGFR than controls. Most patients had poor glycaemic control, with 72% having an HbA1c level ≥8%. These findings indicate that a considerable proportion of the diabetic group already had impaired renal function. Similar associations between poor glycaemic control, declining renal function, and diabetic nephropathy were reported by Farah et al. (2020), Sistani et al. (2019), and Al-Khalidi et al. (2022).9–11
Significant morphological changes were also observed. Left renal length and bilateral parenchymal thickness were lower in patients with T2DM, while abnormal cortical echogenicity was present in 82% of cases but absent in controls. These changes may reflect parenchymal fibrosis and progressive nephron loss. Mancini et al. (2013) described an initial increase in renal size during early diabetes, followed by renal shrinkage as nephropathy progresses.12 Soldo et al. (1997) similarly found that reduced parenchymal thickness was associated with worsening renal function.13 However, increased cortical echogenicity generally appears after structural damage has developed and may be less useful during early disease.
The principal finding was the significantly higher mean RI in patients with T2DM than in controls (0.732 ± 0.115 vs 0.620 ± 0.054; p<0.001). An RI ≥0.70 was recorded in 54% of cases compared with 9% of controls. Jafari et al. (2009) and Sawan Bhati et al. (2024) also reported increased RI among diabetic patients.14,15 This rise may result from arteriolar hyalinosis, vascular stiffness, and tubulointerstitial fibrosis. Right- and left-kidney RI values were similar, suggesting bilateral involvement.
RI showed strong positive correlations with HbA1c, diabetes duration, and serum creatinine. The strongest relationship was with HbA1c (r=0.779), supporting the association between prolonged poor glycaemic control and increased intrarenal vascular resistance described by Al-Khalidi et al. (2022) and Farah et al. (2020).9,11 RI also increased with diabetes duration (r=0.761), consistent with Nasir et al. (2020) and Raut et al. (2012).7,16 BUN showed a weaker correlation, possibly because it is affected by hydration, diet, and other nonrenal factors.
A strong inverse correlation was observed between RI and eGFR (r=−0.669), in agreement with Sistani et al. (2019) and Kilgour Venables et al. (2020). Overall, renal Doppler RI appears to provide useful information about renal haemodynamic changes in T2DM.5,10 Nevertheless, the cross-sectional design does not establish whether RI predicts future renal decline. Longitudinal studies adjusting for age and other vascular factors are needed before recommending RI as a routine early-screening test.
CONCLUSION:
This study demonstrated that patients with T2DM had significantly higher intrarenal RI and more frequent renal morphological abnormalities than nondiabetic controls. RI increased with poorer glycaemic control, longer diabetes duration, and higher serum creatinine, while decreasing eGFR showed an inverse association. These findings support renal Doppler ultrasonography as a useful, non-invasive adjunct for assessing diabetic kidney involvement and monitoring disease severity. However, longitudinal studies are required to determine its ability to predict renal decline and guide routine clinical screening strategies.
REFERENCES:
1. Duncan BB, Magliano DJ, Boyko EJ. IDF Diabetes Atlas 11th edition 2025: global prevalence and projections for 2050. Nephrol Dial Transplant. 2026;41(1):7-9.
2. Hauwanga WN, Abdalhamed TY, Ezike LA, Chukwulebe IS, Oo AK, Wilfred A, et al. The pathophysiology and vascular complications of diabetes in chronic kidney disease: a comprehensive review. Cureus. 2024;16(12):e76498.
3. Thipsawat S. Early detection of diabetic nephropathy in patient with type 2 diabetes mellitus: A review of the literature. Diab Vasc Dis Res. 2021;18(6):14791641211058856.
4. Geraci G, Ferrara P, La Via L, et al. Renal Resistive Index from Renal Hemodynamics to Cardiovascular Risk: Diagnostic, Prognostic, and Therapeutic Implications. Diseases. 2025;13(6):178.
5. Kilgour Venables H, Sherwood B, Rupert O. Doppler ultrasonography for early detection of diabetic kidney disease: a systematic review and meta-analysis. Ultrasound Med Biol. 2022;48(7):1234–45.
6. Yousief E, Ibrahim HM. Beyond glycemia: renal resistive index provides robust discrimination and incremental clinical utility for proteinuria in type 2 diabetes. Egypt J Intern Med. 2026;38:1-7.
7. Raut TP, Kulkarni P, Shankar K. Intrarenal resistive index and clinical correlates in diabetic nephropathy — a multivariate analysis. J Assoc Physicians India. 2019;67(5):44–8.
8. Atalabi OM, Adetiloye VA, Faponle AF. Intrarenal Doppler sonography in Type 2 diabetes mellitus: comparison with non-diabetic controls. West Afr J Radiol. 2007;14(1):1–7.
9. Farah MMS, Mousa NH, Hamed DH. Correlation of intrarenal Doppler parameters with biochemical markers of renal function in Type 2 diabetes mellitus. Egypt J Radiol Nucl Med. 2020;51:129.
10. Sistani SS, Fatehi F, Fatehi M, Ghasemi-Rad M. Intrarenal resistive index in diabetic nephropathy: a cross-sectional study. J Renal Inj Prev. 2019;8(2):87–91.
11. Al-Khalidi MH, Jabbar RA, Kadhim IJ. Renal ultrasonographic changes in Type 2 diabetic patients. Iraqi J Med Sci. 2022;20(1):48–56.
12. Mancini M, Masulli M, Liuzzi R, Mainenti PP, Ragucci M, Maurea S, et al. Renal duplex sonographic evaluation of Type 2 diabetic patients. J Ultrasound Med. 2013;32(6):1033–40.
13. Soldo D, Brkljačić B, Škegro M, Čikeš I, Galešić K, Čikeš N. Duplex Doppler ultrasound evaluation of the kidney in patients with asymptomatic diabetic nephropathy. Nephrol Dial Transplant. 1997;12(Suppl 2):S108–12.
14. Jafari B, Mehrabi Bahar M, Rahimi-Rad MH. Intrarenal Doppler velocimetry in diabetic nephropathy. Pak J Med Sci. 2009;25(3):405–8.
15. Bhati S, Patel N, Gupta R. Evaluation of renal vascular resistance using Doppler ultrasonography in diabetic and non-diabetic patients: a comparative observational study. J Radiol Med Imaging. 2024;6(1):1–8.
16. Nasir M, Mehmood A, Zafar A. Role of Doppler ultrasound in assessment of early diabetic nephropathy. Pak J Med Health Sci. 2020;14(3):1024–7.