Clinical And Hematological Profile Of Anaemia In Tertiary Care Centre- Iron Deficiency Vs Megaloblastic Anemia.
- Amit Kumar Singh , Assistant Professor, Department of Pediatrics Government Medical College Satna Madhya Pradesh.
- Prabhat Singh Baghel , Associate Professor, Department of Pediatrics Government Medical College Satna Madhya Pradesh
- Tankeshwar Prasad Patel , Assistant Professor, Department of Pediatrics Government Medical College Satna Madhya Pradesh.
- Surendra Kumar Tripathi , Senior Resident, Department of Pediatrics Government Medical College Satna Madhya Pradesh.
Article Information:
Abstract:
Background: Anaemia is a major public health problem among children, particularly in developing countries, and is associated with adverse effects on physical growth and neurodevelopment. Nutritional anaemias, mainly iron deficiency anaemia and megaloblastic anaemia due to vitamin B12 or folate deficiency, comprise a big proportion of paediatric cases. Although these conditions share some common clinical features, they differ significantly in their haematological and biochemical profiles, making accurate diagnosis crucial for their appropriate management. Aims/Objectives: To evaluate the clinical and haematological profile of anaemic children and to compare iron deficiency anaemia and megaloblastic anaemia across demographic, haematological, and biochemical parameters. Methodology: This observational cross-sectional study was conducted over six months in the Department of Paediatrics at a tertiary care hospital of Satna District in Madhya Pradesh. Total 300 children aged 6 months to 14 years with clinically suspected or laboratory-confirmed anaemia were enrolled. Clinical findings, peripheral smear patterns, and relevant haematological and biochemical parameters were recorded using a predesigned proforma. Data were analysed using SPSS version 25. Chi-square test and Mann–Whitney U test were applied as appropriate, with p <0.05 considered statistically significant. Conclusions: Most common type of nutritional anaemia was Iron Deficiency Anaemia, followed by megaloblastic anaemia. Significant differences were observed between iron deficiency and megaloblastic anaemia with respect to mean corpuscular volume, serum ferritin, serum iron, vitamin B12, and folate levels. Demographic factors showed no significant association with the type of anaemia. Complete haematological and biochemical workup is needed for accurate differentiation of nutritional anaemias, to allow targeted treatment and to prevent long-term complications.
Keywords:
Article :
INTRODUCTION:
Anaemia is a condition in which the number of red blood cells or the haemoglobin concentration is lower than normal.1 Anaemia is defined as a haemoglobin concentration below a specified cut-off point; that cut-off point depends on the age, gender, physiological status and altitude at which the population being assessed . WHO defines anaemia in children aged under 5 years as haemoglobin concentration <10.5 g/L at sea level.1 Haemoglobin is needed to carry oxygen and if you have too few or abnormal red blood cells, or not enough haemoglobin, there will be a decreased capacity of the blood to carry oxygen to the body’s tissues. 2 This results in symptoms such as fatigue, weakness, dizziness and shortness of breath. Anaemia is a serious global public health problem that particularly affects young children, WHO estimates that 40% of children 6–59 months of age, worldwide are anaemic. 3
The negative consequences of anaemia is on the cognitive and physical development resulting in neuro-development delay We are observing that similarly many cases of nutritional anaemia (especially iron deficiency and megaloblastic anaemia are admitting at our hospital and we want to study about their clinico-hematological profile so that it helps in early diagnosis ,management and prevention of disease.
Rationale of the study: Anaemia is one of the most common hematological disorders encountered in clinical practice and remains a significant public health problem, particularly in developing countries. 4 Iron deficiency anaemia is the leading cause of anaemia worldwide, while megaloblastic anaemia due to vitamin B12 or folate deficiency represents another important and frequently encountered etiology. 5 Although both conditions present with similar symptoms of anaemia, they differ markedly in their pathophysiology, hematological parameters, and clinical manifestations.6 Accurate differentiation between iron deficiency anaemia and megaloblastic anaemia is essential, as inappropriate diagnosis may lead to ineffective treatment and preventable complications, including neurological sequelae in megaloblastic anaemia. 7 Hence a comparative evaluation of the clinical and hematological profiles of iron deficiency anaemia and megaloblastic anaemia in a tertiary care setting is warranted.
Objectives:
1. To study the clinical and hematological profile of anemic patients.
2. To study about the sign and symptom of anemic patients
3. To study the hematological profile of anemic patients
4. To compare between iron deficiency vs megaloblastic anemia in different parameters.
MATERIALS AND METHODS:
Study Design: This was an observational cross sectional study.
Study Setting: The study was conducted in the Department of Paediatrics, Government Medical College and District Hospital, Satna, Madhya Pradesh.
Study Duration: The study was carried out over a period of six months.
Study Population: The study population included children aged 6 months to 14 years attending the Paediatrics Department of Government Medical College, Satna, who were clinically suspected or laboratory confirmed to have anaemia.
Sample Size: A total of 300 paediatric patients fulfilling the eligibility criteria were included in the study.
Sample Size Calculation
The sample size was calculated using the formula for estimation of a proportion in cross-sectional studies:
n=(Z^2×p×q)/d^2
Where:
n = required sample size
Z = standard normal deviate at 95% confidence level (1.96)
p = expected prevalence of anaemia among children
q = 1 − p
d = absolute precision (margin of error)
According to national estimates, the prevalence of anaemia among children in India is approximately 67.1% as reported in NFHS-5.
Therefore:
• p = 0.671
• q = 1 − 0.671 = 0.329
• Z = 1.96
• d = 0.05
Substituting in the formula:
n=(〖1.96〗^2×0.671×0.329)/〖0.05〗^2 =338.8
The minimum calculated sample size was approximately 339 participants.
However, due to the limited study duration and availability of eligible participants during the study period, a total of 300 children fulfilling the inclusion criteria were enrolled and analysed.
Inclusion Criteria:
· Children aged 6 months to 14 years
· Children with clinical features suggestive of anaemia
· Children diagnosed with anaemia based on WHO criteria, either clinically or by laboratory investigations
Exclusion Criteria:
· Children with hemolytic anaemia
· Children with anaemia due to causes other than nutritional anaemia, such as congenital or chronic disease related anaemia
Ethical Considerations: The study was conducted after obtaining approval from the Institutional Ethics Committee. Written informed consent was obtained from the parents or legal guardians of all enrolled children prior to inclusion in the study.
Data Collection Procedure: All eligible children attending the Paediatric Department during the study period were screened for anaemia based on clinical signs and symptoms as per WHO criteria. Children fulfilling the inclusion criteria underwent relevant laboratory investigations for confirmation of anaemia.
A pre designed proforma was used to record demographic details, clinical signs and symptoms, and laboratory findings of each participant.
Data Recording and Management: All collected data were entered into a Microsoft Excel spreadsheet. Socio-demographic data, laboratory parameters, and their correlations were systematically recorded and organized for further analysis.
Data analysis: The data was entered into a Microsoft Excel spreadsheet and analysed using the statistical software SPSS version 25. Presentation of data was done in terms of frequency and percentages. To test associations between group type and categorical variables, Chi-square test was applied whereas Mann Whitney-U Test was applied on continuous data to compare the distributions of two groups. A P-value of 0.05 was considered to be statistically significant.
RESULTS:
Table 1: Baseline Socio-Demographic Characteristics of Study Participants
|
Variable |
Category |
Frequency (n) |
Percentage (%) |
|
Age group (years) |
< 5 |
107 |
35.7 |
|
5–9 |
96 |
32.0 |
|
|
10–14 |
97 |
32.3 |
|
|
Sex |
Male |
149 |
49.7 |
|
Female |
151 |
50.3 |
|
|
Residence |
Rural |
187 |
62.3 |
|
Urban |
113 |
37.7 |
|
|
Socio‑economic status |
Class I |
51 |
17.0 |
|
Class II |
83 |
27.7 |
|
|
Class III |
81 |
27.0 |
|
|
Class IV |
48 |
16.0 |
|
|
Class V |
37 |
12.3 |
|
|
Total |
300 |
100 |
|
Table 1 shows the socio-demographic profile of the 300 study participants. The study population was almost equally distributed across the three age groups, with a slight predominance of children below five years of age. There was near equal representation of male and female participants. A majority of the children belonged to rural areas. Most participants were from middle and lower socioeconomic classes, with fewer children from the highest and lowest socioeconomic strata.
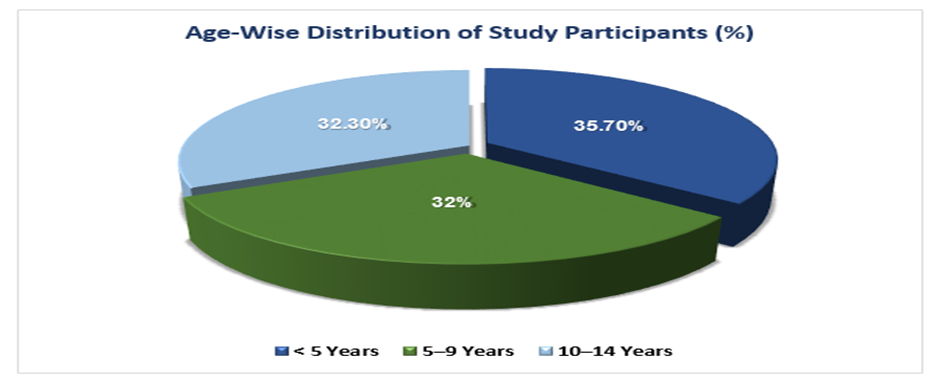
Figure 1: Age-Wise Distribution of Study Participants.
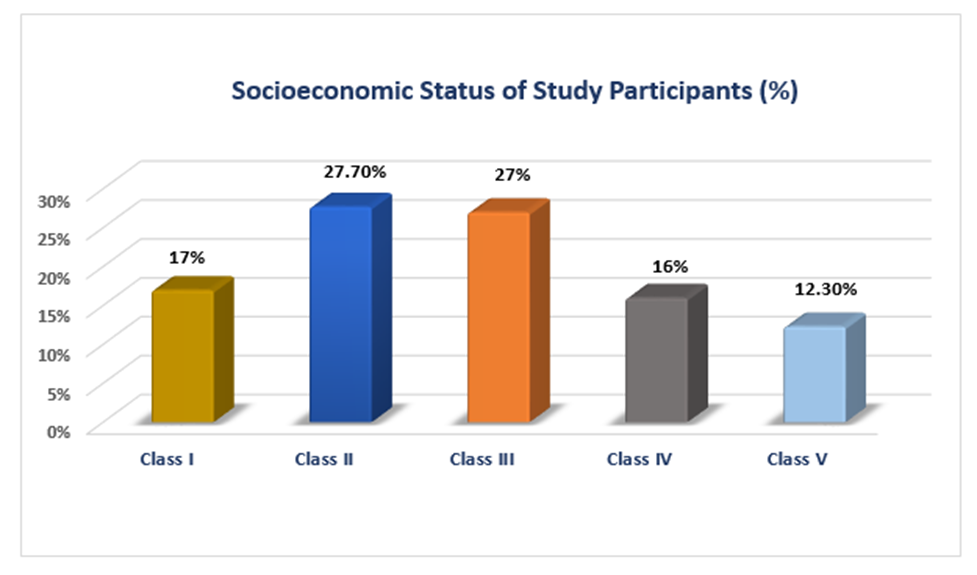
Figure 2: Socioeconomic Status of Study Participants (Modified BG Prasad Scale 2025)
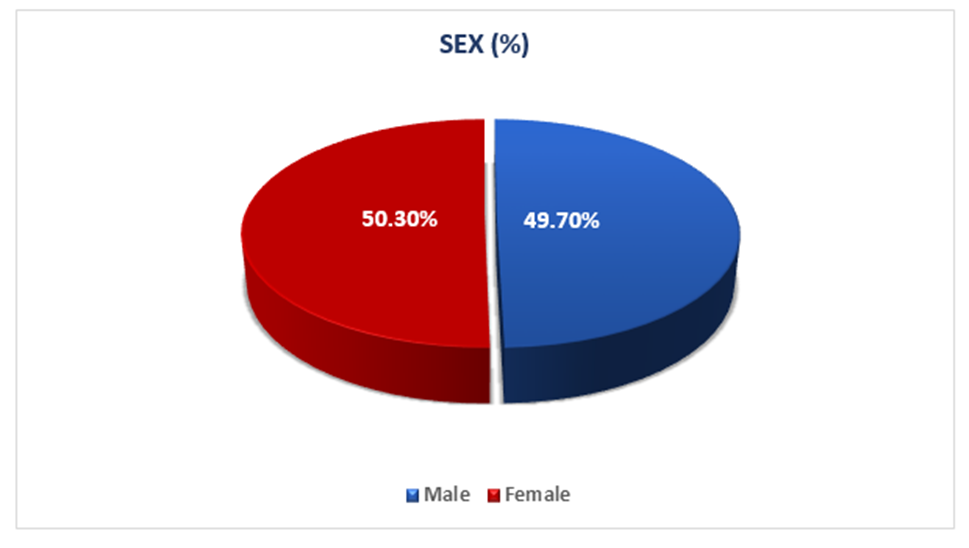
Figure 3: Sex-Wise Distribution of Study Participants
Table 3. Distribution of peripheral smear (PS) findings among study participants (N = 300)
|
Peripheral smear finding |
Frequency (n) |
Percentage (%) |
|
Microcytic hypochromic |
158 |
52.7 |
|
Macrocytic |
88 |
29.3 |
|
Dimorphic |
54 |
18 |
|
Total |
300 |
100.0 |
Table 3 shows the distribution of peripheral smear findings among the study participants. microcytic hypochromic anaemia was the most common pattern observed, followed by macrocytic and dimorphic blood pictures constituted a smaller proportion of cases, reflecting the presence of megaloblastic and mixed nutritional anaemias.
Table 4. Distribution of diagnostic categories among study participants (N = 300)
|
Diagnosis |
Frequency (n) |
Percentage (%) |
|
B12 deficiency |
67 |
22.4 |
|
Folate deficiency |
21 |
7 |
|
Iron deficiency anaemia (IDA) |
158 |
52.6 |
|
Mixed |
54 |
18 |
|
Total |
300 |
100.0 |
Table 4 presents the diagnostic categorization of anaemia based on laboratory evaluation. Iron deficiency anaemia was the most frequently diagnosed nutritional anaemia, followed by vitamin B12 deficiency. A smaller proportion of children had folate deficiency or mixed nutritional anaemia, while nearly half of the participants had normal haematological parameters.
Table 5. Distribution Of Anaemia According To Socio-Demographic Variables Among Study Participants
|
Category |
B12 Deficiency |
Folate Deficiency |
IDA |
Mixed |
Total |
|
Age Group |
n (%) |
n (%) |
n (%) |
n (%) |
n |
|
<5 Years |
19 (17.7) |
11 (10.2) |
65 (60.7) |
12 (11.2) |
107 |
|
5–9 Years |
20 (20.8) |
5 (5.20) |
57 (59.30 |
14 (14.5) |
96 |
|
10–14 Years |
18 (18.5) |
9 (9.2) |
46 (47.4) |
24 (24.7) |
97 |
|
Sex |
|
||||
|
Female |
31 (20.5) |
8 (5.2) |
86 (56.9) |
26 (17.3) |
151 |
|
Male |
29 (19.5) |
10 (6.7) |
91 (61.0) |
19 (12.8) |
149 |
|
Residence |
|
||||
|
Rural |
44 (23.5) |
17 (9.0) |
97(51.9) |
29 (15.5) |
187 |
|
Urban |
23 (20.3) |
5 (4.4) |
66 (58.4) |
19 (16.8) |
113 |
|
Socio‑Economic Status |
|
||||
|
Class I |
12 (23.5) |
0 (0.0) |
29 (56.8) |
10 (19.6) |
51 |
|
Class II |
19 (22.8) |
9 (10.8) |
41 (49.3) |
14 (16.8) |
83 |
|
Class III |
21 (25.9) |
8 (9.8) |
40 (49.3) |
12 (14.9) |
81 |
|
Class IV |
8 (16.7) |
2 (4.1) |
29 (60.4) |
9 (18.7) |
48 |
|
Class V |
7 (18.9) |
3 (8.1) |
19 (51.3) |
8 (21.6) |
37 |
|
Total |
67 (22.3) |
22 (7.3) |
158(52.7) |
53 (17.7) |
300 |
Table 5 shows the distribution of different types of anaemia across age groups, sex, residence, and socioeconomic status. Iron deficiency anaemia predominated across all demographic categories. Vitamin B12 deficiency and mixed anaemia were seen across all age groups and socioeconomic classes, with a relatively higher burden in rural children and those belonging to lower socioeconomic groups.
Table 6. Comparison of haematological and biochemical parameters between Iron Deficiency and Megaloblastic anaemia
[Values are presented as Median (25th–75th percentile)]
|
Parameter |
Iron Deficiency Anaemia |
Megaloblastic Anaemia |
p-value# |
|
Haemoglobin (g/dL) |
8.00 (7.00–9.00) |
8.50 (7.00–9.00) |
0.089 |
|
MCV (fL) |
68.50 (64.25–71.00) |
108.00 (104.00–115.50) |
< 0.001* |
|
Vitamin B12 (pg/mL) |
375.50 (300.50–433.25) |
125.00 (105.00–187.00) |
< 0.001* |
|
Ferritin (ng/mL) |
8.00 (7.00–10.00) |
57.00 (41.75–72.25) |
< 0.001* |
|
Serum Iron (µg/dL) |
28.00 (18.25–35.00) |
94.50 (77.00–105.00) |
< 0.001* |
|
Folic acid (ng/mL) |
8.00 (6.00–9.75) |
7.00 (4.50–9.00) |
0.033* |
#Mann-Whitney U Test.
*Statistically significant
Table 6 compares the haematological and biochemical parameters between children with iron deficiency anaemia and megaloblastic anaemia. Statistically significant differences were observed in mean corpuscular volume, serum ferritin, serum iron, vitamin B12, and folic acid levels. Haemoglobin levels did not differ significantly between the two groups, highlighting the importance of biochemical evaluation for accurate differentiation.
Table 7. Association of demographic variables with type of anaemia (n = 130)
|
Category |
Iron Deficiency n (%) |
Megaloblastic n (%) |
Total (n) |
χ² |
P-value |
|
Age Group |
|
||||
|
< 5 Years |
33 (67.3) |
16 (32.7) |
49 |
0.780 |
0.677 |
|
5–9 Years |
28 (66.7) |
14 (33.3) |
42 |
||
|
10–14 Years |
23 (59.0) |
16 (41.0) |
39 |
||
|
Sex |
|
||||
|
Female |
42 (62.7) |
25 (37.3) |
67 |
0.225 |
0.635 |
|
Male |
42 (66.7) |
21 (33.3) |
63 |
||
|
Residence |
|
||||
|
Rural |
53 (60.9) |
34 (39.1) |
87 |
1.571 |
0.210 |
|
Urban |
31 (72.1) |
12 (27.9) |
43 |
||
|
Socioeconomic Status |
|
||||
|
Class I |
14 (70.0) |
6 (30.0) |
20 |
1.344 |
0.854 |
|
Class II |
20 (58.8) |
14 (41.2) |
34 |
||
|
Class III |
23 (62.2) |
14 (37.8) |
37 |
||
|
Class IV |
13 (72.2) |
5 (27.8) |
18 |
||
|
Class V |
14 (66.7) |
7 (33.3) |
21 |
||
|
Total |
84 (64.6) |
46 (35.4) |
130 |
|
|
Table 7 shows the association between demographic variables and the type of nutritional anaemia. No statistically significant association was found between age, sex, residence, or socioeconomic status and the type of anaemia, indicating a relatively uniform distribution of iron deficiency and megaloblastic anaemia across demographic subgroups.
DISCUSSION:
This hospital-based cross-sectional study assessed the clinico-haematological profile of anaemia among children aged 6 months to 14 years attending a tertiary care centre. Iron deficiency anaemia (IDA) was the most frequent nutritional anaemia, followed by megaloblastic anaemia related to vitamin B12 and/or folate deficiency. Peripheral smear examination showed a predominance of microcytic hypochromic morphology , represented the most common abnormal pattern. Macrocytic and dimorphic blood pictures were less frequent but indicated the presence of megaloblastic and mixed nutritional deficiencies.
Haemoglobin values showed considerable overlap between iron deficiency and megaloblastic anaemia. In contrast, red cell indices and biochemical parameters demonstrated clear differences. Mean corpuscular volume, serum ferritin, serum iron, vitamin B12, and folic acid levels were useful in differentiating these conditions. Demographic characteristics such as age, sex, residence, and socioeconomic status were not significantly associated with the type of nutritional anaemia, indicating that both iron deficiency and megaloblastic anaemia occur across demographic groups in hospital settings.
The findings are consistent with national and global evidence on childhood anaemia. The World Health Organization recommends age-specific haemoglobin thresholds for defining anaemia and emphasizes standardized diagnostic criteria to allow comparison across studies⁸. In India, the Indian Academy of Pediatrics guideline recognizes anaemia as a major public health concern. National surveys report high prevalence among children, with NFHS-5 documenting anaemia in 67.1% of under-five children and CNNS 2016–18 indicating that a large proportion is attributable to nutritional deficiencies⁹.
Population-level data from the Comprehensive National Nutrition Survey support these observations. Yadav et al.¹⁰ reported anaemia in 40.5% of children aged 12–59 months and demonstrated that many affected children had micronutrient deficiencies including iron, vitamin B12, and folate. These findings reinforce the importance of evaluating nutritional causes of anaemia in paediatric populations.
The predominance of iron deficiency anaemia observed in the present study is comparable with findings from other hospital-based studies in India. Choudhary et al.¹¹ reported iron deficiency as the leading cause of paediatric anaemia in a tertiary care centre in central India, while megaloblastic anaemia accounted for a smaller but clinically significant proportion. Similar patterns have been described in several hospital cohorts across the country.
Morphological patterns on peripheral smear differ across studies depending on study population and disease severity. Studies focusing on hospitalized children with severe anaemia have reported a higher proportion of microcytic and dimorphic patterns, reflecting a greater burden of iron deficiency and mixed deficiencies¹². In the present study, children across a broader clinical spectrum were included, which may explain the relatively higher proportion of normocytic patterns.
Population surveys have demonstrated that factors such as younger age, maternal education, and socioeconomic determinants influence anaemia prevalence in the community¹³. In contrast, the present analysis comparing IDA and megaloblastic anaemia did not demonstrate significant demographic differences. This difference likely reflects variation in study design. Community surveys evaluate risk of anaemia in the population, whereas hospital-based studies assess the distribution of anaemia subtypes among children who already present for clinical care.
These findings have implications for paediatric practice. Haemoglobin estimation alone does not allow differentiation between iron deficiency and megaloblastic anaemia because haemoglobin levels may overlap. Red cell indices, particularly mean corpuscular volume, together with biochemical investigations are necessary for accurate classification. Early recognition of megaloblastic anaemia is important because vitamin B12 deficiency may lead to neurological complications if treatment is delayed. The presence of dimorphic anaemia also indicates that combined micronutrient deficiencies should be considered and empirical single-nutrient therapy should be avoided without evaluation. The Indian Academy of Pediatrics guideline recommends a structured diagnostic approach and targeted supplementation for nutritional anaemias, which is supported by these findings⁹.
This study has certain limitations. Being hospital based, the findings may not represent the community because symptomatic children are more likely to be referred to tertiary centres. The cross-sectional design limits assessment of causal relationships. Dietary intake, anthropometric status, parasitic infections, and inflammatory markers were not evaluated, which could have provided additional information on underlying risk factors.
Further research should include community-based and longitudinal studies to better estimate the burden and progression of nutritional anaemia in children. Incorporation of dietary assessment, maternal nutritional status, infection burden, and inflammatory markers may help clarify contributing pathways. Studies examining outcomes of targeted versus combined micronutrient supplementation, particularly in children with dimorphic anaemia, would also inform clinical management and preventive strategies.
CONCLUSION:
This study evaluated the clinico-haematological profile of anaemia among children aged 6 months to 14 years attending a tertiary care centre. The findings indicate that nutritional causes constitute a major proportion of anaemia in this population. Iron deficiency anaemia emerged as the most common nutritional anaemia, followed by megaloblastic anaemia related to vitamin B12 and folate deficiency. Peripheral smear examination demonstrated varied morphological patterns, while microcytic hypochromic morphology representing the most common abnormal finding.
Haemoglobin levels showed considerable overlap between iron deficiency anaemia and megaloblastic anaemia. In contrast, red cell indices and biochemical parameters such as mean corpuscular volume, serum ferritin, serum iron, vitamin B12, and folic acid levels showed clear differences between the two conditions. These findings highlight the importance of detailed haematological evaluation rather than reliance on haemoglobin estimation alone for etiological classification of anaemia.
The study also observed that iron deficiency anaemia and megaloblastic anaemia were distributed across different age groups, sexes, residential areas, and socioeconomic categories, with no statistically significant demographic associations. This suggests that nutritional anaemias affect children across demographic strata in tertiary care settings.
Overall, the results emphasize that comprehensive laboratory evaluation, including peripheral smear examination, red cell indices, and relevant biochemical investigations, is essential for accurate diagnosis of paediatric anaemia. Early identification of the underlying nutritional deficiency can facilitate appropriate treatment and help prevent complications associated with delayed or inappropriate therapy. Strengthening early diagnostic approaches and improving nutritional interventions remain important steps in addressing the burden of childhood anaemia.
REFERENCES:
1. World Health Organization. Guideline on Haemoglobin Cutoffs to Define Anaemia in Individuals and Populations , World Health Organization; 2024. Accessed on June 11, 2024. [1]Available from https://iris.who.int/bitstream/handle/10665/376196/9789240088542-eng.pdf?sequence=1
2. Who guided definition Anaemia https://www.who.int/health-topics/anaemia#tab=tab_1
3. WHO. Haemoglobin concentrations for the diagnosis of anaemia and assessment of severity. Vitamin and Mineral Nutrition Information System. WHO/NMH/NHD/MNM/11.1. Geneva: World Health Organization; 2011 (http://www.who.int/vmnis/indicators/haemoglobin.pdf)
4. World Health Organization. Anaemia in women and children. Geneva: World Health Organization; 2025. Available from: https://www.who.int/data/gho/data/themes/topics/anaemia_in_women_and_children
5. Short MW, Domagalski JE. Iron deficiency anemia: evaluation and management. American Family Physician. 2013;87(2):98–104.
6. MSD Manual Professional Edition. Megaloblastic macrocytic anemias. Updated 2025. Available from: https://www.msdmanuals.com/professional/hematology-and-oncology/anemias-caused-by-deficient-erythropoiesis/megaloblastic-macrocytic-anemias
7. Longo DL, Fauci AS, Kasper DL, et al., editors. Harrison’s Principles of Internal Medicine. 22nd ed. New York: McGraw‑Hill; 2025. Chapters on Iron deficiency anaemia and Megaloblastic anaemia.
8. World Health Organization. Guideline on haemoglobin cutoffs to define anaemia in individuals and populations. 2024. https://www.who.int/publications/i/item/9789240088542
9. Chandra J, Dewan P, Kumar P, et al. Diagnosis, Treatment and Prevention of Nutritional Anemia in Children: IAP Joint Committee Recommendations. Indian Pediatrics. 2022. https://pubmed.ncbi.nlm.nih.gov/36263494/
10. Yadav K, Ramaswamy G, Puri S, et al. Prevalence and determinants of anemia due to micronutrient deficiencies among children in India (CNNS 2016–18). PLOS Global Public Health. 2024. https://pubmed.ncbi.nlm.nih.gov/38236794/
11. Choudhary P, Kumar S, Ambhore J. Clinical and hematological profile of anemia in children at a tertiary care hospital in central India. Int J Contemp Pediatr. 2021. https://www.ijpediatrics.com/index.php/ijcp/article/view/4537
12. Muliya HJ, Shah MV, Jeeyani HN, et al. Study of severe anemia in hospitalized children in Ahmedabad, India. Int J Contemp Pediatr. 2023. https://www.ijpediatrics.com/index.php/ijcp/article/view/5280
13. Preethi V, Hemalatha V, Arlappa N, et al. Trends and predictors of moderate and severe anaemia among children in India: NFHS analysis. BMC Public Health. 2024 https://pmc.ncbi.nlm.nih.gov/articles/PMC11476725/.