Role of B-Mode Ultrasonographic Evaluation of Carotid Intima-Media Thickness [CIMT] and Its Association with Body Mass Index[BMI] in Healthy Adults.
- Jiten Modi , Third year post graduate student, Department of Radio Diagnosis, Narendra Modi Medical College & L.G. General Hospital, Maninagar, Ahmedabad, Gujarat, India
- Kavita U. Vaishnav , Associate Professor, Department of Radio Diagnosis, Narendra Modi Medical College & L.G. General Hospital, Maninagar, Ahmedabad, Gujarat, India
- Kakshil Patel , 3rd Year postgraduate student, Department of Radio Diagnosis, Narendra Modi Medical College & L.G. General Hospital, Maninagar, Ahmedabad, Gujarat, India
- Hardi patel , 3rd Year postgraduate student, Department of Radio Diagnosis, Narendra Modi Medical College & L.G. General Hospital, Maninagar, Ahmedabad, Gujarat, India
- Bhavya Patel , 2nd Year postgraduate student, Department of Radio Diagnosis, Narendra Modi Medical College & L.G. General Hospital, Maninagar, Ahmedabad, Gujarat, India
- [Maj.] Deepak K. Rajput , Professor and Head of Department, Department of Radio Diagnosis, Narendra Modi Medical College & L.G. General Hospital, Maninagar, Ahmedabad, Gujarat, India.
Article Information:
Abstract:
Background: An indicator of subclinical atherosclerosis that forecasts future cardiovascular events is carotid intima-media thickness [CIMT], which is measured using ultrasonography [1,2]. A higher body mass index [BMI] is associated with increased CIMT, even in seemingly healthy individuals without obvious illness [3,4]. Research indicates a slight but significant increase in CIMT with rising BMI, suggesting early vascular remodeling associated with obesity and highlighting the importance of maintaining a healthy BMI for prevention [5,6].Materials and Methods: The study was undertaken from March 2025 and December 2025 after obtaining Institutional Review Board [IRB] approval in patients referred to the department of Radio diagnosis, Narendra Modi Medical College & L.G hospital, Ahmedabad. The study population consisted first 100 patients with no known case of major comorbidity [e.g. hypertension, diabetes mellitus or hypothyroidism etc.] were subject to screening for carotid intima-media thickness [CIMT] measurement using a Mindray Resona I9 ultrasound machine. Results:The study included 100 apparently healthy adults, comprising 58 males and 42 females, with a mean age of 33.9 years. The mean CIMT was higher in males compared to females. The mean right-sided CIMT was 0.781 ± 0.124 mm in males and 0.729 ± 0.130 mm in females, showing a statistically significant difference [p = 0.044]. The mean left-sided CIMT was 0.779 ± 0.127 mm in males and 0.740 ± 0.131 mm in females; however, this difference was not statistically significant [p = 0.142].Among male participants, individuals in the overweight/obese BMI category demonstrated significantly higher CIMT compared to those in the underweight/normal BMI category [right: 0.820 mm vs 0.744 mm, p = 0.039; left: 0.816 mm vs 0.740 mm, p = 0.049]. In contrast, female participants did notshowstatistically significant difference in CIMT values across BMI groups.Conclusion: Increased carotid intima-media thickness was substantially correlated with elevated BMI in this group of seemingly healthy adults, regardless of conventional cardiovascular risk factors. These results imply that increased adiposity may contribute to early arterial structural changes that predispose to atherosclerosis even in the absence of clinical disease. In order to lower long-term cardiovascular risk and subclinical vascular damage, primary prevention strategies may involve tracking BMI and associated lifestyle changes.
Keywords:
Article :
INTRODUCTION:
Cardiovascular diseases [CVD] continue to be the world's leading cause of morbidity and mortality, contributing significantly to annual deaths worldwide [7]. The main degenerative process that underlies the majority of cardiovascular events is atherosclerosis, which takes several decades to develop before clinical symptoms like myocardial infarction or stroke to appear [8]. Thus, effective cardiovascular disease prevention and risk assessment depend on early detection of subclinical vascular alterations. Non-invasive imaging methods have become more crucial in recent years for identifying early changes in the artery wall in people who appear to be in good health [2,9].
A reliable surrogate indicator of early atherosclerosis and an independent predictor of subsequent cardiovascular events is carotid intima-media thickness [CIMT] [1,10]. High-resolution B-mode ultrasonography can be used to precisely measure CIMT, which is the total thickness of the intimal and medial layers of the carotid artery wall [2,11]. Because ultrasonography is non-invasive, radiation-free, reasonably priced, repeatable, and easily accessible in clinical practice, it is frequently employed for this purpose [11]. Early arterial remodeling and endothelial dysfunction linked to the onset of atherosclerosis are reflected in increased CIMT [10,12]. The mean CIMT value in healthy persons usually falls between 0.5 and 0.8 mm, while values above 0.9 mm are widely thought to be suggestive of early atherosclerotic alterations or elevated cardiovascular risk [13]. CIMT evaluation employing B-mode ultrasonography has emerged as a significant imaging biomarker for evaluating subclinical atherosclerosis and cardiovascular risk due to its sensitivity and dependability in identifying early artery wall thickening [1,2].
Obesity has become more common problem globally and is a significant modifiable risk factor for cardiovascular disease [14]. A common and useful metric for categorizing people based on body fat is body mass index [BMI], which is computed as weight in kilograms divided by height in meters squared [kg/m²] [15]. In contrast to Western societies, Asian populations typically have metabolic and cardiovascular problems at lower BMI levels [16]. As a result, lower BMI cut-off values for Asian populations have been suggested by the World Health Organization and expert consensus groups [16]. The Asian classification divides BMI into four categories: underweight [<18.5 kg/m²], normal weight [18.5–22.9 kg/m²], overweight [23–24.9 kg/m²], and obese [≥25 kg/m²] [16].
Increased adiposity may contribute to early vascular changes even in people who appear clinically healthy and do not have overt cardiovascular disease, hypertension, or diabetes etc, according to a number of epidemiological and imaging studies that show a positive correlation between BMI and CIMT [4,5,17]. Arterial wall thickening and vascular remodeling are significantly influenced by endothelial dysfunction, oxidative stress, chronic low-grade inflammation, and lipid abnormalities, all of which can be exacerbated by excess body fat [18]. Crucially, these vascular changes could take place decades before cardiovascular disease manifests clinically [8].
An accurate and sensitive way to identify these early structural alterations in the artery wall is through B-mode ultrasonographic assessment of the carotid arteries [2,11]. Evaluating CIMT in connection to BMI in seemingly healthy adults may highlight the significance of weight control in primary prevention and help identify people at higher cardiovascular risk early on [5,17]. Thus, the current study intends to assess carotid intima-media thickness in healthy adults using B-mode ultrasonography and ascertain its relationship to body mass index.
MATERIALS AND METHODS:
1. Study design, duration and settings: This was a hospital-based prospective observational study conducted in the Department of Radiodiagnosis, Narendra Modi Medical College and L.G. Hospital, Maninagar, Ahmedabad, Gujarat, India between March 2025 and December 2025 for a duration of 9 months.
2. Equipment Used: Mindray Resona I9 ultrasound machine for B mode ultrasonography equiped with linear transducer [7-12 MHz] with color and spectral doppler facilities.
Inclusion criteria
· Adult of age group 18 to 50 years, irrespective of gender.
· Apparently healthy individuals with no known history of cardiovascular disease [CVD], including coronary artery disease, stroke, peripheral artery disease, or heart failure.
· BMI measurable and categorized [e.g., underweight etc.]
· No regular use of medications that significantly affect vascular health [e.g., antihypertensives, statins, antidiabetics], or limited to none for true "apparently healthy" status.
· Willing and able to provide informed consent.
Exclusion criteria
· Known history or diagnosis of cardiovascular disease, hypertension [e.g., blood pressure ≥140/90 mmHg or on treatment], diabetes mellitus [type 1 or 2], dyslipidemia requiring treatment, chronic kidney disease, or other systemic diseases
· Pregnancy, recent pregnancy, or lactation [due to vascular changes]
· Current or recent smoking [e.g., within the past 5–10 years], heavy alcohol use, or substance abuse.
· Patient not willing to give consent.
Advantages
1. Non-invasive and radiation-free imaging modality
2. B-mode ultrasonography allows safe, non-invasive, and reproducible measurement of carotid intima-media thickness, making it an effective tool for early detection of subclinical atherosclerosis.
3. Early identification of cardiovascular risk
4. Assessing CIMT in apparently healthy adults helps detect early vascular changes associated with increased BMI before the development of overt cardiovascular disease.
5. Cost-effective and widely accessible technique
6. Ultrasonography is relatively inexpensive and easily available in most healthcare settings, which supports its use as a screening tool for early vascular assessment.
Limitations
Operator-dependent measurements
1. CIMT assessment using ultrasonography may vary depending on the experience and technique of the sonographer, potentially affecting measurement consistency.
2. Limited evaluation of confounding factors
3. Other cardiovascular risk factors such as diet, physical activity, lipid profile, or genetic predisposition may influence CIMT but may not be fully accounted for in the study.
4. e.Source of data: Data were collected from apparently healthy adults who were subject to routine USG evaluation in the Department of Radiodiagnosis from period between March 2025 and December 2025 fulfilling the inclusion criteria were obtained. CIMT measurement was done using B-mode USG . Demographic parameters and BMI were also recorded.
5. Study design: A prospective observational single centered study.
6. Sample Size & Study Period: A total of 100 cases from March 2025 to December 2025 after obtaining IRB approval.
Method Of Examination
Patient is made to lie supine with slight neck extension and head turned opposite to the side examined. Using a high-frequency linear probe [7–12 MHz] scanning of the common carotid artery [CCA] is done in longitudinal view with optimized gain, depth, and focus. Measure CIMT at the far wall, approximately 1 cm proximal to the bifurcation; take two measurements on each side.
After that, for imaging the carotid bulb and internal carotid artery [ICA], measuring of CIMT is done just distal to the bulb, again taking two readings per side.
Avoid plaques, ensure clear intima–media interface, and measure during end-diastole for better accuracy.
RESULTS:
The study population comprised 100 apparently healthy subjects with an age range of 18-50 years. There were a larger proportion of male [58%] than female subjects [42%]. Most [68%] of the participants were above the age of 30 years, with the largest proportion [43%] falling within the 31-40 years of age.
TABLE 1: DISTRIBUTION OF PATIENTS ACCORDING TO GENDER [n=100]
|
Gender |
No. of patients |
Percentage |
|
Male |
58 |
58% |
|
Female |
42 |
42% |
|
Total |
100 |
100% |
Out of 100 patients included in the study, 58 were males [58%] and 42 were females [42%].
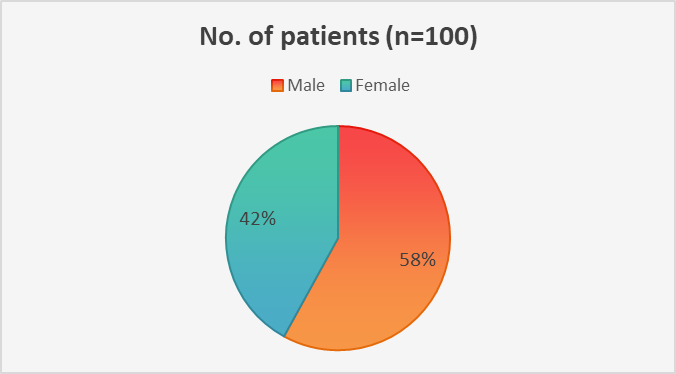
CHART 1: DISTRIBUTION OF PATIENTS ACCORDING TO GENDER
TABLE 2: DISTRIBUTION OF PATIENTS ACCORDING TO AGE[N=100]
|
Age |
No. Of Patients |
Percentage |
|
18-20 |
14 |
14% |
|
21-30 |
18 |
18% |
|
31-40 |
43 |
43% |
|
41-50 |
25 |
25% |
|
Total |
100 |
100% |
The age of the patients ranged from 18 to 50 years, with the highest proportion falling within the 31–40-year age group, followed by those aged 41–50 years. The mean age of the cohort was 33.9 years.
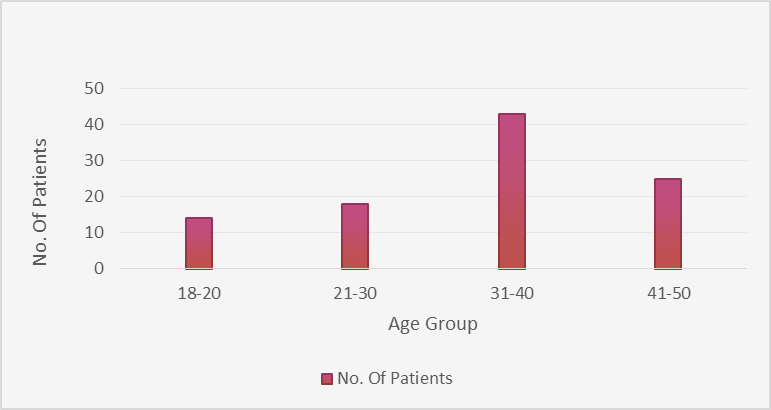
CHART 2: DISTRIBUTION OF PATIENTS ACCORDING TO AGE
TABLE 3: ANTHROPOMETRIC CHARACTERISTICS OF STUDY POPULATION [N=100]
|
Parameter |
Male [Mean ± SD] |
Female [Mean ± SD] |
P-value |
|
Height [m] |
1.77 ± 0.05 |
1.62 ± 0.07 |
0.38 |
|
Weight [kg] |
69.24 ± 13.41 |
63.6 ± 10.48 |
|
|
BMI [kg/m²] |
23.52 ± 3.39 |
24.2 ± 4.19 |
The mean height, weight, and BMI [±SD] for male subjects were 1.77 ± 0.05 m, 69.24 ± 13.41 kg, and 23.52 ± 3.39 kg/m2 respectively, while values were 1.62 ± 0.07 m, 63.6 ± 10.48 kg, and 24.2 ± 4.19 kg/m2 for female participants, respectively. The difference in mean BMI values between genders is not statistically significant [P = 0.38].
TABLE 4: DISTRIBUTION ACCORDING TO BMI CATEGORY [ASIAN CLASSIFICATION]
|
BMI Category |
BMI Range [kg/m²] |
No. of Patients |
|
Underweight |
<18.5 |
4 |
|
Normal |
18.5–22.9 |
50 |
|
Overweight |
23–24.9 |
18 |
|
Obese |
≥25 |
28 |
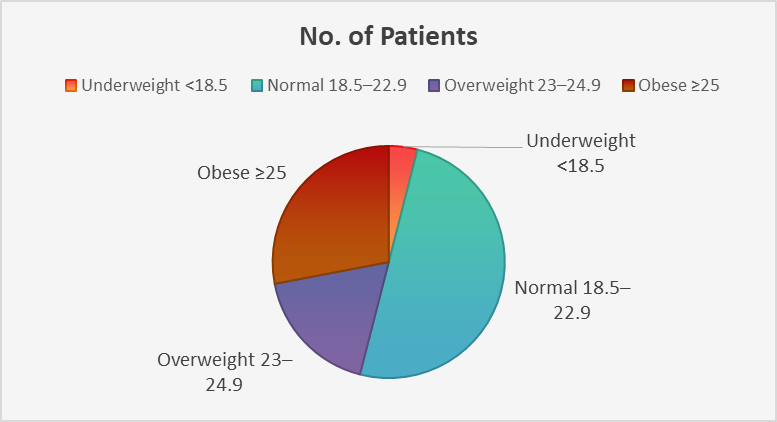
CHART 3: DISTRIBUTION ACCORDING TO BMI CATEGORY [ASIAN CLASSIFICATION] AND MEAN CIMT
TABLE 5: ASSOCIATION BETWEEN BMI CATEGORY AND MEAN CIMT
|
BMI Category |
Number of Participants |
Mean CIMT [mm] |
|
Underweight |
4 |
0.69 |
|
Normal |
50 |
0.73 |
|
Overweight |
18 |
0.78 |
|
Obese |
28 |
0.82 |
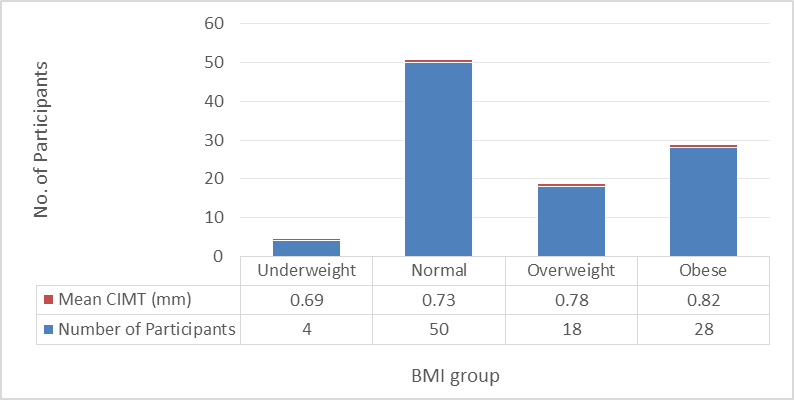
CHART 4: ASSOCIATION BETWEEN BMI CATEGORY AND MEAN CIMT
VALUES FOR MALES AND FEMALES
|
Side |
Gender |
No. Of Patients |
Mean CIMT [mm] |
T-test |
|
Right |
Male |
58 |
0.781 ± 0.124 |
2.04 |
|
Right |
Female |
42 |
0.729 ± 0.130 |
|
|
Left |
Male |
58 |
0.779 ± 0.127 |
1.48 |
|
Left |
Female |
42 |
0.740 ± 0.131 |
The mean CIMT on the right side was 0.781 ± 0.124 and 0.729 ± 0.130 mm for males and females, respectively. On the left side, mean IMT was 0.779 ± 0.127 and 0.740 ± 0.131 mm for males and females, respectively. Mean CIMT values were lower in females but this was only significant on the right side. The right side shows higher values than the left in the males.
TABLE 7: DISTRIBUTION OF MEAN CIMT VALUES FOR MALE AND FEMALE PATIENTS BY BMI GROUPS
|
Side of Neck / Gender |
BMI groups |
N [%] |
Mean CIMT |
T-test |
P value |
|
Rt. carotid / male |
Underweight/Normal |
31 [53.4%] |
0.744 |
2.12 |
0.039 |
|
Overweight/Obese |
27 [46.6%] |
0.820 |
|
|
|
|
Lt. carotid / male |
Underweight/Normal |
31 [53.4%] |
0.740 |
2.01 |
0.049 |
|
Overweight/Obese |
27 [46.6%] |
0.816 |
|
|
|
|
Rt. carotid / female |
Underweight/Normal |
23 [54.8%] |
0.720 |
0.82 |
0.415 |
|
Overweight/Obese |
19 [45.2%] |
0.743 |
|
|
|
|
Lt. carotid / female |
Underweight/Normal |
23 [54.8%] |
0.737 |
0.64 |
0.524 |
|
Overweight/Obese |
19 [45.2%] |
0.731 |
|
|
As seen from above table, the proportion of the underweight/normal group and overweight/obese group in the male subjects were 54 and 46%, respectively. The mean CIMT values on the right [0.820 mm] and left [0.816 mm] sides were higher for the overweight/obese male subjects when compared with mean values for the underweight/normal subjects [right: 0.744 mm and left: 0.740 mm]. This difference is statistically significant bilaterally with P values of 0.039 and 0.049 for the right and left sides, respectively.
For the females, the proportions of the underweight/normal subjects and the overweight/obese subjects are 54.3 and 45.7%, respectively. This is similar to the distribution in males. The mean CIMT values on the right and left sides for the overweight/obese female subjects were 0.743 and 0.731 mm, respectively. The mean CIMT on the right and left sides for the underweight/normal female subjects were 0.720 and 0.737 mm, respectively. However, there is no statistically significant difference between the two BMI groups in female subjects.
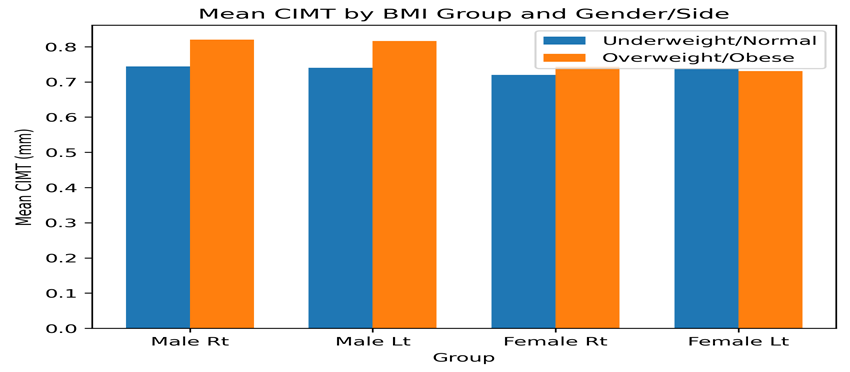
CHART 5: DISTRIBUTION OF MEAN CIMT VALUES FOR MALE AND FEMALE PATIENTS BY BMI GROUPS
TABLE 8: CORRELATION OF PATIENT’S WEIGHT AND BMI WITH CIMT VALUES FOR MALE AND FEMALE PARTICIPANTS
|
Gender |
Side |
Pearson [r] |
P-value |
|
Male |
Right |
0.252 |
0.07 |
|
Left |
0.142 |
0.236 |
|
|
Female |
Right |
0.095 |
0.338 |
|
Left |
0.108 |
0.312 |
A weak positive correlation is noted between BMI of the male subjects and CIMT on both sides, however this is also not statistically significant, with Pearson's correlation coefficient of 0.252 [P = 0.070] and 0.142 [P = 0.236] on the right and the left sides, respectively. Female subjects also show no statistically significant correlation between BMI and CIMT.
DISCUSSION:
Obesity is a condition of excessive body fat accumulation that increases body weight beyond what is considered appropriate for height and body composition [14]. Body mass index is the most commonly used measure to classify obesity in epidemiological studies [15]. Individuals are considered overweight if their BMI is ≥23-24.9 kg/m² and obese if BMI is ≥25 kg/m² according to Asian classification system[15].
CIMT and hypertension
In this investigation, adaptive vascular alterations, particularly carotid arterial wall thickening in relation to BMI, were evaluated using high-resolution B-mode ultrasound, which is non-invasive, safe, affordable, accurate, and repeatable [2,11].
Several previous studies have demonstrated that increased BMI is associated with increased CIMT and early arterial remodeling [4,5,17]. Holland et al. reported increased CIMT values among obese individuals and patients with features of metabolic syndrome [19]. Similarly, Gonzalez et al. demonstrated a significant association between BMI and CIMT in young adults [20]. Leite et al. also reported that overweight and obese individuals had significantly higher CIMT values compared with individuals with normal BMI [21].
Endothelial dysfunction, systemic inflammation, oxidative stress, and dyslipidemia related to excess adiposity are considered major mechanisms linking obesity to increased arterial wall thickness and early atherosclerosis [18].
CIMT And Gender
In this investigation, males had higher mean CIMT on both the left and right sides than females; however, this difference was only statistically significant on the right side. This result is consistent with research by Youn et al. [22], who found that middle-aged males in a rural Korean population had greater CIMT levels than females. There are inconsistent findings about the relationship between gender and CIMT, though, as some other research found no discernible gender variations in hypertensive patients CIMT measures.
CIMT And Obesity
In this study, the mean CIMT values for male individuals who were overweight or obese were greater than those for male patients who were underweight or normal. There is a statistically significant bilateral difference between the two groups values [0.820 and 0.816 mm vs. 0.744 and 0.740 mm on the right and left sides, respectively]. The CIMT values of the female patients, however, did not differ statistically significantly between the underweight/normal and overweight/obese groups.
The results in male participants are consistent with findings from earlier researches which demonstrate a favorable correlation between CIMT and BMI. Additionally, Gonzalez et al. [20] found a strong correlation between young adults BMI and CIMT. In a similar vein, Leite et al. [21] found that patients who were overweight or obese had higher mean CIMT scores than those who were underweight or normal.
Weight, BMI, and CIMT
The lack of connection between CIMT and weight for the female patients in this study could be explained by the somewhat lower mean CIMT levels and lower weights seen in females compared to males. Furthermore, this study only shows a marginally positive correlation between weight and BMI and between weight and CIMT levelthe left and right sides for males.
This is not statistically significant, though. Furthermore, the weight, BMI, and CIMT of the female participants do not appear to be related. These contrast with some earlier research that found a favorable link between BMI and CIMT. Youn and associates, [22]found a clear correlation between CIMT and obesity after examining the correlates of mean CIMT in a middle-aged rural Korean sample.
The fact that a higher proportion of individuals in both genders had BMI values in the normal range, which is associated with relatively low CIMT levels, may account for the study's findings.
CONCLUSION:
In ostensibly healthy adults, the current study demonstrates a significant correlation between body mass index [BMI] and carotid intima-media thickness [CIMT] measured by B-mode ultrasonography. Despite the absence of obvious cardiovascular illness, higher BMI was associated with enhanced CIMT, indicating early vascular changes and subclinical atherosclerosis. It has been demonstrated that B-mode ultrasonography is a reliable non-invasive imaging method for detecting early alterations in artery walls. These findings highlight the importance of maintaining a healthy BMI as well as the use of ultrasound in early cardiovascular risk assessment and preventive measures.
Acknowledgements: The authors would like to thank all patients who participated in this study and the technical staff of the Department of Radiodiagnosis for their assistance in data collection. Special acknowledgment to the Institutional Review Board for their guidance and approval.
ILLUSTRATED CASES & CIMT MEASUREMENT
1. Patient Details
Gender: Male
Age: 49 years
Height: 162 cm
Weight: 54 kg
BMI: 20.6 kg/m² [Normal BMI category – Asian classification]
CIMT Measurements:
|
Artery |
Measurement 1 [cm] |
Measurement 2 [cm] |
Mean [cm] |
Mean [mm] |
|
Right CCA |
0.07 |
0.08 |
0.075 |
0.75 |
|
Left CCA |
0.06 |
0.07 |
0.065 |
0.65 |
|
Right ICA |
0.09 |
0.07 |
0.080 |
0.80 |
|
Left ICA |
0.07 |
0.07 |
0.070 |
0.70 |
Ultrasound Images:
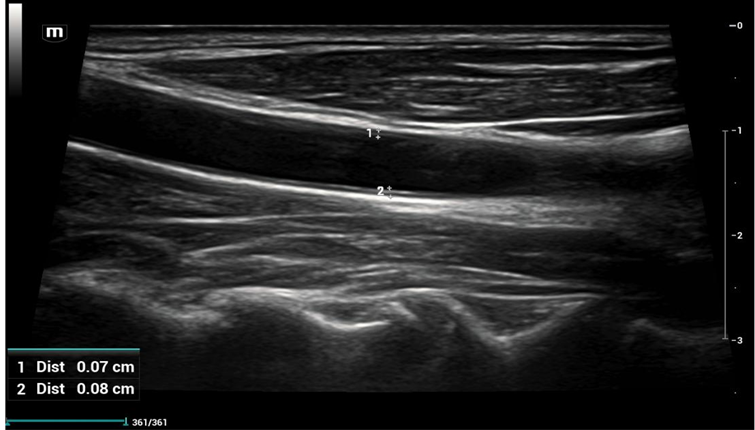
FIGURE 1
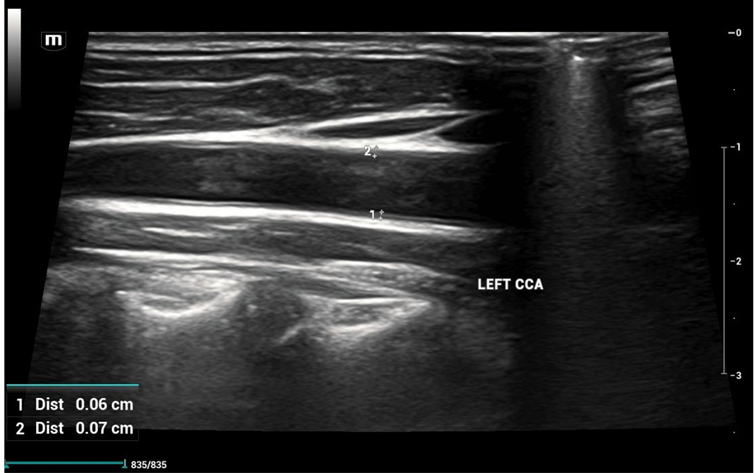
FIGURE 2
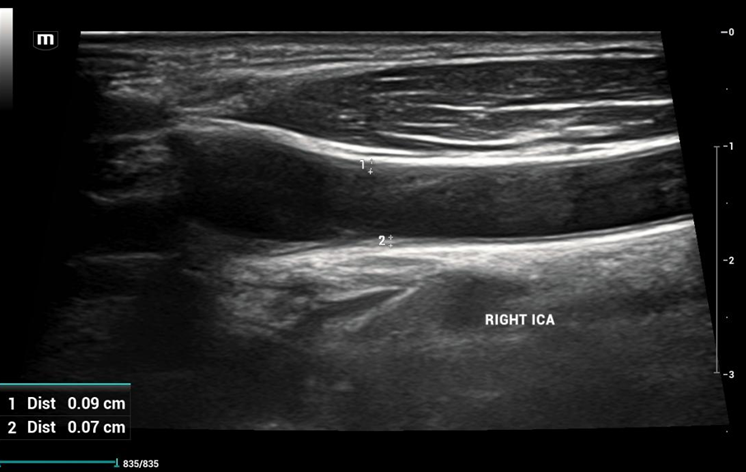
FIGURE 3
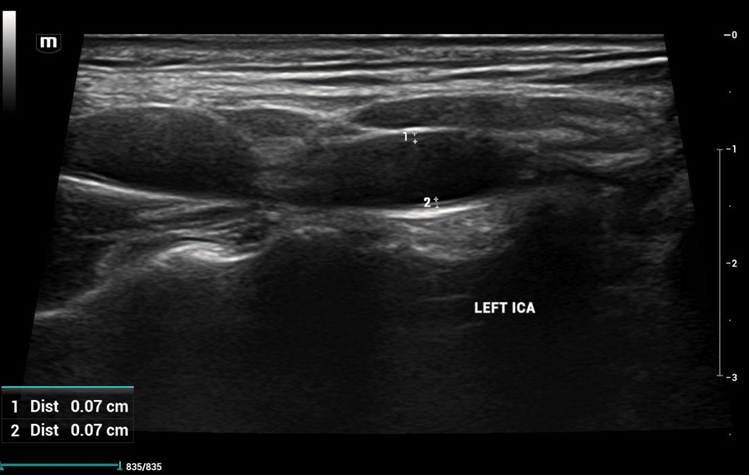
FIGURE 4
Figure 1-4: B-mode ultrasound image [longitudinal] shows measurement of Carotid Intima-Media Thickness [CIMT]intimal [in Calipers++ ]
1. Patient Details
Gender: Male
Age: 48 years
Height: 170 cm
Weight: 75 kg
BMI: 25.9 kg/m² [Obese category – Asian classification]
CIMT Measurements:
|
Artery |
Measurement no. 1 [cm] |
Measurement no. 2 [cm] |
Mean [cm] |
Mean [mm] |
|
Right CCA |
0.13 |
0.11 |
0.12 |
1.20 |
|
Left CCA |
0.10 |
0.10 |
0.10 |
1.00 |
|
Right ICA |
0.11 |
0.10 |
0.105 |
1.05 |
|
Left ICA |
0.13 |
0.10 |
0.115 |
1.15 |
Ultrasound Images:
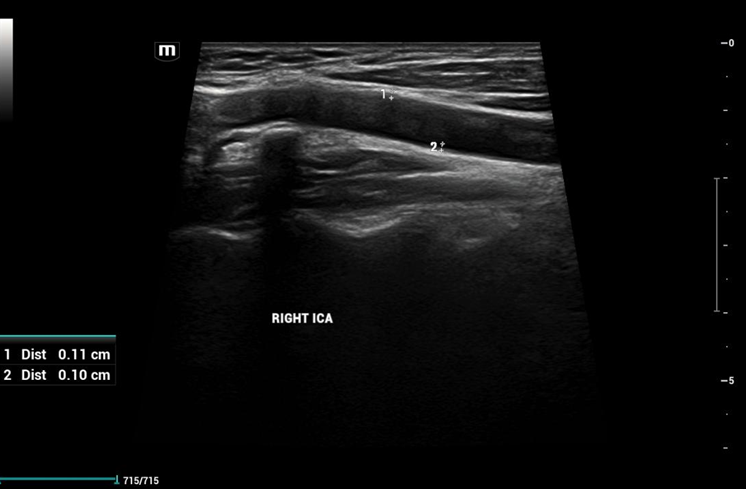
FIGURE 1: Right CCA – B‑mode longitudinal ultrasound image demonstrating CIMT measurement.
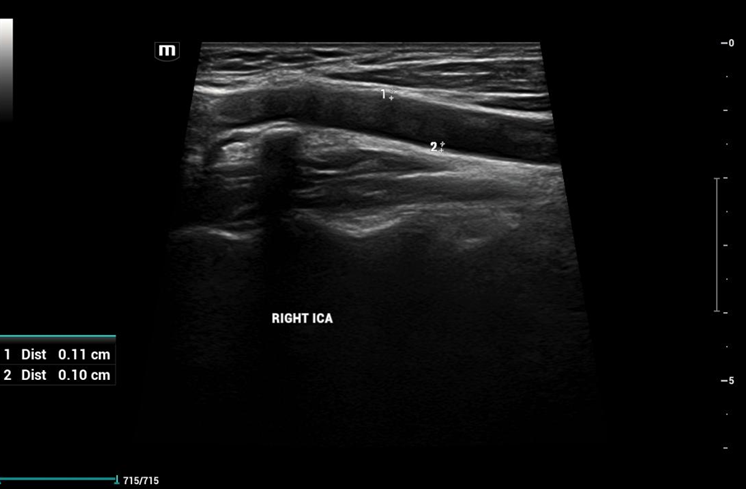
FIGURE 2: Right ICA – B‑mode longitudinal ultrasound image demonstrating CIMT measurement.
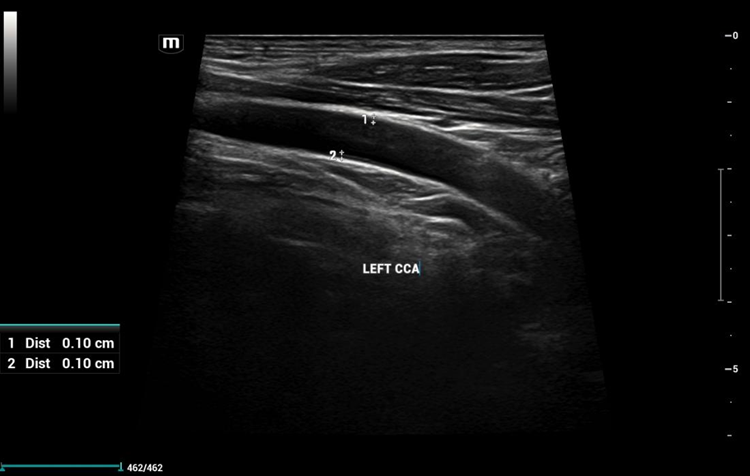
FIGURE 3: Left CCA – B‑mode longitudinal ultrasound image demonstrating CIMT measurement.
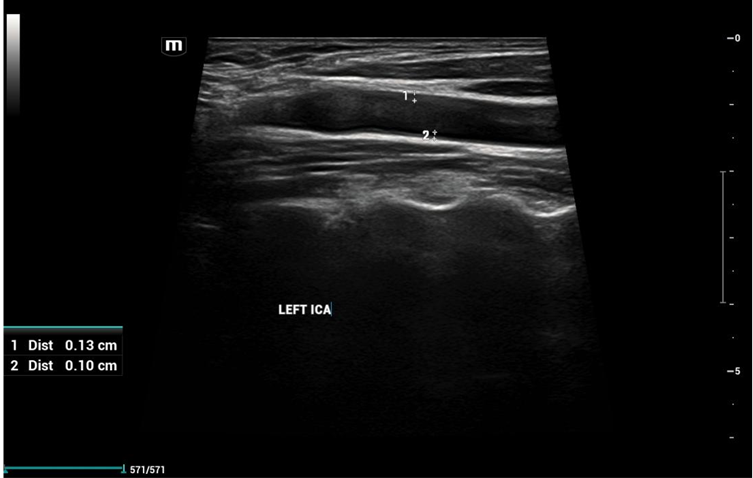
FIGURE 4: Left ICA – B‑mode longitudinal ultrasound image demonstrating CIMT measurement.
It is seen from above mentioned illustrated cases that High BMI correlates with increased CIMT, thus proving direct correlation between both the factors.
REFERENCES:
1. Lorenz MW, Markus HS, Bots ML, Rosvall M, Sitzer M. Prediction of clinical cardiovascular events with carotid intima-media thickness. Circulation. 2007;115:459–467.
2. Stein JH, Korcarz CE, Hurst RT, et al. Use of carotid ultrasound to identify subclinical vascular disease and evaluate cardiovascular disease risk. J Am Soc Echocardiogr. 2008;21:93–111.
3. Skilton MR, Celermajer DS, Cosmi E, et al. Natural history of carotid intima-media thickness and its association with cardiovascular risk factors. J Am Coll Cardiol. 2008;52:150–157.
4. Iannuzzi A, Licenziati MR, Acampora C, et al. Increased carotid intima-media thickness and obesity in childhood. Obesity [Silver Spring]. 2004;12:1008–1012.
5. Gonzalez J, et al. Association between body mass index and carotid intima-media thickness in young adults. Atherosclerosis. 2008;197:218–223.
6. Freedman DS, et al. Relation of body mass index and vascular changes in early adulthood. Circulation. 2004;109:210–215.
7. World Health Organization. Cardiovascular diseases [CVDs]. WHO Fact Sheet. 2023.
8. Ross R. Atherosclerosis—an inflammatory disease. N Engl J Med. 1999;340:115–126.
9. Bots ML, Grobbee DE. Intima media thickness as a surrogate marker for generalized atherosclerosis. J Intern Med. 2002;251:479–487.
10. O’Leary DH, Polak JF, Kronmal RA, et al. Carotid-artery intima and media thickness as a risk factor for myocardial infarction and stroke. N Engl J Med. 1999;340:14–22.
11. Touboul PJ, Hennerici MG, Meairs S, et al. Mannheim consensus on carotid intima-media thickness measurement. Cerebrovasc Dis. 2004;18:346–349.
12. Libby P, Ridker PM, Hansson GK. Inflammation in atherosclerosis. J Am Coll Cardiol. 2009;54:2129–2138.
13. Baldassarre D, et al. Carotid intima-media thickness and cardiovascular risk prediction. Atherosclerosis. 2012;223:1–9.
14. Hruby A, Hu FB. The epidemiology of obesity. Pharmacoeconomics. 2015;33:673–689.
15. World Health Organization. Obesity: preventing and managing the global epidemic. WHO Technical Report Series. 2000.
16. WHO Expert Consultation. Appropriate body-mass index for Asian populations and its implications for policy and intervention strategies. Lancet. 2004;363:157–163.
17. Urbina EM, et al. Relation of obesity and metabolic risk factors with carotid intima-media thickness in healthy young adults. J Am Coll Cardiol. 2010;55:735–742.
18. Van Gaal LF, Mertens IL, De Block CE. Mechanisms linking obesity with cardiovascular disease. Nature. 2006;444:875–880.
19. Holland DJ, et al. Obesity, metabolic syndrome and carotid intima-media thickness. Cardiovasc J Afr. 2011;22:236–241.
20. Gonzalez MA, et al. Association between body mass index and carotid atherosclerosis. Atherosclerosis. 2008;197:218–223.
21. Leite SA, et al. Relationship between body mass index and carotid intima-media thickness. Clinics [Sao Paulo]. 2012;67:1205–1210.
22. Youn JY, Lee NS, Kim JY, Lee JW, Sung JK, Ahn SG, et al. Normative values and correlates of mean common carotid intima-media thickness in the Korean rural middle-aged population: the ARIRANG study. J Korean Med Sci. 2011;26:365–371.