Predictors of Visual Outcome Following Intravitreal Anti-VEGF Therapy in Retinal Vein Occlusion: A Prospective Study
- Ramanna , Assistant Professor, Department of Ophthalmology, RIMS, Raichur
- B. Karishma Munoli , Associate Professor, Department of Ophthalmology, RIMS, Raichur
- Vidyashri M , Private practice, Department of Ophthalmology, Shankarappagouda hospital, Yadgir
Article Information:
Abstract:
Background: Retinal vein occlusion (RVO) is an important retinal vascular disorder causing visual impairment, predominantly through macular oedema and retinal ischaemia. Intravitreal anti-vascular endothelial growth factor (anti-VEGF) therapy improves anatomical and functional outcomes; however, considerable variability in visual recovery exists. Identifying predictors of treatment response may facilitate individualized prognostication and management. Methods: This prospective observational study included 80 patients with RVO-associated macular oedema treated with intravitreal anti-VEGF therapy. Demographic, systemic, clinical, and optical coherence tomography (OCT) parameters were recorded. Best-corrected visual acuity (BCVA) and central macular thickness (CMT) were assessed at baseline and during 6 months of follow-up. Baseline OCT biomarkers and clinical parameters were evaluated for their association with final visual outcome. Multivariable analysis was performed to identify independent predictors of poor visual outcome. Results: Mean BCVA improved significantly from 0.78 ± 0.31 logMAR at baseline to 0.42 ± 0.26 at 6 months (p<0.001), while mean CMT decreased from 512.6 ± 118.4 µm to 291.7 ± 76.8 µm (p<0.001). Baseline BCVA showed a strong correlation with final BCVA (r/ρ=0.62, p<0.001). On multivariable analysis, retinal/macular ischaemia (AOR 4.73), ellipsoid-zone disruption (AOR 4.26), poor baseline BCVA (AOR 3.42), DRIL (AOR 3.11), and symptom duration >6 weeks (AOR 2.67) independently predicted poor visual outcome. Conclusion: Intravitreal anti-VEGF therapy produced significant visual and anatomical improvement in RVO. Baseline visual function, treatment delay, retinal structural integrity, and ischaemic status were important determinants of visual prognosis.
Keywords:
Article :
INTRODUCTION:
Retinal vein occlusion (RVO) is an important retinal vascular disorder and a major cause of visual morbidity, ranking second only to diabetic retinopathy among retinal vascular diseases.[1] Its occurrence increases with advancing age and is associated with several systemic and vascular risk factors, including hypertension, diabetes mellitus, dyslipidaemia, cigarette smoking, hypercholesterolaemia, glaucoma, and arteriosclerotic vascular changes.[2,3] Depending on the anatomical site of venous obstruction, RVO is broadly classified as branch retinal vein occlusion (BRVO), central retinal vein occlusion (CRVO), and, less commonly, hemi-retinal vein occlusion. Its pathogenesis is multifactorial and involves venous obstruction, endothelial dysfunction, retinal hypoxia, inflammation, and alterations in vasoactive and inflammatory mediators. [4,5]
Macular oedema is one of the principal causes of visual impairment in RVO. Obstruction of retinal venous outflow results in increased intravascular pressure, disruption of the blood-retinal barrier, and leakage of fluid into the retinal tissue.[6] Retinal hypoxia further stimulates the expression of vascular endothelial growth factor (VEGF), which increases vascular permeability and contributes to persistent macular oedema and pathological neovascularization. In addition, retinal capillary non-perfusion and macular ischaemia may cause irreversible structural damage and further compromise visual function.
The introduction of intravitreal anti-VEGF therapy has substantially transformed the management of RVO-associated macular oedema. Agents such as bevacizumab, ranibizumab, and aflibercept have demonstrated significant anatomical and functional benefits and are currently considered the mainstay of treatment.[7] Repeated intravitreal injections are commonly required, with subsequent treatment individualized using pro-re-nata or treat-and-extend regimens according to visual acuity, optical coherence tomography (OCT) findings, recurrence of oedema, and previous treatment response.[8–10]
Despite the established efficacy of anti-VEGF therapy, considerable interindividual variability exists in visual outcomes. Some patients achieve substantial and sustained visual improvement, whereas others demonstrate limited functional recovery despite satisfactory anatomical resolution of macular oedema. Several potential predictors have therefore been investigated, including age, baseline best-corrected visual acuity, duration of symptoms, type of RVO, central macular thickness, retinal perfusion status, systemic vascular comorbidities, and treatment frequency.[10,11] OCT-derived biomarkers, including intraretinal and subretinal fluid, disorganization of retinal inner layers, integrity of the ellipsoid zone and external limiting membrane, and other structural abnormalities, may provide additional prognostic information regarding visual recovery.
Furthermore, real-world visual outcomes may be influenced by delayed treatment, inadequate injection frequency, recurrence of macular oedema, and irregular follow-up.[11–13] Identification of reliable predictors of treatment response is therefore important for individualized prognostication, patient counselling, and optimization of therapeutic strategies. The present prospective study is undertaken to evaluate visual outcomes following intravitreal anti-VEGF therapy in patients with RVO and to identify the clinical, systemic, and ocular factors that predict subsequent visual response.
MATERIALS AND METHODS:
Study Design and Setting
This prospective observational study was conducted in the Department of Ophthalmology at a tertiary care teaching hospital. Patients diagnosed with retinal vein occlusion (RVO) with macular oedema who were planned for intravitreal anti-vascular endothelial growth factor (anti-VEGF) therapy were enrolled in the study.
Study Population
The study included patients with central retinal vein occlusion (CRVO), branch retinal vein occlusion (BRVO), or hemi-retinal vein occlusion (HRVO) who had associated macular oedema and were considered eligible for intravitreal anti-VEGF treatment. Patients fulfilling the predefined eligibility criteria were recruited consecutively during the study period.A total of 80 patients with retinal vein occlusion were included in the study. Each patient contributed one affected eye to the analysis. In patients with bilateral involvement, the eye requiring anti-VEGF treatment at the time of enrolment was included.
Inclusion Criteria
Patients were included if they:
1. Were aged ≥18 years.
2. Had a clinical diagnosis of BRVO, CRVO, or HRVO.
3. Had macular oedema attributable to RVO confirmed by spectral-domain optical coherence tomography (SD-OCT).
4. Had decreased visual acuity associated with RVO-related macular oedema.
5. Were planned for intravitreal anti-VEGF therapy.
6. We’re willing to participate and provided written informed consent.
7. Were available for the required follow-up examinations.
Exclusion Criteria
Patients were excluded if they:
1. Had significant coexisting ocular disease likely to independently affect visual acuity, such as advanced glaucoma, visually significant cataract, corneal opacity, age-related macular degeneration, or other macular disorders.
2. Had diabetic macular oedema or another retinal vascular disorder responsible for macular oedema.
3. Had a history of vitreoretinal surgery in the study eye.
4. Had active ocular or periocular infection or inflammation.
5. Had media opacity that prevented adequate fundus examination or OCT imaging.
6. Had uncontrolled systemic illness or a contraindication to intravitreal anti-VEGF therapy.
7. Were unable or unwilling to complete the scheduled follow-up.
Clinical Evaluation
At enrolment, detailed demographic and clinical information was recorded using a predefined study proforma. Data included age, sex, duration of symptoms, affected eye, type of RVO, and previous ocular history. Systemic risk factors, including hypertension, diabetes mellitus, dyslipidaemia, smoking, and cardiovascular disease, were documented.A comprehensive ophthalmological examination was performed at baseline. Best-corrected visual acuity (BCVA) was assessed using a standard Snellen or logarithm of the minimum angle of resolution (logMAR) chart and was converted to logMAR units for statistical analysis where required. Anterior-segment examination was performed using slit-lamp biomicroscopy. Intraocular pressure was measured using applanation tonometry. Dilated fundus examination was performed using indirect ophthalmoscopy and slit-lamp biomicroscopy with an appropriate fundus lens.
Optical Coherence Tomography Assessment
Spectral-domain optical coherence tomography was performed at baseline and during follow-up to assess macular morphology and treatment response. Central macular thickness (CMT) was recorded in micrometres.
In addition to CMT, relevant OCT characteristics were evaluated, including the presence of intraretinal fluid, subretinal fluid, cystoid macular changes, disorganization of the retinal inner layers (DRIL), hyperreflective foci, and integrity or disruption of the ellipsoid zone and external limiting membrane. These parameters were assessed as potential anatomical predictors of subsequent visual outcome.
Assessment of Retinal Ischaemia
Retinal perfusion status was evaluated clinically and, where indicated, using fundus fluorescein angiography. The presence and extent of capillary non-perfusion, macular ischaemia, and retinal neovascularization were documented. Patients were categorized according to the presence or absence of clinically significant retinal ischaemia for subsequent analysis.
Intravitreal Anti-VEGF Therapy
All eligible patients received intravitreal anti-VEGF therapy under strict aseptic precautions. The anti-VEGF agent used was recorded for each patient. Before injection, topical anaesthesia and povidone-iodine antisepsis were applied. The drug was injected intravitreally through the pars plana using a sterile technique.Following the injection, patients were examined for immediate complications and were advised regarding symptoms suggestive of endophthalmitis, retinal detachment, or other injection-related complications. Subsequent injections were administered according to the anatomical and functional response and the treating ophthalmologist's predefined treatment protocol.
Follow-Up and Outcome Assessment
Patients were followed at predetermined intervals after initiation of anti-VEGF therapy. At each follow-up visit, BCVA, intraocular pressure, anterior-segment findings, fundus findings, and SD-OCT parameters were reassessed. The number of anti-VEGF injections administered during the study period and recurrence or persistence of macular oedema were documented.
Visual outcome was assessed by comparing the final BCVA with baseline BCVA. Anatomical response was evaluated primarily by the change in CMT and resolution or persistence of intraretinal and/or subretinal fluid.
Outcome Measures
Primary Outcome
The primary outcome was change in BCVA following intravitreal anti-VEGF therapy from baseline to the final follow-up visit.
Secondary Outcomes
Secondary outcomes included:
• Change in central macular thickness following treatment.
• Proportion of patients showing clinically meaningful visual improvement.
• Anatomical response to anti-VEGF therapy.
• Number of intravitreal anti-VEGF injections required.
• Persistence or recurrence of macular oedema.
• Association of baseline clinical and OCT characteristics with final visual outcome.
• Identification of independent predictors of favourable or poor visual outcome.
Potential Predictors Evaluated
The potential predictors of visual outcome included age, sex, duration of symptoms, baseline BCVA, type of RVO, baseline CMT, retinal ischaemia, hypertension, diabetes mellitus, dyslipidaemia, smoking status, intraretinal fluid, subretinal fluid, DRIL, ellipsoid-zone disruption, external limiting membrane disruption, hyperreflective foci, and number of anti-VEGF injections received.
Data Collection
All demographic, systemic, ocular, imaging, treatment, and follow-up data were recorded in a structured case record form. Data were checked for completeness and subsequently entered into a computerized database for statistical analysis.
Statistical Analysis
Data were analysed using an appropriate SPSS. 21statistical software package. Continuous variables were expressed as mean ± standard deviation (SD) for normally distributed data and as median with interquartile range (IQR) for non-normally distributed data. Categorical variables were presented as frequencies and percentages.
Normality of continuous variables was assessed using the Shapiro–Wilk test. Changes in BCVA and CMT from baseline to follow-up were analysed using the paired Student's t-test or Wilcoxon signed-rank test, as appropriate. For comparisons between independent groups, the independent-samples t-test or Mann–Whitney U test was used. Categorical variables were compared using the Chi-square test or Fisher's exact test.
Correlation between continuous clinical/OCT parameters and visual outcome was evaluated using Pearson's or Spearman's correlation coefficient, as appropriate. Univariate regression analysis was initially performed to identify potential predictors of final visual outcome. Variables considered clinically relevant or showing significant associations on univariate analysis were entered into a multivariable regression model to identify independent predictors of visual outcome after anti-VEGF therapy. Effect estimates were reported with 95% confidence intervals. A p-value of <0.05 was considered statistically significant.
RESULTS:
A total of 80 patients with retinal vein occlusion (RVO) who received intravitreal anti-VEGF therapy were included in the study. The mean age of the participants was 61.8 ± 10.4 years. The largest proportion belonged to the 60–69-year age group (38.8%), followed by 50–59 years (25.0%), ≥70 years (23.8%), and <50 years (12.5%). Males constituted 56.3% of the study population, while females constituted 43.8%. The right eye was affected in 52.5% and the left eye in 47.5% of patients. Hypertension was the most frequent systemic comorbidity (58.8%), followed by diabetes mellitus (31.3%) and dyslipidaemia (27.5%). A history of smoking was present in 21.3% of participants. The mean duration of symptoms before presentation was 5.6 ± 3.2 weeks (Table 1).
Regarding the type of RVO, BRVO was the most common and was observed in 47 (58.8%) patients, followed by CRVO in 28 (35.0%) and HRVO in 5 (6.3%) patients. The mean baseline best-corrected visual acuity (BCVA) was 0.78 ± 0.31 logMAR, while the mean baseline central macular thickness (CMT) was 512.6 ± 118.4 µm. Intraretinal fluid was present in 86.3% and subretinal fluid in 43.8% of patients. DRIL was identified in 36.3%, ellipsoid-zone disruption in 31.3%, ELM disruption in 26.3%, and hyperreflective foci in 41.3%. Retinal or macular ischaemia was documented in 23.8% of patients (Table 2).
There was a progressive and statistically significant improvement in visual acuity following intravitreal anti-VEGF therapy. Mean BCVA improved from 0.78 ± 0.31 logMAR at baseline to 0.61 ± 0.29 at 1 month, 0.49 ± 0.27 at 3 months, and 0.42 ± 0.26 at 6 months (p<0.001). A corresponding significant anatomical improvement was observed, with mean CMT decreasing from 512.6 ± 118.4 µm at baseline to 394.8 ± 104.7 µm at 1 month, 326.5 ± 89.6 µm at 3 months, and 291.7 ± 76.8 µm at 6 months (p<0.001). The proportion of eyes with intraretinal fluid declined from 86.3% at baseline to 18.8% at 6 months, while subretinal fluid decreased from 43.8% to 7.5% (Table 3).
Baseline OCT characteristics demonstrated significant associations with final visual outcome. Patients with DRIL had poorer final BCVA than those without DRIL (0.61 ± 0.27 vs 0.31 ± 0.20 logMAR; p<0.001). Similarly, ellipsoid-zone disruption (0.66 ± 0.28 vs 0.31 ± 0.19; p<0.001) and ELM disruption (0.68 ± 0.29 vs 0.33 ± 0.21; p<0.001) were associated with poorer final visual acuity. Hyperreflective foci were also associated with significantly poorer final BCVA (p=0.006). The presence of retinal/macular ischaemia showed a strong association with poorer visual outcome (0.69 ± 0.29 vs 0.34 ± 0.21 logMAR; p<0.001). In contrast, baseline subretinal fluid was not significantly associated with final BCVA (p=0.226) (Table 4 and Figure 1).
Correlation analysis demonstrated that several baseline clinical parameters were significantly related to final visual outcome (Table 5 and Figure 2). Baseline BCVA showed the strongest positive correlation with final BCVA (r/ρ=+0.62, p<0.001), indicating that poorer baseline vision was strongly associated with poorer final vision. Duration of symptoms demonstrated a moderate positive correlation (r/ρ=+0.41, p<0.001), whereas age (r/ρ=+0.28, p=0.012) and baseline CMT (r/ρ=+0.29, p=0.009) showed weak positive correlations with final BCVA. The number of anti-VEGF injections demonstrated a weak negative correlation (r/ρ=−0.25, p=0.026), while reduction in CMT showed a moderate negative correlation with final BCVA (r/ρ=−0.39, p<0.001). Thus, greater anatomical improvement was associated with better final visual acuity.
On multivariable analysis, several factors remained independently associated with poor visual outcome following anti-VEGF therapy (Table 6 and Figure 3). Retinal/macular ischaemia was associated with the greatest increase in the odds of poor visual outcome (adjusted OR 4.73, 95% CI 1.71–13.08; p=0.003), followed by ellipsoid-zone disruption (adjusted OR 4.26, 95% CI 1.68–10.81; p=0.002), poor baseline BCVA (adjusted OR 3.42, 95% CI 1.48–7.91; p=0.004), and DRIL (adjusted OR 3.11, 95% CI 1.29–7.50; p=0.011). A symptom duration of >6 weeks was also an independent predictor of poor outcome (adjusted OR 2.67, 95% CI 1.13–6.31; p=0.025). CRVO showed a trend toward poorer outcome but did not achieve statistical significance (p=0.069). Hypertension (p=0.462) and diabetes mellitus (p=0.359) were also not independently associated with poor visual outcome.
Overall, intravitreal anti-VEGF therapy resulted in significant functional and anatomical improvement over the 6-month follow-up period. However, visual recovery was influenced by baseline functional status, duration of symptoms, and retinal structural and perfusion characteristics. Poor baseline BCVA, prolonged symptom duration, DRIL, ellipsoid-zone disruption, and retinal/macular ischaemia emerged as the principal independent predictors of poor visual outcome (Table 6 and Figure 3).
Table 1. Demographic and Baseline Clinical Characteristics of Study Participants (n=80)
|
Variable |
Category |
n (%) / Mean ± SD |
|
Age (years) |
Mean ± SD |
61.8 ± 10.4 |
|
Age group |
<50 years |
10 (12.5) |
|
50–59 years |
20 (25.0) |
|
|
60–69 years |
31 (38.8) |
|
|
≥70 years |
19 (23.8) |
|
|
Sex |
Male |
45 (56.3) |
|
Female |
35 (43.8) |
|
|
Eye involved |
Right |
42 (52.5) |
|
Left |
38 (47.5) |
|
|
Hypertension |
Present |
47 (58.8) |
|
Diabetes mellitus |
Present |
25 (31.3) |
|
Dyslipidaemia |
Present |
22 (27.5) |
|
Smoking history |
Present |
17 (21.3) |
|
Duration of symptoms (weeks) |
Mean ± SD |
5.6 ± 3.2 |
Table 2. Distribution of RVO Type and Baseline Ocular/OCT Characteristics (n=80)
|
Variable |
Category |
n (%) / Mean ± SD |
|
Type of RVO |
BRVO |
47 (58.8) |
|
CRVO |
28 (35.0) |
|
|
HRVO |
5 (6.3) |
|
|
Baseline BCVA (logMAR) |
Mean ± SD |
0.78 ± 0.31 |
|
Baseline CMT (µm) |
Mean ± SD |
512.6 ± 118.4 |
|
Intraretinal fluid |
Present |
69 (86.3) |
|
Subretinal fluid |
Present |
35 (43.8) |
|
DRIL |
Present |
29 (36.3) |
|
Ellipsoid-zone disruption |
Present |
25 (31.3) |
|
ELM disruption |
Present |
21 (26.3) |
|
Hyperreflective foci |
Present |
33 (41.3) |
|
Retinal/macular ischaemia |
Present |
19 (23.8) |
Table 3. Changes in Visual Acuity and Central Macular Thickness Following Anti-VEGF Therapy
|
Outcome |
Baseline |
1 month |
3 months |
6 months |
p-value |
|
BCVA (logMAR), mean ± SD |
0.78 ± 0.31 |
0.61 ± 0.29 |
0.49 ± 0.27 |
0.42 ± 0.26 |
<0.001 |
|
CMT (µm), mean ± SD |
512.6 ± 118.4 |
394.8 ± 104.7 |
326.5 ± 89.6 |
291.7 ± 76.8 |
<0.001 |
|
Eyes with intraretinal fluid, n (%) |
69 (86.3) |
43 (53.8) |
25 (31.3) |
15 (18.8) |
<0.001 |
|
Eyes with subretinal fluid, n (%) |
35 (43.8) |
20 (25.0) |
11 (13.8) |
6 (7.5) |
<0.001 |
Table 4. Association of Baseline OCT Characteristics With Visual Outcome at 6 Months
|
Baseline OCT parameter |
n |
Final BCVA (logMAR), Mean ± SD |
p-value |
|
DRIL present |
29 |
0.61 ± 0.27 |
<0.001 |
|
DRIL absent |
51 |
0.31 ± 0.20 |
|
|
Ellipsoid-zone disruption present |
25 |
0.66 ± 0.28 |
<0.001 |
|
Ellipsoid-zone disruption absent |
55 |
0.31 ± 0.19 |
|
|
ELM disruption present |
21 |
0.68 ± 0.29 |
<0.001 |
|
ELM disruption absent |
59 |
0.33 ± 0.21 |
|
|
Subretinal fluid present |
35 |
0.46 ± 0.27 |
0.226 |
|
Subretinal fluid absent |
45 |
0.39 ± 0.25 |
|
|
Hyperreflective foci present |
33 |
0.52 ± 0.28 |
0.006 |
|
Hyperreflective foci absent |
47 |
0.35 ± 0.22 |
|
|
Retinal/macular ischaemia present |
19 |
0.69 ± 0.29 |
<0.001 |
|
Retinal/macular ischaemia absent |
61 |
0.34 ± 0.21 |
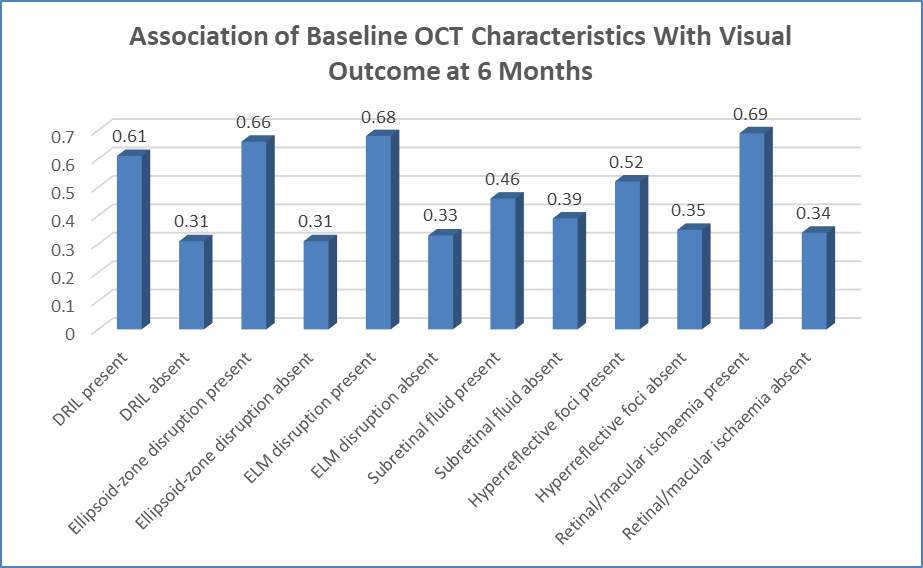
Figure 1 Association of Baseline OCT Characteristics With Visual Outcome at 6 Months
Table 5. Correlation of Baseline Clinical Parameters With Final Visual Outcome
|
Predictor |
Correlation with final BCVA (ρ/r) |
p-value |
Interpretation |
|
Age |
+0.28 |
0.012 |
Weak positive |
|
Duration of symptoms |
+0.41 |
<0.001 |
Moderate positive |
|
Baseline BCVA (logMAR) |
+0.62 |
<0.001 |
Strong positive |
|
Baseline CMT |
+0.29 |
0.009 |
Weak positive |
|
Number of anti-VEGF injections |
−0.25 |
0.026 |
Weak negative |
|
Reduction in CMT |
−0.39 |
<0.001 |
Moderate negative |
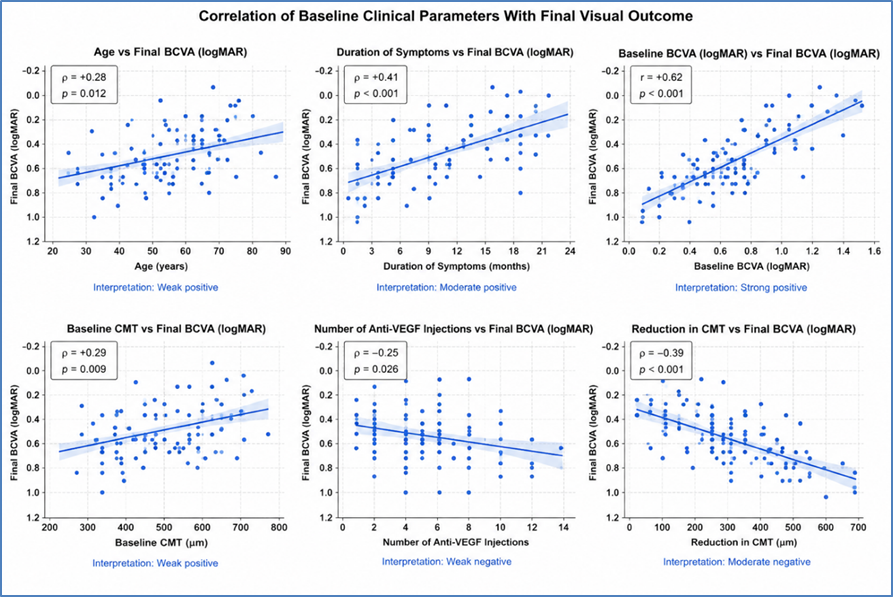
Figure 2 Correlation of Baseline Clinical Parameters With Final Visual Outcome
Table 6. Multivariable Analysis of Predictors of Poor Visual Outcome Following Anti-VEGF Therapy
|
Predictor |
Adjusted OR |
95% CI |
p-value |
|
Poor baseline BCVA |
3.42 |
1.48–7.91 |
0.004 |
|
Symptom duration >6 weeks |
2.67 |
1.13–6.31 |
0.025 |
|
CRVO |
2.18 |
0.94–5.06 |
0.069 |
|
DRIL present |
3.11 |
1.29–7.50 |
0.011 |
|
Ellipsoid-zone disruption |
4.26 |
1.68–10.81 |
0.002 |
|
Retinal/macular ischaemia |
4.73 |
1.71–13.08 |
0.003 |
|
Hypertension |
1.39 |
0.58–3.34 |
0.462 |
|
Diabetes mellitus |
1.52 |
0.62–3.75 |
0.359 |
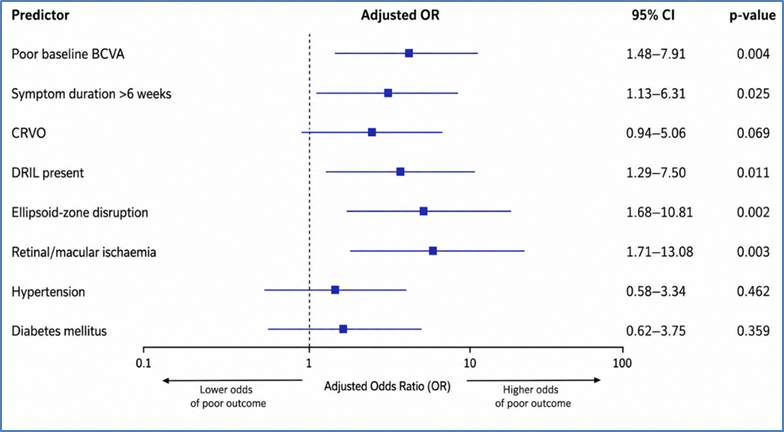
Figure 3 Multivariable Analysis of Predictors of Poor Visual Outcome Following Anti-VEGF Therapy
DISCUSSION:
The present prospective study evaluated the visual and anatomical response to intravitreal anti-VEGF therapy and predictors of visual outcome among 80 patients with retinal vein occlusion (RVO). Significant functional and anatomical improvement was observed over 6 months, with mean BCVA improving from 0.78 ± 0.31 to 0.42 ± 0.26 logMAR and mean CMT decreasing from 512.6 ± 118.4 to 291.7 ± 76.8 µm (p<0.001). These findings confirm the effectiveness of anti-VEGF therapy for RVO-associated macular oedema while demonstrating that final visual recovery is strongly influenced by baseline retinal status.
The mean age was 61.8 ± 10.4 years, with 38.8% of patients aged 60–69 years and 56.3% being male. Hypertension was the commonest systemic comorbidity (58.8%). Chan et al.[14] similarly reported RVO predominantly among older individuals, although their CRVO cohort had a higher mean age of 70.7 ± 10.3 years. BRVO was the commonest RVO subtype in the present study (58.8%), followed by CRVO (35.0%) and HRVO (6.3%).
Anti-VEGF therapy produced progressive improvement in both BCVA and CMT. Intraretinal fluid decreased from 86.3% to 18.8%, while subretinal fluid decreased from 43.8% to 7.5%. However, baseline subretinal fluid was not significantly associated with final BCVA (p=0.226), indicating that structural retinal integrity may be more important for visual prognosis than fluid alone.
Baseline BCVA was strongly correlated with final BCVA (r/ρ=+0.62, p<0.001) and independently predicted poor visual outcome (AOR 3.42, 95% CI 1.48–7.91). Sen et al.[15], analysing 267 patients from the LEAVO study, similarly identified baseline visual acuity, age and subfoveal ellipsoid-zone (EZ) integrity as important determinants of long-term visual outcome. Longer symptom duration was also adverse in our study; presentation after >6 weeks increased the odds of poor outcome (AOR 2.67, p=0.025), supporting early initiation of treatment.
OCT biomarkers were particularly important. DRIL was present in 36.3% of patients and was associated with poorer final BCVA (0.61 vs 0.31 logMAR; p<0.001) and independently predicted poor outcome (AOR 3.11). Mimouni et al.[16] similarly demonstrated that baseline DRIL and changes in DRIL were significantly associated with visual outcomes following anti-VEGF treatment.
EZ disruption was another powerful predictor. Patients with EZ disruption had significantly poorer final BCVA (0.66 vs 0.31 logMAR; p<0.001) and more than fourfold higher odds of poor outcome (AOR 4.26). Chan et al.[14] demonstrated that increasing EZ disruption predicted worsening visual acuity, while Sen et al.[15] also identified intact subfoveal EZ as a predictor of favourable long-term vision. ELM disruption was likewise associated with significantly poorer final BCVA (0.68 vs 0.33 logMAR; p<0.001).
Retinal/macular ischaemia emerged as the strongest independent adverse predictor, with affected patients having poorer final BCVA (0.69 vs 0.34 logMAR) and an AOR of 4.73 (95% CI 1.71–13.08; p=0.003). In contrast, baseline CMT showed only a weak correlation with final BCVA, suggesting that anatomical resolution of oedema does not necessarily translate into complete functional recovery when irreversible retinal damage exists.
Overall, anti-VEGF therapy resulted in substantial anatomical and visual improvement in RVO. However, retinal/macular ischaemia, EZ disruption, poor baseline BCVA, DRIL and delayed presentation were the principal predictors of poor outcome. These findings, consistent with Chan et al.[14], Sen et al.[15] and Mimouni et al.[16], emphasize the importance of early treatment, detailed baseline OCT assessment, evaluation of retinal perfusion and individualized prognostic counselling in patients with RVO-associated macular oedema.
CONCLUSION:
Intravitreal anti-VEGF therapy resulted in significant improvement in visual acuity and reduction in central macular thickness in patients with retinal vein occlusion. Visual outcome was influenced by baseline functional and structural retinal characteristics. Poor baseline BCVA, prolonged symptom duration, DRIL, ellipsoid-zone disruption, and retinal/macular ischaemia were important predictors of poor visual recovery. Early treatment and careful assessment of OCT biomarkers may therefore help improve prognostication, patient counselling, and individualized management.
REFERENCES:
1. Laouri M, Chen E, Looman M, Gallagher M. The burden of disease of retinal vein occlusion: review of the literature. Eye (Lond). 2011;25(8):981-988.
2. Kalva P, Akram R, Zuberi HZ, Kooner KS. Prevalence and risk factors of retinal vein occlusion in the United States: the National Health and Nutrition Examination Survey, 2005 to 2008. Proc (Bayl Univ Med Cent). 2023;36:335-340.
3. Song P, Xu Y, Zha M, Zhang Y, Rudan I. Global epidemiology of retinal vein occlusion: a systematic review and meta-analysis of prevalence, incidence, and risk factors. J Glob Health. 2019;9(1):010427.
4. Romano F, Lamanna F, Gabrielle PH, Teo K, Battaglia Parodi M, Iacono P, et al. Update on retinal vein occlusion. Asia Pac J Ophthalmol. 2023;12:196-210.
5. Gong H, Rehman F, Ma Y, A B, Zeng S, Yang T, et al. A review of intraocular biomolecules in retinal vein occlusion: toward potential biomarkers for companion diagnostics. Front Pharmacol. 2022;13:802936.
6. Nicholson L, Talks SJ, Amoaku W, Talks K, Sivaprasad S. Retinal vein occlusion (RVO) guideline: executive summary. Eye (Lond). 2022;36:909-912.
7. Modi YS, Klufas MA, Sridhar J, Singh RP, Yonekawa Y, Pecen P, et al. Current best clinical practices-management of retinal vein occlusion. J Vitreoretin Dis. 2020;4:214-219.
8. Hayreh SS. Photocoagulation for retinal vein occlusion. Prog Retin Eye Res. 2021;85:100964.
9. Rehak M, Wiedemann P. Retinal vein thrombosis: pathogenesis and management. J Thromb Haemost. 2010;8:1886-1894.
10. Wecker T, Ehlken C, Bühler A, Lange C, Agostini H, Böhringer D, et al. Five-year visual acuity outcomes and injection patterns in patients with pro-re-nata treatments for AMD, DME, RVO and myopic CNV. Br J Ophthalmol. 2017;101:353-359.
11. Sivaprasad S, Oyetunde S. Impact of injection therapy on retinal patients with diabetic macular edema or retinal vein occlusion. Clin Ophthalmol. 2016;10:939-946.
12. Jumper JM, Dugel PU, Chen S, Blinder KJ, Walt JG. Anti-VEGF treatment of macular edema associated with retinal vein occlusion: patterns of use and effectiveness in clinical practice (ECHO study report 2). Clin Ophthalmol. 2018;12:621-629.
13. Vaz-Pereira S, Marques IP, Matias J, Mira F, Ribeiro L, Flores R, et al. Real-world outcomes of anti-VEGF treatment for retinal vein occlusion in Portugal. Eur J Ophthalmol. 2017;27:756-761.
14. Chan SY, Fung AT, Shah V. Disorganization of retinal inner layers and ellipsoid zone disruption predict visual outcomes in central retinal vein occlusion. Ophthalmol Retina. 2018;2(12):1165-1171.
15. Sen P, Gurudas S, Ramu J, Patrao N, Chandra S, Rasheed R, et al. Predictors of visual acuity outcomes after anti-vascular endothelial growth factor treatment for macular edema secondary to central retinal vein occlusion. Ophthalmol Retina. 2021;5(11):1115-1124.
16. Mimouni M, Segev O, Dori D, Geffen N, Flores V, Segal O, et al. Disorganization of the retinal inner layers as a predictor of visual acuity in eyes with macular edema secondary to vein occlusion. Am J Ophthalmol. 2017;182:160-167.