Assessment of Serum Biomarkers and Their Association with Severity of Diabetic Retinopathy: A Prospective Study
- Ranjitha , Senior Resident, Department of Ophthalmology, Alva’s Institute of Medical Sciences, Moodbidri
- Vidyashri M , Private practice, Department of Ophthalmolog, Shankarappagouda hospital, Yadgir
- B. Karishma Munoli , Associate Professor, Department of Ophthalmology, RIMS, Raichur
Article Information:
Abstract:
Background: Diabetic retinopathy (DR) is a major microvascular complication of diabetes mellitus in which chronic hyperglycaemia, oxidative stress, and systemic inflammation contribute to progressive retinal vascular damage. Circulating inflammatory biomarkers may provide a simple and accessible means of assessing disease severity. Objective: To assess selected serum biomarkers and determine their association with the severity of diabetic retinopathy. Materials and Methods: This prospective observational study included 90 patients with diabetic retinopathy. Participants were categorized as having mild non-proliferative diabetic retinopathy (NPDR), moderate NPDR, severe NPDR, or proliferative diabetic retinopathy (PDR). Serum C-reactive protein (CRP), albumin, CRP-to-albumin ratio (CAR), and HbA1c were evaluated and compared across DR severity groups. Correlation and multivariable logistic regression analyses were performed. Results: Mild, moderate, and severe NPDR and PDR were present in 23.3%, 31.1%, 25.6%, and 20.0% of patients, respectively. Mean CRP increased progressively from 3.2 ± 1.4 mg/L in mild NPDR to 8.1 ± 2.7 mg/L in PDR, whereas albumin decreased from 4.28 ± 0.38 to 3.48 ± 0.47 g/dL (both p<0.001). CAR increased from 0.075 ± 0.034 to 0.237 ± 0.091 (p<0.001) and demonstrated the strongest correlation with DR severity (ρ=0.66, p<0.001). Elevated CAR independently predicted severe DR (AOR 3.68; 95% CI 1.48–9.15; p=0.005). Conclusion: Increasing systemic inflammatory burden was significantly associated with advancing DR. CAR showed the strongest association with disease severity and may serve as a simple adjunctive biomarker for identifying patients at increased risk of severe diabetic retinopathy.
Keywords:
Article :
INTRODUCTION:
Diabetes mellitus (DM) is a chronic metabolic disorder characterized by persistent hyperglycaemia and represents a major global health problem. Prolonged exposure to elevated blood glucose results in progressive vascular injury and contributes to several microvascular and macrovascular complications. Among the microvascular complications, diabetic retinopathy (DR) is particularly important because it remains a major cause of preventable visual impairment and blindness, especially among individuals with longstanding diabetes.[1,2] Despite improvements in glycaemic control and screening strategies, DR continues to impose a substantial clinical and socioeconomic burden.
The pathogenesis of DR is complex and extends beyond retinal microvascular damage alone. Chronic hyperglycaemia activates multiple metabolic pathways leading to oxidative stress, chronic low-grade inflammation, endothelial dysfunction, leukocyte adhesion, breakdown of the blood–retinal barrier, capillary occlusion, retinal ischaemia, and pathological angiogenesis.[3,4] Clinically, DR progresses from non-proliferative diabetic retinopathy (NPDR) of varying severity to proliferative diabetic retinopathy (PDR), while diabetic macular oedema may occur at different stages. Accurate assessment of disease severity is therefore essential for identifying patients at risk of progression and initiating timely treatment to prevent irreversible visual loss.[5]
Increasing recognition of the systemic inflammatory component of DR has generated interest in circulating serum biomarkers as potential indicators of disease activity and severity. Serum biomarkers are particularly attractive because they are relatively inexpensive, minimally invasive, repeatable, and readily available in routine clinical practice. Among these, C-reactive protein (CRP) is an established marker of systemic inflammation and may reflect the chronic inflammatory state associated with diabetic microvascular injury.[6,7] Serum albumin, in contrast, may decrease in the presence of persistent systemic inflammation and has also been associated with nutritional and physiological status.
Combining CRP and albumin as the CRP-to-albumin ratio (CAR) may provide a more comprehensive measure of systemic inflammatory burden than either biomarker considered independently.[8,9] Other metabolic, inflammatory, angiogenic, and oxidative-stress biomarkers have similarly been investigated in DR. However, previous studies examining the relationship between circulating inflammatory biomarkers and DR have produced inconsistent results, possibly because of differences in patient characteristics, glycaemic control, duration of diabetes, associated comorbidities, laboratory methods, and retinopathy severity.[10–13]
Furthermore, prospective evidence evaluating multiple serum biomarkers across different stages of DR remains limited. Establishing an association between readily measurable serum biomarkers and retinopathy severity could complement conventional ophthalmological assessment and potentially facilitate risk stratification, identification of patients at greater risk of progression, and monitoring of disease activity.
Therefore, the present prospective study, “Assessment of Serum Biomarkers and Their Association with Severity of Diabetic Retinopathy,” was undertaken to evaluate selected serum biomarkers, with particular emphasis on CRP, serum albumin, and CAR, and to determine their association with different grades of DR. The study aims to explore their potential usefulness as accessible indicators of disease severity and thereby contribute to a better understanding of the systemic inflammatory component of diabetic retinopathy.
MATERIALS AND METHODS:
Study Design and Setting
This prospective observational study was conducted in the Department of Ophthalmology at a tertiary care teaching hospital. A total of 90 patients with diabetes mellitus and diabetic retinopathy (DR) who attended the ophthalmology outpatient department during the study period were enrolled. Patients fulfilling the predefined eligibility criteria were included consecutively until the required sample size of 90 was achieved.
Inclusion Criteria
Patients aged ≥18 years with a confirmed diagnosis of diabetes mellitus and clinically diagnosed diabetic retinopathy were included. Patients with different grades of non-proliferative diabetic retinopathy (NPDR) and proliferative diabetic retinopathy (PDR) were eligible. Only patients who provided written informed consent and underwent the required ophthalmological and biochemical investigations were included.
Exclusion Criteria
Patients with active systemic infection, acute inflammatory disease, autoimmune disorders, malignancy, chronic liver disease, or other conditions likely to substantially alter the inflammatory biomarkers were excluded. Patients receiving systemic corticosteroids, immunosuppressive therapy, or other medications known to markedly influence inflammatory parameters were also excluded. Patients with significant ocular disorders other than diabetic retinopathy that could interfere with retinal assessment were excluded.
Data Collection and Clinical Assessment
After enrolment, detailed demographic and clinical information was recorded using a structured proforma. Data included age, sex, duration and type of diabetes, treatment received for diabetes, history of hypertension, dyslipidaemia, smoking, and other relevant systemic comorbidities. Available information regarding glycaemic control and previous ocular treatment was also documented.
Ophthalmological Examination
All participants underwent a comprehensive ophthalmological examination. Best-corrected visual acuity was assessed, followed by anterior-segment examination using slit-lamp biomicroscopy. Intraocular pressure was measured, and the posterior segment was evaluated after adequate pupillary dilatation using indirect ophthalmoscopy and slit-lamp biomicroscopy with an appropriate fundus lens.
Fundus photography and optical coherence tomography (OCT) were performed whenever clinically indicated to document retinal abnormalities and assess diabetic macular oedema. Additional retinal investigations were performed when required as part of routine clinical evaluation.
Classification of Diabetic Retinopathy
Diabetic retinopathy was graded according to established clinical criteria based on retinal findings. Patients were categorized according to the severity of retinopathy as having mild NPDR, moderate NPDR, severe NPDR, or PDR. The presence of diabetic macular oedema was additionally documented where applicable. For patients with bilateral involvement of different severity, the eye with the more advanced grade of DR was considered for patient-level severity analysis.
Blood Sampling and Laboratory Evaluation
Venous blood samples were collected from all participants under standard aseptic precautions. Samples were appropriately processed and analysed in the institutional laboratory using standardized laboratory procedures.
The biochemical assessment included serum C-reactive protein (CRP) and serum albumin. Glycaemic parameters, including fasting blood glucose and glycated haemoglobin (HbA1c), were recorded wherever available as part of the metabolic assessment. Other relevant routine biochemical parameters were documented according to the study protocol.
Calculation of CRP-to-Albumin Ratio
The CRP-to-albumin ratio (CAR) was calculated from the measured serum CRP and albumin concentrations using the following formula:
CAR = Serum CRP / Serum albumin
The calculated CAR was recorded for each participant and subsequently compared across different grades of diabetic retinopathy.
Assessment of Association Between Biomarkers and DR Severity
Serum CRP, albumin, CAR, HbA1c, and other selected biochemical parameters were evaluated according to the severity of diabetic retinopathy. Biomarker levels were compared among patients with different grades of NPDR and PDR to determine whether progressive changes occurred with increasing disease severity. Correlation analyses were additionally performed to assess the relationship between selected serum biomarkers and DR severity.
Outcome Measures
The primary outcome was the association of serum biomarker levels, particularly CRP, serum albumin, and CAR, with the severity of diabetic retinopathy.
Secondary outcomes included the relationship of DR severity with glycaemic control and relevant clinical characteristics and the identification of serum biomarkers independently associated with more severe diabetic retinopathy.
Statistical Analysis
Data were entered into a computerized database and analysed using SPSS .21. Continuous variables were expressed as mean ± standard deviation (SD) or median with interquartile range, depending on the distribution of data. Categorical variables were presented as frequencies and percentages.Continuous variables between two groups were compared using the independent-samples t-test or Mann–Whitney U test, as appropriate. Comparisons involving more than two grades of diabetic retinopathy were performed using one-way analysis of variance (ANOVA) or the Kruskal–Wallis test. Categorical variables were compared using the Chi-square test or Fisher's exact test. Pearson or Spearman correlation analysis was performed to determine the relationship between serum biomarkers and clinical parameters. Multivariable logistic regression analysis was performed, where appropriate, to identify independent predictors of severe diabetic retinopathy. Results were reported as odds ratios with 95% confidence intervals. A p-value <0.05 was considered statistically significant.
RESULTS:
A total of 90 patients with diabetic retinopathy were included in the study. The mean age of the study participants was 58.7 ± 9.6 years, with the largest proportion belonging to the 60–69-year age group (35.6%), followed by 50–59 years (32.2%). Males constituted 56.7% of the study population. The mean duration of diabetes was 12.8 ± 6.1 years, and nearly half of the patients (47.8%) had diabetes for 10–19 years. Hypertension was present in 54.4%, dyslipidaemia in 34.4%, and a current or past history of smoking in 22.2% of participants (Table 1).The distribution of patients according to diabetic retinopathy severity showed that moderate NPDR was the most common stage (31.1%), followed by severe NPDR (25.6%), mild NPDR (23.3%), and PDR (20.0%). Thus, 45.6% of the participants had either severe NPDR or PDR (Table 2 and Figure 1).
Serum biomarker levels demonstrated significant differences across increasing grades of diabetic retinopathy. Mean CRP increased progressively from 3.2 ± 1.4 mg/L in mild NPDR to 8.1 ± 2.7 mg/L in PDR (p<0.001). In contrast, serum albumin progressively decreased from 4.28 ± 0.38 g/dL to 3.48 ± 0.47 g/dL (p<0.001). The CRP-to-albumin ratio increased from 0.075 ± 0.034 in mild NPDR to 0.237 ± 0.091 in PDR (p<0.001). HbA1c also increased significantly with DR severity, from 7.4 ± 0.9% to 9.2 ± 1.3% (p<0.001) (Table 3).
Clinical characteristics also varied according to the severity of DR. Mean age increased from 54.8 ± 8.9 years in mild NPDR to 63.1 ± 8.7 years in PDR (p=0.018). Similarly, the mean duration of diabetes increased significantly from 8.4 ± 4.2 years to 18.1 ± 6.2 years (p<0.001). The prevalence of hypertension increased from 33.3% in mild NPDR to 72.2% in PDR (p=0.044). Dyslipidaemia showed an increasing trend with severity but did not reach statistical significance (p=0.093). HbA1c was significantly higher among patients with more advanced DR (p<0.001) (Table 4).
Correlation analysis demonstrated significant relationships between several serum and clinical parameters and DR severity. The CRP-to-albumin ratio showed the strongest positive correlation with DR severity (ρ=+0.66, p<0.001), followed by CRP (ρ=+0.61, p<0.001) and duration of diabetes (ρ=+0.55, p<0.001). Serum albumin demonstrated a significant negative correlation (ρ=−0.52, p<0.001), whereas HbA1c showed a moderate positive correlation (ρ=+0.49, p<0.001). Age demonstrated a weaker but statistically significant positive correlation (ρ=+0.27, p=0.010) (Table 5 and Figure 2).
On multivariable logistic regression analysis, an elevated CRP-to-albumin ratio emerged as the strongest independent factor associated with severe diabetic retinopathy (adjusted OR 3.68, 95% CI 1.48–9.15; p=0.005). Duration of diabetes ≥10 years (AOR 2.74; p=0.027), HbA1c ≥8.0% (AOR 2.58; p=0.033), and elevated CRP (AOR 2.41; p=0.041) were also independently associated with severe DR. Low serum albumin (p=0.081) and hypertension (p=0.170) did not retain statistical significance after adjustment (Table 6 and Figure 3).
Table 1. Demographic and Clinical Characteristics of Study Participants (n=90)
|
Variable |
Category |
n (%) / Mean ± SD |
|
Age (years) |
Mean ± SD |
58.7 ± 9.6 |
|
Age group |
<50 years |
15 (16.7) |
|
50–59 years |
29 (32.2) |
|
|
60–69 years |
32 (35.6) |
|
|
≥70 years |
14 (15.6) |
|
|
Sex |
Male |
51 (56.7) |
|
Female |
39 (43.3) |
|
|
Duration of diabetes (years) |
Mean ± SD |
12.8 ± 6.1 |
|
Duration of diabetes |
<10 years |
28 (31.1) |
|
10–19 years |
43 (47.8) |
|
|
≥20 years |
19 (21.1) |
|
|
Hypertension |
Present |
49 (54.4) |
|
Dyslipidaemia |
Present |
31 (34.4) |
|
Current/past smoking |
Present |
20 (22.2) |
Table 2. Distribution of Patients According to Severity of Diabetic Retinopathy (n=90)
|
Severity of diabetic retinopathy |
n |
Percentage (%) |
|
Mild NPDR |
21 |
23.3 |
|
Moderate NPDR |
28 |
31.1 |
|
Severe NPDR |
23 |
25.6 |
|
PDR |
18 |
20.0 |
|
Total |
90 |
100.0 |
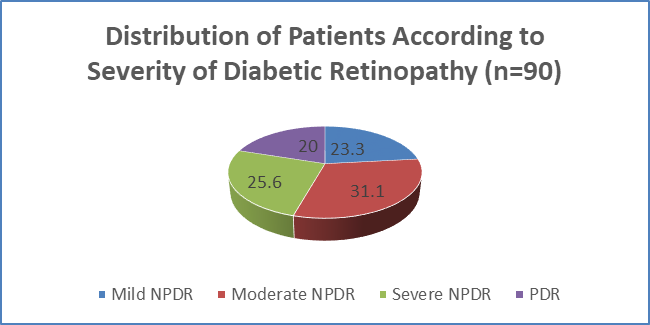
Figure 1 Distribution of Patients According to Severity of Diabetic Retinopathy (n=90)
Table 3. Serum Biomarkers According to Severity of Diabetic Retinopathy
|
Biomarker |
Mild NPDR (n=21) |
Moderate NPDR (n=28) |
Severe NPDR (n=23) |
PDR (n=18) |
p-value |
|
CRP (mg/L) |
3.2 ± 1.4 |
4.5 ± 1.8 |
6.3 ± 2.2 |
8.1 ± 2.7 |
<0.001 |
|
Serum albumin (g/dL) |
4.28 ± 0.38 |
4.05 ± 0.41 |
3.76 ± 0.45 |
3.48 ± 0.47 |
<0.001 |
|
CRP/albumin ratio |
0.075 ± 0.034 |
0.112 ± 0.049 |
0.170 ± 0.067 |
0.237 ± 0.091 |
<0.001 |
|
HbA1c (%) |
7.4 ± 0.9 |
8.0 ± 1.1 |
8.6 ± 1.2 |
9.2 ± 1.3 |
<0.001 |
Table 4. Association of Clinical Characteristics With Severity of Diabetic Retinopathy
|
Variable |
Mild NPDR (n=21) |
Moderate NPDR (n=28) |
Severe NPDR (n=23) |
PDR (n=18) |
p-value |
|
Age (years), mean ± SD |
54.8 ± 8.9 |
57.1 ± 9.2 |
60.3 ± 9.4 |
63.1 ± 8.7 |
0.018 |
|
Duration of diabetes (years), mean ± SD |
8.4 ± 4.2 |
11.3 ± 4.8 |
14.7 ± 5.6 |
18.1 ± 6.2 |
<0.001 |
|
Hypertension, n (%) |
7 (33.3) |
14 (50.0) |
15 (65.2) |
13 (72.2) |
0.044 |
|
Dyslipidaemia, n (%) |
4 (19.0) |
8 (28.6) |
10 (43.5) |
9 (50.0) |
0.093 |
|
HbA1c (%), mean ± SD |
7.4 ± 0.9 |
8.0 ± 1.1 |
8.6 ± 1.2 |
9.2 ± 1.3 |
<0.001 |
Table 5. Correlation of Serum Biomarkers and Clinical Parameters With Severity of Diabetic Retinopathy
|
Parameter |
Spearman's ρ |
p-value |
Interpretation |
|
CRP |
+0.61 |
<0.001 |
Strong positive |
|
Serum albumin |
−0.52 |
<0.001 |
Moderate negative |
|
CRP-to-albumin ratio |
+0.66 |
<0.001 |
Strong positive |
|
HbA1c |
+0.49 |
<0.001 |
Moderate positive |
|
Duration of diabetes |
+0.55 |
<0.001 |
Moderate positive |
|
Age |
+0.27 |
0.010 |
Weak positive |
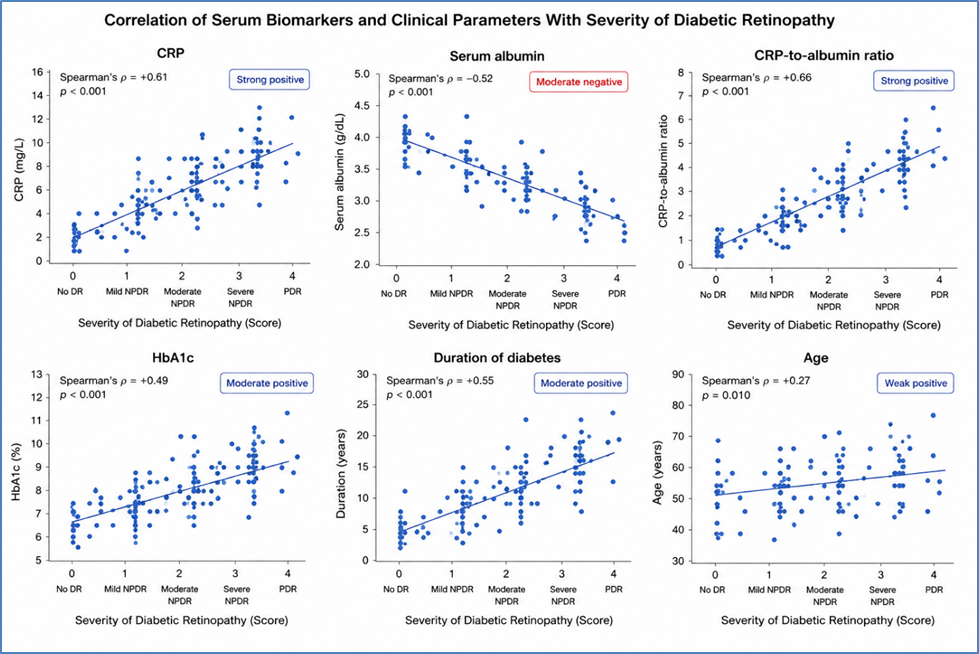
Figure 2 Correlation of Serum Biomarkers and Clinical Parameters With Severity of Diabetic Retinopathy
Table 6. Multivariable Logistic Regression Analysis of Factors Associated With Severe Diabetic Retinopathy
|
Predictor |
Adjusted OR |
95% CI |
p-value |
|
Duration of diabetes ≥10 years |
2.74 |
1.12–6.71 |
0.027 |
|
HbA1c ≥8.0% |
2.58 |
1.08–6.17 |
0.033 |
|
Elevated CRP |
2.41 |
1.04–5.60 |
0.041 |
|
Low serum albumin |
2.16 |
0.91–5.14 |
0.081 |
|
Elevated CRP-to-albumin ratio |
3.68 |
1.48–9.15 |
0.005 |
|
Hypertension |
1.84 |
0.77–4.41 |
0.170 |
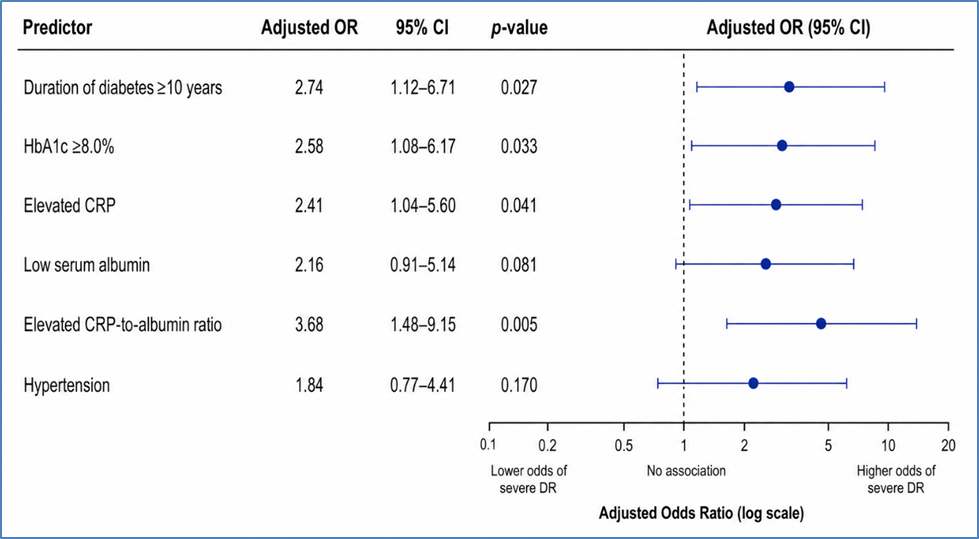
Figure 3 Multivariable Logistic Regression Analysis of Factors Associated With Severe Diabetic Retinopathy
DISCUSSION:
In the present study, systemic inflammatory markers showed a significant association with increasing severity of diabetic retinopathy (DR). Serum CRP increased progressively from 3.2 ± 1.4 mg/L in mild NPDR to 4.5 ± 1.8 mg/L in moderate NPDR, 6.3 ± 2.2 mg/L in severe NPDR, and 8.1 ± 2.7 mg/L in PDR (p<0.001), with a strong positive correlation with DR severity (ρ=0.61, p<0.001). These findings are consistent with recent evidence showing that each 1 mg/L increase in hs-CRP was associated with 1.40-fold higher odds of DR. Kılıç et al. (2025)[14] similarly reported elevated CRP (5.8 ± 3.2 mg/L) in DR patients, which decreased significantly after treatment to 1.5 ± 1.4 mg/L (p<0.001), supporting the role of systemic inflammation in DR.Conversely, serum albumin decreased significantly with advancing DR, from 4.28 ± 0.38 g/dL in mild NPDR to 4.05 ± 0.41 g/dL in moderate NPDR, 3.76 ± 0.45 g/dL in severe NPDR, and 3.48 ± 0.47 g/dL in PDR (p<0.001), and showed a moderate negative correlation with severity (ρ=−0.52, p<0.001). Iwasaki et al. (2008)[15], in 130 patients with type 2 diabetes, similarly demonstrated that lower serum albumin was significantly associated with increasing retinopathy severity and remained independently associated with proliferative retinopathy. Li et al. (2024)[16] also reported an inverse association between serum albumin and DR.
The CRP-to-albumin ratio (CAR) emerged as the strongest biomarker in our study. Mean CAR increased progressively from 0.075 ± 0.034 in mild NPDR to 0.112 ± 0.049 in moderate NPDR, 0.170 ± 0.067 in severe NPDR, and 0.237 ± 0.091 in PDR (p<0.001), showing the strongest correlation with DR severity (ρ=0.66, p<0.001). Kılıç et al. (2025)[14] similarly reported a pretreatment CAR of 0.14 ± 0.10, which decreased to 0.04 ± 0.04 after treatment, and demonstrated excellent diagnostic performance (AUC 0.963, sensitivity 95%, specificity 90%). These findings suggest that CAR may better represent the combined inflammatory and nutritional burden than either CRP or albumin alone.
Poor glycaemic control and longer diabetes duration were also significantly associated with advanced DR. Mean HbA1c increased from 7.4 ± 0.9% to 9.2 ± 1.3% across mild NPDR to PDR (p<0.001) and correlated positively with severity (ρ=0.49). Similarly, diabetes duration increased from 8.4 ± 4.2 to 18.1 ± 6.2 years and showed a moderate positive correlation (ρ=0.55, p<0.001). These observations are supported by Li et al. (2024)[16] and recent evidence demonstrating independent associations of HbA1c and diabetes duration with DR.
Overall, CAR demonstrated the strongest correlation with DR severity (ρ=0.66), followed by CRP (ρ=0.61), diabetes duration (ρ=0.55), albumin (ρ=−0.52), and HbA1c (ρ=0.49). On multivariable analysis, elevated CAR was the strongest independent factor associated with severe DR (AOR 3.68; 95% CI 1.48–9.15; p=0.005), followed by diabetes duration ≥10 years (AOR 2.74), HbA1c ≥8% (AOR 2.58), and elevated CRP (AOR 2.41). These findings, together with those of Kılıç et al. [14], Iwasaki et al. [15], and Li et al. [16], suggest that combined assessment of inflammatory, nutritional, and metabolic parameters, particularly CAR, may help identify patients at greater risk of advanced DR.
CONCLUSION:
The present study demonstrated a significant association between systemic inflammatory biomarkers and the severity of diabetic retinopathy. CRP and the CRP-to-albumin ratio increased progressively, whereas serum albumin decreased with advancing DR severity. Among the evaluated biomarkers, CAR showed the strongest correlation with DR severity and emerged as the strongest independent predictor of severe DR. Longer duration of diabetes and poor glycaemic control were also important predictors of advanced disease. These findings suggest that CAR may serve as a simple, inexpensive adjunctive biomarker for risk stratification and assessment of DR severity.
REFERENCES:
1. Refardt J, Winzeler B, Christ-Crain M. Diabetes insipidus: an update. Endocrinol Metab Clin North Am. 2020;49(3):517-531.
2. Entezari M, Hashemi D, Taheriazam A, Zabolian A, Mohammadi S, Fakhri F, et al. AMPK signaling in diabetes mellitus, insulin resistance and diabetic complications: a pre-clinical and clinical investigation. Biomed Pharmacother. 2022;146:112563.
3. Halim M, Halim A. The effects of inflammation, aging and oxidative stress on the pathogenesis of diabetes mellitus (type 2 diabetes). Diabetes Metab Syndr. 2019;13:1165-1172.
4. Kour V, Swain J, Singh J, Singh H, Kour H. A review on diabetic retinopathy. Curr Diabetes Rev. 2024;20(6):e201023222418.
5. Sorour OA, Levine ES, Baumal CR, Elnahry AG, Braun P, Girgis J, et al. Persistent diabetic macular edema: definition, incidence, biomarkers, and treatment methods. Surv Ophthalmol. 2023;68:147-174.
6. Khaloo P, Qahremani R, Rabizadeh S, Omidi M, Rajab A, Heidari F, et al. Nitric oxide and TNF-α are correlates of diabetic retinopathy independent of hs-CRP and HbA1c. Endocrine. 2020;69:536-541.
7. Wei J, Zhang J, Shi Y, Zhang H, Wu Y. Serum VEGF, high-sensitivity CRP, and cystatin-C assist in the diagnosis of type 2 diabetic retinopathy complicated with hyperuricemia. Open Med. 2023;18:20230857.
8. Chenciner L, Symonds M, Dissanayake O, Hunter A, Burns F. Lymphocyte-CRP ratio and CRP-albumin ratio as potential inflammation markers in adults with HIV. J Acquir Immune Defic Syndr. 2022;91:e1-e3.
9. Yuksel ME, Ozkan N, Avci E. C-reactive protein/albumin ratio greater than 7.1 is a good candidate to be used as an inflammation biomarker to predict perforation in appendicitis. Eur Rev Med Pharmacol Sci. 2022;26:8333-8341.
10. Alhalwani AY, Khan MA, Bahadur RY, Almalki HA, Sannan NS. Assessment of globulin levels and albumin-to-globulin ratio in patients with type 2 diabetes and retinopathy: a retrospective single-center study. Open Ophthalmol J. 2023;17:e18743641277168.
11. Yang XF, Deng Y, Gu H, Lim A, Snellingen T, Liu XP, et al. C-reactive protein and diabetic retinopathy in Chinese patients with type 2 diabetes mellitus. Int J Ophthalmol. 2016;9:111-118.
12. Gouliopoulos NS, Kalogeropoulos C, Lavaris A, Rouvas A, Asproudis I, Garmpi A, et al. Association of serum inflammatory markers and diabetic retinopathy: a review of literature. Eur Rev Med Pharmacol Sci. 2018;22:7113-7128.
13. Qiu F, Ma X, Shin YH, Chen J, Chen Q, Zhou K, et al. Pathogenic role of human C-reactive protein in diabetic retinopathy. Clin Sci (Lond). 2020;134:1613-1629.
14. Kılıç Ş, Aydın E, Genç ÇD. Evaluation of C-reactive protein/albumin ratio in diabetic retinopathy patients. Diagnostics (Basel). 2025;15(17):2178.
15. Iwasaki T, Togashi Y, Terauchi Y. Significant association of serum albumin with severity of retinopathy and neuropathy, in addition to that of nephropathy, in Japanese type 2 diabetic patients. Endocr J. 2008;55(2):311-316.
16. Li X, Hao W, Yang N. Inverse association of serum albumin levels with diabetic retinopathy in type 2 diabetic patients: a cross-sectional study. Sci Rep. 2024;14:4016.