Diagnostic Accuracy of Attenuation-Corrected versus Non-Attenuation-Corrected Myocardial Perfusion SPECT-CT Imaging in the Detection of Coronary Artery Disease: Correlation with Coronary Angiography
- Sibu Baby Jacob , Assistant Professor and Head, Department of Nuclear medicine and Molecular Theranostics, Amala Institute of Medical Sciences, Thrissur, Kerala, India
- Anstin Jose , Assistant professor, Department of Radiodiagnosis Amala Institute of Medical sciences, Thrissur, Kerala, India
- Roni George , Assistant Professor, Department of Nuclear medicine and Molecular Theranostics, Amala Institute of Medical Sciences, Thrissur, Kerala, India
Article Information:
Abstract:
Background: Attenuation artifact from soft tissue and diaphragm is a major limitation of single photon emission computed tomography myocardial perfusion imaging (SPECT-MPI), reducing its specificity for coronary artery disease (CAD) detection. Computed tomography (CT)-based attenuation correction (AC) has been proposed to overcome this limitation, but its incremental diagnostic value over non-attenuation-corrected (NAC) imaging remains debated. Objective: To compare AC and NAC myocardial perfusion SPECT-CT images against coronary angiography (CAG) as the gold standard, and to determine whether attenuation correction meaningfully improves image interpretation. Methods: In this prospective comparative observational study, 100 patients referred for gated rest/stress SPECT-MPI (IQ SPECT, hybrid SPECT/CT) who underwent CAG within 3 months were evaluated. AC and NAC images were interpreted using a 17-segment model in three vascular territories (left anterior descending [LAD], left circumflex [LCx], right coronary artery [RCA]). Sensitivity, specificity, positive predictive value (PPV) and negative predictive value (NPV) were calculated against CAG at >50% and >70% luminal stenosis cut-offs. Results: The cohort comprised 80 men and 20 women (mean age 57.4 ± 9.5 years). At the >50% stenosis cut-off, AC showed sensitivity/specificity of 80.7%/83.7% (LAD), 76.5%/93.9% (LCx) and 75.0%/89.6% (RCA), compared with 78.9%/81.4%, 79.4%/86.4% and 80.8%/72.9% for NAC, respectively. Overall sensitivity and specificity were 86.8%/83.3% for AC versus 88.2%/58.3% for NAC. The semiquantitative extent of perfusion defect was smaller with AC than NAC overall (16.6 ± 18.6 vs 18.7 ± 19.1, p = 0.005), a difference that was most pronounced in the RCA territory (p = 0.0001) and absent in the LAD territory (p = 0.671). Conclusion: Attenuation correction increases the specificity of SPECT-MPI, at the cost of a small reduction in sensitivity, improving overall diagnostic accuracy for CAD. Because AC can occasionally overcorrect true perfusion defects, AC and NAC images should be interpreted together, alongside coronary angiographic and clinical findings.
Keywords:
Article :
INTRODUCTION:
Cardiovascular disease is a leading cause of mortality in India, accounting for more than 25% of all deaths, and the burden of ischemic heart disease (IHD) is projected to rise substantially among both men and women.1 Between 1990 and 2020, cardiovascular mortality in developing countries such as India was projected to increase by 120% in women and 137% in men, compared with 30–60% in developed countries.2
Most cardiovascular events arise from modest, cumulative elevations across several risk factors rather than marked elevation of a single factor, and acute myocardial infarction remains the most common cause of hospitalization and death among patients with known IHD, typically resulting from thrombotic occlusion of a coronary artery already narrowed by atherosclerosis.3 Hyperlipidemia, uncontrolled hypertension and diabetes mellitus are now well established contributors to coronary atherosclerosis and ischemic myocardial disease.
Early identification of coronary arterial stenosis and prompt intervention are central to the management and prevention of IHD. While conventional coronary angiography (CAG) has long been the preferred method for diagnosing and grading coronary artery disease (CAD), non-invasive modalities such as myocardial perfusion SPECT-CT (MPI) and CT coronary angiography have gained an increasingly important role. Functional assessment of stenosis severity, including collateral flow and endothelial function, is essential to the management of obstructive epicardial CAD, and anatomic imaging alone often cannot establish the hemodynamic significance of a stenosis.4
MPI with radiolabelled tracers provides this functional information and has been proposed as an entry-level investigation ahead of invasive coronary testing, since revascularization of a non-flow-limiting stenosis offers little prognostic or symptomatic benefit.5 However, the photon counts recorded by SPECT are not always proportional to true myocardial tracer uptake.6-8 Breast, diaphragmatic and thoracic-wall attenuation artifacts produce regional variation in apparent myocardial activity, reducing the specificity of conventional SPECT interpretation and impairing both visual and quantitative analysis.9,10
To address this, the Society of Nuclear Medicine and the American Society of Nuclear Cardiology have recommended attenuation correction (AC) for SPECT-MPI to better distinguish true perfusion defects from artifacts.11 Proposed strategies include ECG-gated acquisition,12 prone-position imaging,13 and use of an external transmission source such as a radionuclide line source or CT.14,15 CT-based AC offers several advantages over radionuclide transmission sources, including a non-decaying source, higher photon flux with reduced cross-talk, and a shorter scan time, and permits simultaneous coronary calcium scoring on hybrid SPECT/CT systems.16-18 Several studies have reported greater diagnostic confidence and accuracy with CT-AC compared with non-corrected or prone-acquisition images.19
Clinical trials over the past decade have generally shown improved diagnostic accuracy, specificity and normalcy rates with AC compared with non-attenuation-corrected (NAC) imaging,6 although overcorrection of attenuation remains a recognized concern, as it can reduce the sensitivity of AC-SPECT relative to NAC imaging.20 Despite the appreciated value of AC in myocardial perfusion assessment, its reliability continues to be debated,21 underscoring the need for further comparative data. We therefore undertook this study to compare AC and NAC myocardial perfusion SPECT-CT images against CAG as the gold standard, and to assess whether attenuation correction produces a genuine, clinically meaningful improvement in image interpretation.
MATERIALS AND METHODS:
Study design and setting
This was a prospective, comparative, observational study conducted in the Department of Nuclear Medicine of a tertiary care hospital between November 2013 and March 2015, following institutional review board approval. No additional radiation exposure was incurred for study purposes, as MPI with 99mTc-sestamibi is an established, institutionally protocolled investigation for cardiac workup.
Study population
One hundred consecutive patients of either sex referred for rest/stress gated SPECT-MPI to assess the presence, extent and severity of CAD and inducible ischemia, and who had undergone or were scheduled to undergo CAG within 3 months of imaging, were enrolled. Patients with prior percutaneous coronary intervention or coronary artery bypass grafting, known CAD, cardiomyopathy, significant valvular disease, left bundle branch block, paced rhythm, or CAG performed outside the 3-month window were excluded, as were those unable to provide informed consent or complete the study protocol.
The sample size was calculated using the formula n = z²pq/d², with z = 1.96 (95% confidence interval), p = 0.07 (assumed difference in sensitivity between NAC and AC, based on prior literature),22 q = 1 − p, and d = 0.05 (allowable clinical error).
Imaging protocol
All patients underwent a 2-day rest/stress gated SPECT-MPI protocol. On day 1, rest images were acquired 45–60 minutes after intravenous injection of 10–15 mCi of 99mTc-sestamibi following 3–4 hours of fasting. On day 2, stress images were acquired using the same protocol after exercise (graded treadmill using Bruce or modified Bruce protocol) or pharmacological stress with adenosine (140 μg/kg/min), with 8–15 mCi of 99mTc-sestamibi injected at peak stress or during adenosine infusion. Data were acquired on a dual-head SPECT/CT gamma camera equipped with IQ SPECT (matrix 128 × 128; smart-zoom collimator; cardio-centric orbit; 17 views per detector; 14 seconds per view; 8 frames per cardiac cycle), synchronized with ECG R-wave gating.
Low-dose CT for attenuation correction was acquired immediately after SPECT (130 kV, 34 effective mAs, pitch 0.6, 5 mm slice thickness). CT Hounsfield units were converted to linear attenuation coefficients at the SPECT photopeak energy using the scaling method, and the resulting attenuation map was smoothed and co-registered with the SPECT emission data before reconstruction of AC images.
Image processing and interpretation
Both AC and NAC datasets were reconstructed using an iterative ordered-subset expectation-maximization algorithm (Flash-3D; 10 iterations, 3 subsets for non-gated, and 12 iterations, 1 subset for gated reconstruction) on a Cedars QGS/QPS workstation. Fused emission-transmission images were visually checked for co-registration accuracy; studies with uncorrectable misregistration were excluded. No scatter correction was applied.
Images were interpreted independently for AC and NAC datasets using a 17-segment left ventricular model, with segments allocated to LAD, LCx or RCA territories. Semiquantitative tracer uptake was graded from 0 (normal) to 4 (absent), and the extent of perfusion defect (EXT) was derived for each territory and for the total left ventricular myocardium. Findings were correlated on a per-vessel basis with CAG, which classified stenosis as 0 (no stenosis), 1 (<50%), 2 (50–70%) or 3 (>70%). Diagnostic performance was assessed separately at >50% and >70% luminal stenosis cut-offs, with true-positive, true-negative, false-positive and false-negative results defined per vessel territory against the corresponding CAG cut-off.
Statistical analysis
Continuous variables were tested for normality with the Shapiro-Wilk test and expressed as mean ± standard deviation or median (interquartile range) as appropriate; categorical variables were expressed as frequencies and percentages. Continuous variables were compared using the t-test or ANOVA, and categorical variables using the chi-square or Fisher’s exact test. Sensitivity, specificity, PPV and NPV were computed for AC and NAC against CAG at both stenosis cut-offs. Pearson’s correlation coefficient and scatter plots were used to assess the association between AC- and NAC-derived extent of perfusion defect. Data were analyzed using SPSS version 11.0, with p < 0.05 considered statistically significant.
RESULTS:
Baseline characteristics
Of the 100 patients enrolled, 80 (80%) were men and 20 (20%) were women, with a mean age of 57.4 ± 9.5 years; 53% were aged 40–60 years and 42% were older than 60 years. Diabetes mellitus (82%), hypertension (75%) and dyslipidemia (69%) were the most prevalent risk factors, and physical stress testing was used in 74% of patients (Table 1). Considering >50% luminal stenosis as the cut-off for significant CAD, 21 patients had single-vessel, 35 had double-vessel and 39 had triple-vessel disease. Of 300 vessel territories evaluated, significant stenosis (>50%) was present in 57 LAD, 34 LCx and 52 RCA territories; using the >70% cut-off, 37 LAD, 18 LCx and 32 RCA territories were affected.
Table 1. Baseline characteristics of the study population (n = 100)
|
Characteristic |
Value |
|
Age, years (mean ± SD) |
57.4 ± 9.5 |
|
Male sex, n (%) |
80 (80.0) |
|
Female sex, n (%) |
20 (20.0) |
|
Diabetes mellitus, n (%) |
82 (82.0) |
|
Hypertension, n (%) |
75 (75.0) |
|
Dyslipidemia, n (%) |
69 (69.0) |
|
Current/past smoking, n (%) |
55 (55.0) |
|
Family history of CAD, n (%) |
42 (42.0) |
|
Physical stress protocol, n (%) |
74 (74.0) |
|
Pharmacological stress protocol, n (%) |
26 (26.0) |
|
Single-vessel disease, n (%)* |
21 (21.0) |
|
Double-vessel disease, n (%)* |
35 (35.0) |
|
Triple-vessel disease, n (%)* |
39 (39.0) |
*Considering >50% luminal stenosis on coronary angiography as the cut-off for significant disease.
Diagnostic performance at the >50% stenosis cut-off
Against CAG, AC showed sensitivity/specificity of 80.7%/83.7% in the LAD, 76.5%/93.9% in the LCx and 75.0%/89.6% in the RCA territory, while NAC showed 78.9%/81.4%, 79.4%/86.4% and 80.8%/72.9%, respectively (Table 2, Figure 1). AC therefore showed higher specificity than NAC in all three territories, with a marginally higher sensitivity only in the LAD territory; NAC showed higher sensitivity than AC in the LCx and RCA territories but at the cost of markedly lower specificity, particularly in the RCA territory (72.9% vs 89.6%).
Table 2. Diagnostic performance of AC and NAC against coronary angiography, >50% stenosis cut-off
|
Territory |
Method |
Sensitivity (%) |
Specificity (%) |
PPV (%) |
NPV (%) |
|
LAD |
AC |
80.7 |
83.7 |
86.8 |
76.6 |
|
|
NAC |
78.9 |
81.4 |
84.9 |
74.5 |
|
LCx |
AC |
76.5 |
93.9 |
86.7 |
88.6 |
|
|
NAC |
79.4 |
86.4 |
75.0 |
89.1 |
|
RCA |
AC |
75.0 |
89.6 |
88.6 |
76.8 |
|
|
NAC |
80.8 |
72.9 |
76.4 |
77.8 |
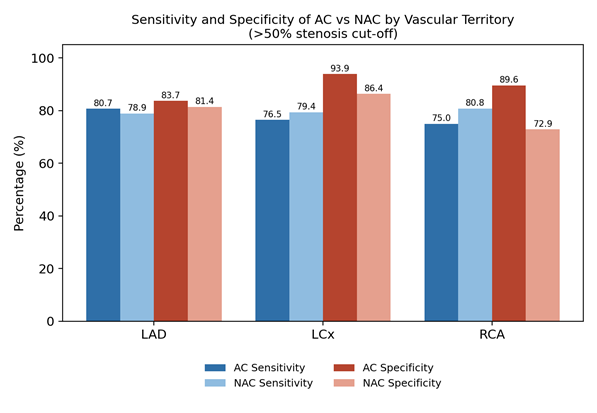
Figure 1. Sensitivity and specificity of AC and NAC by vascular territory, >50% stenosis cut-off.
Diagnostic performance at the >70% stenosis cut-off
At the >70% stenosis cut-off, AC showed sensitivity/specificity of 86.5%/66.7% (LAD), 83.3%/81.7% (LCx) and 84.4%/75.0% (RCA), compared with 83.8%/65.1%, 88.9%/75.6% and 87.5%/60.3% for NAC (Table 3, Figure 2). Compared with the >50% cut-off, both AC and NAC showed higher sensitivity but lower specificity at the >70% cut-off in all three territories, while the relative pattern of AC having higher specificity than NAC was preserved.
Table 3. Diagnostic performance of AC and NAC against coronary angiography, >70% stenosis cut-off
|
Territory |
Method |
Sensitivity (%) |
Specificity (%) |
PPV (%) |
NPV (%) |
|
LAD |
AC |
86.5 |
66.7 |
60.6 |
89.4 |
|
|
NAC |
83.8 |
65.1 |
58.5 |
87.2 |
|
LCx |
AC |
83.3 |
81.7 |
50.0 |
95.7 |
|
|
NAC |
88.9 |
75.6 |
44.4 |
96.9 |
|
RCA |
AC |
84.4 |
75.0 |
61.4 |
91.1 |
|
|
NAC |
87.5 |
60.3 |
50.9 |
91.1 |
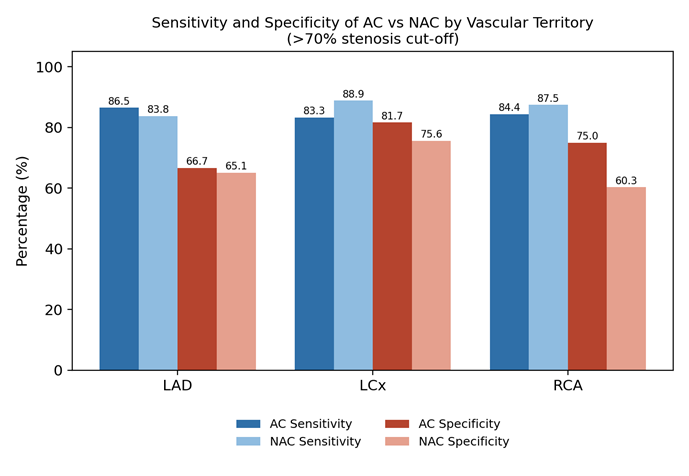
Figure 2. Sensitivity and specificity of AC and NAC by vascular territory, >70% stenosis cut-off.
Overall (pooled) sensitivity and specificity considering >50% stenosis as the reference cut-off were 86.8% and 83.3% for AC, compared with 88.2% and 58.3% for NAC, indicating a substantially higher specificity with AC at a similar overall sensitivity.
Extent of perfusion defect and concordance between AC and NAC
Concordant perfusion defects on AC and NAC were seen in 49 LAD, 29 LCx and 41 RCA territories, of which 43, 25 and 36 respectively showed >50% stenosis on CAG. Defects seen only on AC (not NAC) occurred in 4 LAD, 1 LCx and 3 RCA territories, of which 3 (75%), 1 (100%) and 3 (100%) had >50% stenosis. Defects seen only on NAC (not AC) occurred in 4 LAD, 7 LCx and 14 RCA territories, of which 2 (50%), 2 (28.6%) and 6 (42.9%) had >50% stenosis, indicating a lower false-positive rate for AC than NAC across all territories.
On semiquantitative analysis, the mean extent of perfusion defect was smaller with AC than NAC overall (16.6 ± 18.6 vs 18.7 ± 19.1; p = 0.005) and in the RCA territory specifically (4.7 ± 7.1 vs 6.4 ± 7.7; p = 0.0001), but this difference was not significant in the LAD territory (9.0 ± 11.3 vs 8.8 ± 11.5; p = 0.671) or the LCx territory (3.1 ± 5.7 vs 3.5 ± 6.0; p = 0.099) (Table 4).
Table 4. Extent of perfusion defect (semiquantitative, mean ± SD) in AC versus NAC images by vascular territory
|
Territory |
AC |
NAC |
p value |
|
LAD |
9.0 ± 11.3 |
8.8 ± 11.5 |
0.671 |
|
LCx |
3.1 ± 5.7 |
3.5 ± 6.0 |
0.099 |
|
RCA |
4.7 ± 7.1 |
6.4 ± 7.7 |
0.0001 |
|
Total |
16.6 ± 18.6 |
18.7 ± 19.1 |
0.005 |
The extent of perfusion defect on AC correlated well with NAC across all three vascular territories, with the strongest association in the LAD territory (R² = 0.906), followed by the total left ventricular myocardium (R² = 0.861), the LCx territory (R² = 0.772) and the RCA territory (R² = 0.675) (Figure 3).
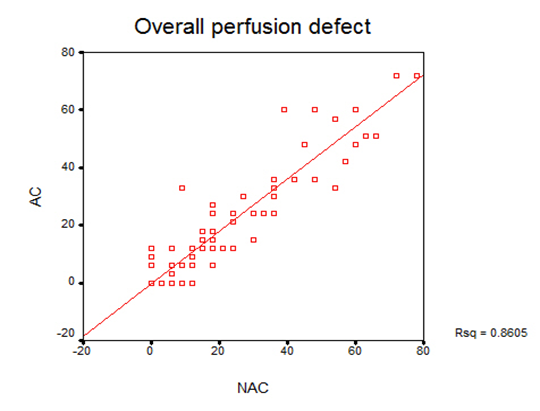
Figure 3. Scatter plot showing the association between the extent of perfusion defect on AC and NAC imaging for the total left ventricular myocardium (R² = 0.861).
DISCUSSION:
Myocardial perfusion imaging has a long track record in the diagnosis, risk stratification and prognostication of CAD, and the increasing availability of hybrid SPECT/CT has driven wider use of CT-based attenuation correction in nuclear cardiology.20 Soft-tissue and subdiaphragmatic attenuation remain important causes of reduced diagnostic specificity in SPECT-MPI, contributing to unnecessary downstream investigation and reduced cost-effectiveness; CT-based AC was therefore expected to represent a major advance in the field.22
In the present study of 100 patients (80 men, 20 women; mean age 57.4 ± 9.5 years), CAD detected on CAG was more common in men than women (62/80 vs 16/20), consistent with the postulated protective effect of endogenous estrogen on coronary disease in premenopausal and perimenopausal women, although the role of exogenous estrogen replacement remains controversial, with observational data suggesting benefit but randomized trials failing to confirm it.23
Considering >50% stenosis as the cut-off, AC showed higher specificity than NAC in all three vascular territories, with a small reduction in sensitivity except in the LAD territory, where AC sensitivity was marginally higher than NAC. Sharma et al.20 reported a similar pattern, with increased AC specificity in the RCA territory attributed to overcorrection of RCA perfusion defects by CT-based AC, and Vidal et al.24 likewise reported increased AC specificity in the RCA territory. The higher AC sensitivity observed in the LAD territory in our cohort is consistent with the findings of Shotwell et al.,25 who attributed improved detection in the LAD territory to correction of breast-attenuation artifact, which reduces false-negative interpretations.
At the >70% stenosis cut-off, sensitivity increased and specificity decreased for both AC and NAC across all territories compared with the >50% cut-off, since a higher proportion of high-grade lesions are associated with a perfusion abnormality, while some 50–70% lesions may not be hemodynamically significant;26 notably, the relative pattern of higher AC specificity was preserved across both cut-offs. Using an americium-241 transmission line source rather than CT for AC, Ficaro et al.27 similarly reported higher specificity with AC than NAC across all three territories at both stenosis cut-offs, although their AC method was not directly compared with a CT-based approach.
Fewer false-positive results were seen with AC than with NAC when perfusion defects present in only one dataset were checked against CAG, supporting a modest gain in overall diagnostic accuracy with AC. On quantitative analysis, the total extent of perfusion defect was smaller with AC than NAC (p = 0.005), and this difference was most pronounced in the RCA (inferior wall) territory (p = 0.0001) but was not significant in the LAD (anterior wall) territory (p = 0.671). Because 80% of our cohort was male, and men predominantly show inferior diaphragmatic attenuation artifact while women more often show anterior attenuation artifact, this sex distribution may partly explain why the AC–NAC difference was confined to the inferior wall in this cohort.
In a minority of cases, NAC identified inducible ischemia that was not seen on AC and proved to be a true positive on angiographic correlation, most likely reflecting overcorrection of a genuine perfusion defect by CT-based AC — an observation also reported by Sharma et al.,20 who noted that in the absence of a reference standard for the true size of a perfusion defect, it is often difficult to determine whether AC or NAC more closely approximates the truth. Taken together, these findings suggest that AC improves specificity, at a small cost to sensitivity, thereby improving overall diagnostic accuracy, but that AC is imperfect and can occasionally overcorrect genuine perfusion defects. Simultaneous review of AC and NAC images, together with CAG and clinical findings, therefore appears to be the most reliable approach to interpreting myocardial perfusion SPECT-CT studies.
Limitations
This study has limitations. The comparator literature largely used systems and quantification software other than IQ SPECT and Cedars-Sinai QGS/QPS, limiting direct comparability. The sample size, while adequate for the primary comparison, is modest relative to the overall burden of CAD, and the single-center design may limit generalizability.
CONCLUSION:
Attenuation correction by CT significantly increases the specificity of myocardial perfusion SPECT-CT for the detection of coronary artery disease, at the cost of a small reduction in sensitivity, thereby improving overall diagnostic accuracy compared with non-attenuation-corrected imaging. AC and NAC images are complementary rather than interchangeable: because AC can occasionally overcorrect true perfusion defects, both datasets should be reviewed together, in correlation with coronary angiographic and clinical findings, for optimal interpretation of myocardial perfusion imaging studies.
REFERENCES:
1. Gupta R, Joshi P, Mohan V, et al. Epidemiology and causation of coronary heart disease and stroke in India. Heart. 2008;94(1):16-26.
2. Murray CJL, Lopez AD. Alternative projections of mortality and disability by cause 1990–2020: global burden of disease study. Lancet. 1997;349(9064):1498-504.
3. Harrison’s Principles of Internal Medicine. 18th ed. Chapter 23, p.1387.
4. Gould KL. Coronary Artery Stenosis. New York: Elsevier Science; 1991.
5. Pazhenkottil AP, Nkoulou RN, Ghadri JR, et al. Prognostic value of cardiac hybrid imaging integrating single-photon emission computed tomography with coronary computed tomography angiography. Eur Heart J. 2011;32:1465-71.
6. Garcia EV. SPECT attenuation correction: an essential tool to realize nuclear cardiology’s manifest destiny. J Nucl Cardiol. 2007;14(1):16-24.
7. Zaret BL, Beller GA. Clinical Nuclear Cardiology: State of the Art and Future Directions. Philadelphia: Mosby; 2005:215-355.
8. Klocke FJ, Baird MG, Lorell BH, et al. ACC/AHA/ASNC guidelines for the clinical use of cardiac radionuclide imaging—executive summary. J Am Coll Cardiol. 2003;42:1318-33.
9. DePuey EG. How to detect and avoid myocardial perfusion SPECT artifacts. J Nucl Med. 1994;35:699-702.
10. Desmarais RL, Kaul S, Watson DD, et al. Do false-positive thallium-201 scans lead to unnecessary catheterization? Outcome of patients with perfusion defects on quantitative planar thallium-201 scintigraphy. J Am Coll Cardiol. 1993;21:1058-63.
11. Heller GV, Links J, Bateman TM, et al. American Society of Nuclear Cardiology and Society of Nuclear Medicine joint position statement: attenuation correction of myocardial perfusion SPECT scintigraphy. J Nucl Cardiol. 2004;11:229-30.
12. Fleischmann S, Koepfli P, Namdar M, et al. Gated 99mTc-tetrofosmin SPECT for discriminating infarct from artifact in fixed myocardial perfusion defects. J Nucl Med. 2004;45:754-9.
13. Segall GM, Davis MJ. Prone versus supine thallium myocardial SPECT: a method to decrease artifactual inferior wall defects. J Nucl Med. 1989;30:548-55.
14. Schepis T, Gaemperli O, Koepfli P, et al. Use of coronary calcium score scans from stand-alone multislice computed tomography for attenuation correction of myocardial perfusion SPECT. Eur J Nucl Med Mol Imaging. 2007;34:11-9.
15. Masood Y, Liu YH, DePuey G, et al. Clinical validation of SPECT attenuation correction using x-ray computed tomography–derived attenuation maps: multicenter clinical trial with angiographic correlation. J Nucl Cardiol. 2005;12:676-86.
16. Koepfli P, Hany TF, Wyss CA, et al. CT attenuation correction for myocardial perfusion quantification using a PET/CT hybrid scanner. J Nucl Med. 2004;45:537-42.
17. O’Connor MK, Kemp BJ. Single-photon emission computed tomography/computed tomography: basic instrumentation and innovations. Semin Nucl Med. 2006;36:258-66.
18. Tan P, Bailey DL, Meikle SR, et al. A scanning line source for simultaneous emission and transmission measurements in SPECT. J Nucl Med. 1993;34:1752-60.
19. Malkerneker D, Brenner R, Martin WH, et al. CT-based attenuation correction versus prone imaging to decrease equivocal interpretations of rest/stress Tc-99m tetrofosmin SPECT MPI. J Nucl Cardiol. 2007;14:314-23.
20. Sharma P, Patel CD, Karunanithi S, et al. Comparative accuracy of CT attenuation-corrected and non-attenuation corrected SPECT myocardial perfusion imaging. Clin Nucl Med. 2012;37(4):332-8.
21. Cuocolo A. Attenuation correction for myocardial perfusion SPECT imaging: still a controversial issue. Eur J Nucl Med Mol Imaging. 2011;38(10):1887-90.
22. Utsunomiya D, Tomiguchi S, Shiraishi S, et al. Initial experience with X-ray CT–based attenuation correction in myocardial perfusion SPECT imaging using a combined SPECT/CT system. Ann Nucl Med. 2005;19(6):485-9.
23. Roeters van Lennep JE, Westerveld HT, Erkelens DW, et al. Risk factors for coronary heart disease: implications of gender. Cardiovasc Res. 2002;53(3):538-49.
24. Vidal R, Buvat I, Darcourt J, et al. Impact of attenuation correction by simultaneous emission/transmission tomography on visual assessment of 201-Tl myocardial perfusion images. J Nucl Med. 1999;40(8):1301-9.
25. Shotwell M, Singh BM, Fortman C, Bauman BD, Lukes J, Gerson MC. Improved coronary disease detection with quantitative attenuation-corrected Tl-201 images. J Nucl Cardiol. 2002;9(1):52-62.
26. Ell PJ, Gambhir SS, editors. Nuclear Medicine in Clinical Diagnosis and Treatment. 3rd ed. Vol 2, p.1111.
27. Ficaro EP, Fessler JA, Shreve PD, et al. Simultaneous transmission/emission myocardial perfusion tomography: diagnostic accuracy of attenuation-corrected 99mTc-sestamibi single-photon emission computed tomography. Circulation. 1996;93(3):463-73.