Association of Vit B12 Deficiency in Patients with Pancytopenia in a Tertiary Care Hospital.
- K. Swetha , Assistant professor of General Medicine Government Medical College Krishnagiri
- J. Raj Kumar , Assistant professor of General Medicine Government Medical College Krishnagiri
- M.Gayathri , Assistant professor of General Medicine Government Medical College Krishnagiri.
Article Information:
Abstract:
Background: Pancytopenia is a common hematological presentation in clinical practice, arising from a wide range of congenital and acquired causes. Among these, megaloblastic anemia due to Vitamin B12 deficiency is one of the most frequently identified and readily treatable causes, and early recognition can significantly reduce associated morbidity and mortality. Aim: To determine the incidence of Vitamin B12 deficiency among patients presenting with pancytopenia, to evaluate relevant hematological parameters, and to assess the response to Vitamin B12 replacement therapy. Methods: This single-centre, descriptive observational study was conducted at Mahatma Gandhi Memorial Government Hospital, Trichy, Tamil Nadu, over a one-year period (December 2016–December 2017), after institutional ethics committee approval. Fifty patients above 13 years of age presenting with pancytopenia (hemoglobin <9 g/dl, WBC <4000/mm³, platelet count <1 lakh/mm³) were enrolled after informed consent, excluding those on myelotoxic chemotherapy or radiotherapy. Detailed history and clinical examination were recorded, and blood samples were analyzed for complete blood counts, red cell indices, peripheral smear, reticulocyte count, liver and renal function, coagulation profile, direct Coombs test, HIV screening, and serum Vitamin B12 levels. Bone marrow aspiration was performed in all patients. Data were analyzed using SPSS, with chi-square testing applied for significance (p≤0.05). Results: The mean age of patients was 32.84 years, with a male-to-female ratio of 1.5:1. Easy fatigability (100%) and pallor (100%) were universal presenting features, while bleeding manifestations, knuckle hyperpigmentation, and organomegaly were seen in a subset of patients. Macrocytosis (MCV >100 fL) was observed in 66% of patients, and 88% had a reticulocyte count below 1%. Serum Vitamin B12 levels were low (<200 pg/ml) in 62% of patients. Bone marrow aspiration revealed a hypercellular marrow with megaloblastic features in 58% of cases, establishing Vitamin B12 deficiency as the leading cause of pancytopenia in this cohort, followed by findings suggestive of aplastic anemia and acute myeloid leukemia in a smaller proportion. Low Vitamin B12 levels were significantly more common in females and were significantly associated with lower reticulocyte counts. Following treatment with parenteral Cyanocobalamin along with folate and iron supplementation, a statistically significant improvement in reticulocyte percentage was observed. Conclusion: Vitamin B12 deficiency-related megaloblastic anemia is the most common identifiable cause of pancytopenia in this study population, disproportionately affecting females, and responds well to parenteral Vitamin B12 therapy, underscoring the value of early screening and treatment in patients presenting with pancytopenia.
Keywords:
Article :
INTRODUCTION:
Pancytopenia is one of the most commonly encountered hematological entity in the clinical practice. It is characterized by reduction in the number of all blood cell lines namely red blood cells, white blood cells, platelets. For all the practical purposes, it should have hemoglobin<10g%, absolute neutrophil count <1500mm3, platelets <100,000/mm3.It is labeled as severe pancytopenia when hemoglobin<7g%, absolute neutrophil count <500mm3, platelet <20,000mm3.
Pancytopenia may be due to several congenital and acquired causes. It may be due to either decreased bone marrow production or increased peripheral destruction/sequestration. The most common causes of acquired decreased bone marrow production are megaloblastic anemia, cytotoxic chemotherapy, radiotherapy, bone marrow infiltration, myelofibrosis, myelodysplasia, idiopathic aplastic anemia. Other common acquired causes are Systemic lupus erythematosus, HIV, mycobacterial infection, acute viral infections like Epstein Barr virus etc.
Uncommon causes of decreased bone marrow production are Paroxysmal nocturnal hemoglobinuria, anorexia nervosa, transfusion associated graft versus host disease, heavy metal poisoning ,infections like Parvovirus B19,Human herpes virus6,CMV in transplant recipients, Legionnaires’ disease.
Common causes of pancytopenia due to increased destruction are due to liver disease, portal hypertension. Other causes are drug induced pancytopenia, hyperspleenism due to myeloid, lymphoproliferative disease, Evans syndrome, infections like brucellosis, visceral leishmniasis, and Hemophagocytic syndrome.
Congenital causes of pancytopenia associated with complex multisystem disorders such as Fanconi anemia, Dyskeratosis congenita, congenital amegakaryocytic thrombocytopenia, Shwachmann syndrome, Gauchers disease.
Among the several above discussed causes, incidence and cause for pancytopenia varies among several social, cultural, ethnic backgrounds. Only few studies have been done in India regarding incidence and causes of pancytopenia. Among several causes of pancytopenia, Megaloblastic anemia is one of the most commonly cited causes for pancytopenia. Megaloblastic anemia is one of the easily treatable causes for pancytopenia. Its early recognition and treatment helps in reducing morbidity and mortality.
Our study aims to study the incidence of megaloblastic anemia due to Vitamin B12 deficiency in patients and its response to therapy with Vitamin B12.
AIMS AND OBJECTIVES
• To study the incidence of Vitamin B12 deficiency in patients presenting with features of pancytopenia.
• To evaluate the hematological parameters.
• To study on the efficacy of treatment with Vitamin B12 in patients with pancytopenia.
MATERIALS AND METHODS:
Source of data:
This study was conducted at Mahatma Gandhi Memorial Government Hospital, Trichy, Tamilnadu during the period of December 2016 to December 2017.
Study Design:
Single centre, descriptive observational study.
Period of Study:
The work was carried out from December 2016 to December 2017.
Ethical Committee Approval:
Ethical committee approval obtained from the Institutional Ethical committee.
Inclusion Criteria:
• All patients > 13 years presenting in Medicine OPD or wards with pancytopenia defined by the criteria of Hemoglobin< 9g/dl,
WBC< 4000,
Platelet count < 1Lakh/mm3.
• Willingness of the patient.
Exclusion criteria:
• Patients on myelotoxic chemotherapy and radiotherapy.
• Age of the patient <13years.
• Nonwillingness of the patient.
Consent:
An informed consent obtained from all the participants.
Method of collection of data:
History and Clinical Examination:
Detailed history obtained from all the participants using proforma which includes age, occupation, presenting complaints, Diet History, Drug History, History of smoking and alcoholism. Detailed clinical examination to detect pallor, jaundice, lymphadenopathy, Sternal tenderness, Hepatospleenomegaly was done. Detailed neuropsychiatric evaluation done.
Blood collection:
Nearly 5ml of blood is collected from all the participants at the time of admission to the hospital, sent for below mentioned tests. The blood collected from the patients were sent for basic routine tests like Complete blood count including Red Cell Indices like MCV, MCH, MCHC using EDTA as anticoagulant. Peripheral smear study is done along with reticulocyte count. For the purpose of reticulocyte count, blood is collected in containers containing methylene blue. Serum samples are sent for biochemical investigations like renal function tests, Liver function test, and Coagulation profile testing by PT/INR, activated partial thromboplastin time. All patients’ blood samples are subjected to direct coombs test and HIV testing.
USG abdomen is routinely done to all the patients.
Serum Vitamin B12 Estimation:
All patients presenting with pancytopenia are evaluated for their serum Vitamin B12 levels. Normal serum Vitamin B12 level based on our assay is between 250-1100 pg/ml.
Bone marrow Aspiration:
After getting informed consent from the patients, under strict aseptic precautions with local infiltration with xylocaine, Bone marrow is aspirated using Salah’s bone marrow aspiration needle from posterior iliac crest. From the aspirate, approximately eight to ten smears were made and sent to the pathological study.
Analysis of data:
All data from the study were entered in Microsoft Excel before statistical analysis. Data was analysed with help of statistical software tool SPSS Chicago. Using this software, range, frequencies, percentages, means, standard deviations, p values were obtained. Results are shown in table format. P value less than or equal to 0.05 was considered to be statistically significant. Chi square test was used to test the significance.
RESULTS:
Table 1 -Age distribution of the patients
|
Age range |
Number of respondents |
Percentage |
|
Below 20yrs |
12 |
24.0 |
|
21 to 30yrs |
9 |
18.0 |
|
31 to 40yrs |
12 |
24.0 |
|
41 to 50yrs |
13 |
26.0 |
|
Above 51yrs |
4 |
8.0 |
|
Total |
50 |
100.0 |
|
Min.: 13/ Max.: 59 / Mean:32.84 / S.D.: 12.379 |
||
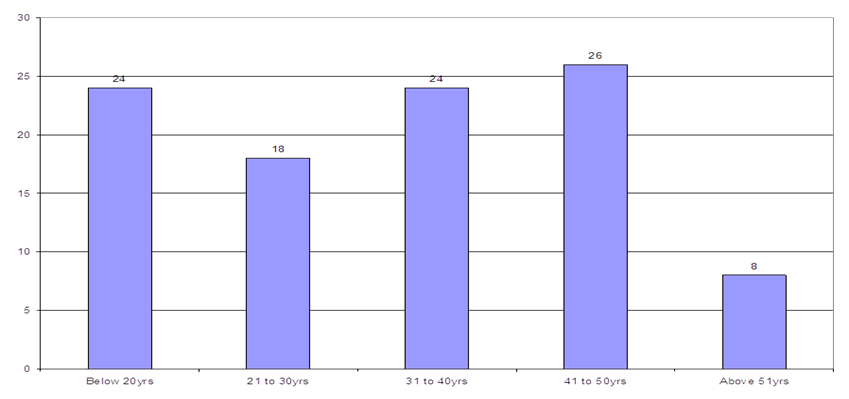
Bar diagram describing age distribution of the patients
Out of 50 patients presenting with pancytopenia, the age of the patients ranges between 13 and 59 years. The mean age of the patients is 32 years.
Table 2-Gender wise distribution of the patients
|
Gender |
Number of respondents |
Percentage |
|
Male |
30 |
60.0 |
|
Female |
20 |
40.0 |
|
Total |
50 |
100.0 |
The male to female ratio of the patients presenting with pancytopenia is 1.5: 1.
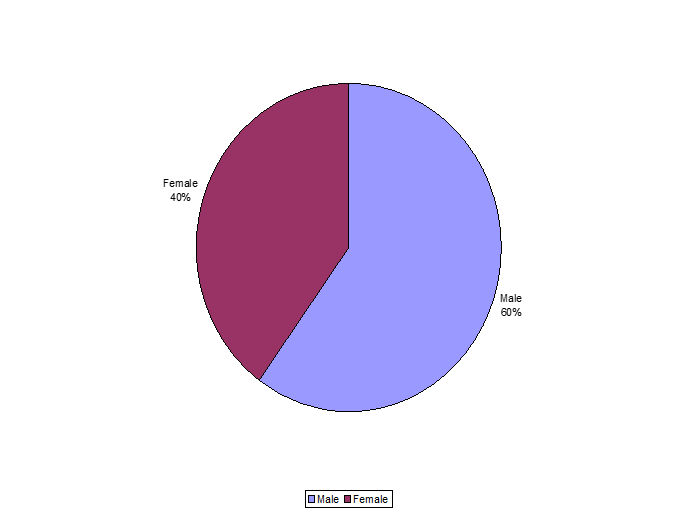
Pie chart showing gender distribution of the patients
Table 3-Distribution of the patients based on occupation
|
Occupation |
Number of respondents |
Percentage |
|
Nursing Students |
13 |
26.0 |
|
Labourer |
24 |
48.0 |
|
Clerk |
2 |
4.0 |
|
Housewife |
9 |
18.0 |
|
Staff Nurses |
2 |
4.0 |
|
Total |
50 |
100.0 |
In our study, 48% of the patients presenting with pancytopenia are labourers. Next, the most common group presenting with pancytopenia are nursing students, accounting for 26% of the total patients.18% of the cases are Housewives, 2% of the patients are clerical people and staff nurses respectively.

BAR DIAGRAM SHOWING OCCPATION BASED DISTRIBUTION OF PATIENTS
TABLE 5 -Distribution of the patients based on presentation with Fatigability
|
H/O Fatigability |
Number of respondents |
Percentage |
|
Yes |
50 |
100.0 |
|
No |
0 |
0 |
|
Total |
50 |
100.0 |
The most common clinical presentation of the patients with pancytopenia is easy fatigability
TABLE 6 - Distribution of the patients based on presentation with bleeding manifestations
|
H/O bleeding |
Number of respondents |
Percentage |
|
No |
35 |
70.0 |
|
Yes |
15 |
30.0 |
|
Total |
50 |
100.0 |
Out of 50 patients presenting with pancytopenia, 35% of the patients had bleeding manifestations in addition to easy fatigability.
Table7-Distribution of patients based on the presence of psychiatric manifestations
|
Psychiatric manifestations |
Number of respondents |
Percentage |
|
No |
48 |
96.0 |
|
Yes |
2 |
4.0 |
|
Total |
50 |
100.0 |
Table 8-Distribution of patients based on the presence of neurological manifestations
|
Neurological manifestations |
Number of respondents |
Percentage |
|
No |
48 |
96.0 |
|
Yes |
2 |
4.0 |
|
Total |
50 |
100.0 |
Only 4% of the patients presented with neurological symptoms and signs like posterior column, pyramidal involvement and psychiatric manifestations.
Table 9- Patient distribution based on the H/O drug exposure.
|
H/O drug intake |
Number of respondents |
Percentage |
|
No |
46 |
92.0 |
|
Yes |
4 |
8.0 |
|
Total |
50 |
100.0 |
Among 50 patients presenting with pancytopenia, only 4% of the patients gave positive history of intake of drugs like Metformin, Proton pump inhibitors, H2 blockers etc., chronically.
Table 10-Distribution of patients based on the diet history
|
Diet history |
Number of respondents |
Percentage |
|
Non-Vegetarian |
24 |
48.0 |
|
Vegetarian |
26 |
52.0 |
|
Total |
50 |
100.0 |
Among 50 patients with pancytopenia, 52% of the patients are on vegetarian diet.
Table 11- Distribution of patients based on the history of smoking
|
H/O smoking |
Number of respondents |
Percentage |
|
No |
27 |
54.0 |
|
Yes |
23 |
46.0 |
|
Total |
50 |
100.0 |
Among the patients presenting with pancytopenia, 46% of the patients were smokers.
Table 12- Distribution of patients based on the history of alcoholism
|
H/O alcoholism |
Number of respondents |
Percentage |
|
No |
26 |
52.0 |
|
Yes |
24 |
48.0 |
|
Total |
50 |
100.0 |
48% of the patients presenting with pancytopenia are alcoholics.
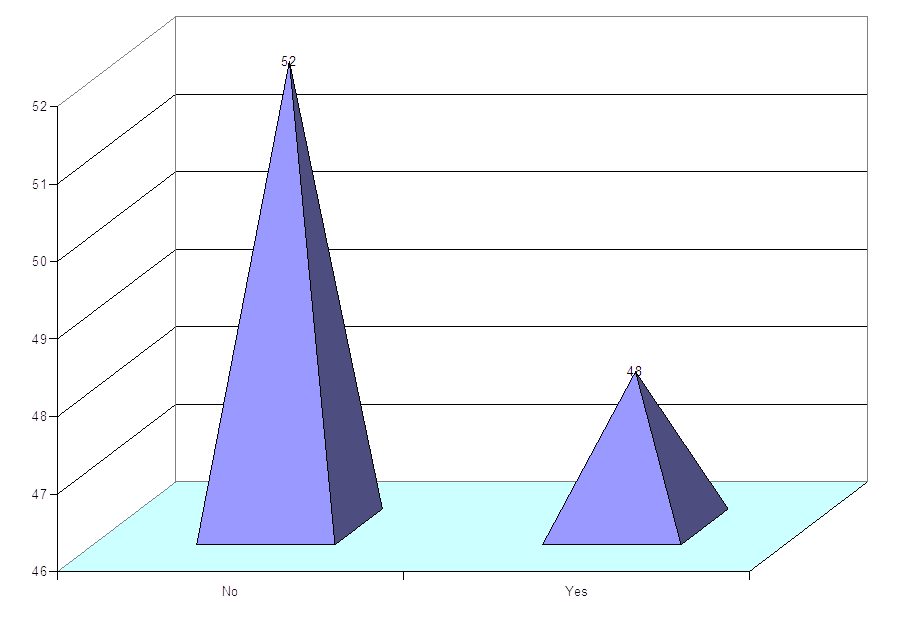
Bar diagram showing the distribution of patients by history of alcoholism
Table 13- Distribution of patients based on the presence of Pallor
|
Presence of pallor |
Number of respondents |
Percentage |
|
Yes |
50 |
100.0 |
|
No |
0 |
0 |
|
Total |
50 |
100.0 |
The most common, universal clinical finding of all the patients is pallor.
Table 14- Distribution of patients based on the presence of icterus
|
Presence of icterus |
Number of respondents |
Percentage |
|
No |
44 |
88.0 |
|
Yes |
6 |
12.0 |
|
Total |
50 |
100.0 |
Only 12% of the patients presenting with pancytopenia are having jaundice.
Table 15- Distribution of patients based on the presence of Knuckle Hyperpigmentation
|
Presence of Knuckle hyperpigmentation |
Number of respondents |
Percentage |
|
No |
28 |
56.0 |
|
Yes |
22 |
44.0 |
|
Total |
50 |
100.0 |
Knuckle hyperpigmentation is seen to present in 44% of the patients presenting with pancytopenia.
Table 16- Distribution of patients based on the presence of Hepatomegaly
|
Presence of hepatomegaly |
Number of respondents |
Percentage |
|
No |
40 |
80.0 |
|
Yes |
10 |
20.0 |
|
Total |
50 |
100.0 |
Only 10% of the patients are having hepatomegaly.
Table 17- Distribution of patients based on the presence of splenomegaly
|
Presence of splenomegaly |
Number of respondents |
Percentage |
|
No |
35 |
70.0 |
|
Yes |
15 |
30.0 |
|
Total |
50 |
100.0 |
Only 30% of the patients are having splenomegaly.
Table 18- Distribution of patients based on the presence of lymphadenopathy
|
Lymphadenopathy |
Number of respondents |
Percentage |
|
No |
47 |
94.0 |
|
Yes |
3 |
6.0 |
|
Total |
50 |
100.0 |
The lymphadenopathy is found to be present in 6% of the patients presenting with pancytopenia.
Table 19- Distribution of patients based on the presence of sternal tenderness
|
Sternal tenderness |
Number of respondents |
Percentage |
|
No |
48 |
96.0 |
|
Yes |
2 |
4.0 |
|
Total |
50 |
100.0 |
The sternal tenderness is found to be present 4% of the patients presenting with pancytopenia.
Table 20- Distribution of patients based on MCV
|
MCV (Femtolitre) |
Number of respondents |
Percentage |
|
Less than 100 |
17 |
34.0 |
|
More than 100 |
33 |
66.0 |
|
Total |
50 |
100.0 |
On hematological analysis of the patients presenting with pancytopenia, 66% of the patients are having MCV>100 fL and 34% of the patients are having MCV < 100 femtolitre.
Table 21- Distribution of patients based on SGOT
|
SGOT |
Number of respondents |
Percentage |
|
Less than 40 |
13 |
26.0 |
|
More than 40 |
37 |
74.0 |
|
Total |
50 |
100.0 |
74% of the patients presenting with pancytopenia are having SGOT levels more than 40.
Table 22- Distribution of patients based on SGPT
|
SGPT |
Number of respondents |
Percentage |
|
Less than 40 |
18 |
36.0 |
|
More than 40 |
32 |
64.0 |
|
Total |
50 |
100.0 |
64% of the patients presenting with pancytopenia are having SGPT levels more than 40.
Table 23- Distribution of patients based on Peripheral Smear findings.
|
Peripheral smear |
Number of respondents |
Percentage |
|
Dimorphic Anemia |
8 |
16.0 |
|
Megaloblastic anemia |
29 |
58.0 |
|
Pancytopenia |
13 |
26.0 |
|
Total |
50 |
100.0 |
Megaloblastic anemia characterized by macrocytosis, hyper segmented neutrophils seen in 58% of the cases .13% of the patients are having peripheral smear finding suggestive of pancytopenia.8% of the patients are having smear with dimorphic anemia with decrease in all cell lineages.
Table 24- Distribution of patients based on Reticulocyte count:
|
Reticulocyte count |
Number of respondents |
Percentage |
|
Less than 1 |
44 |
88.0 |
|
More than 1 |
6 |
12.0 |
|
Total |
50 |
100.0 |
|
Min:0.1 /Max:3 /Mean:0.758 /S.D:0.6141 |
||
88% of the patients are having reticulocyte count less than 1% suggestive of hypocellular marrow. Rest 12% of the patients is having reticulocyte count less than 1%.
Table 25- Distribution of patients based on USG Abdomen
|
Ultra sonogram Abdomen findings |
Number of respondents |
Percentage |
|
Normal |
35 |
70.0 |
|
Hepatospleenomegaly |
10 |
20.0 |
|
Cirrhosis with splenomegaly |
1 |
2.0 |
|
Splenomegaly |
4 |
8.0 |
|
Total |
50 |
100.0 |
70% of the patients are having normal finding in ultra-sonogram.20% of the patients are having hepatospleenomegaly.8% of the patients are having splenomegaly. One patient found to have features suggestive of cirrhosis of liver with portal hypertension.
Table 26-Distribution of patients based on the serum Vitamin B12 levels
|
Serum Vitamin B12 |
Number of respondents |
Percentage |
|
Less than 200 |
31 |
62.0 |
|
More than 200 |
19 |
38.0 |
|
Total |
50 |
100.0 |
Among 50 patients presented with pancytopenia, about 62% of the patients are having serum Vitamin B12 level less than 200 pg/ml.
Table 27-Distribution of patients based on the Bone marrow aspiration findings.
|
Bone marrow aspiration |
Number of respondents |
Percentage |
|
Hypercellular marrow with no specific features |
15 |
30.0 |
|
Hypercellular marrow with Megaloblastic picture |
29 |
58.0 |
|
AML |
3 |
6.0 |
|
Hypocellular marrow with aplastic anemia features |
3 |
6.0 |
|
Total |
50 |
100.0 |
Out of 50 patients presented with clinical features of pancytopenia, 58% of the patients are having hypercellular bone marrow with erythroid hyperplasia; giant metamyelocytes suggestive of Vitamin B12 deficiency.30% of the patient had hypercellular bone marrow with no specific features. Three patients diagnosed to have aleukemic leukemia (Acute Myeloid Leukemia).Other three patients diagnosed to have aplastic anemia.
Table 28- Distribution of patients based on the results of ICTC testing.
|
ICTC |
Number of respondents |
Percentage |
|
Non- Reactive |
45 |
90.0 |
|
Reactive |
5 |
10.0 |
|
Total |
50 |
100.0 |
About 10% of the patients presented with pancytopenia are found to be ICTC positive.
Table 28- Distribution of patients based on the results of DCT.
|
Direct coombs test |
Number of respondents |
Percentage |
|
Negative |
46 |
92.0 |
|
Positive |
4 |
8.0 |
|
Total |
50 |
100.0 |
8% of the patients with pancytopenia are having positive direct coombs test.
Table 29- Distribution of patients based on the results of INR
|
INR |
Number of respondents |
Percentage |
|
Normal |
45 |
90.0 |
|
Elevated |
5 |
10.0 |
|
Total |
50 |
100.0 |
5% of the patients with pancytopenia are having elevated INR.
Descriptive Statistics
|
|
N |
Min. |
Max. |
Mean |
S.D |
|
q1-Age |
50 |
13 |
59 |
32.84 |
12.379 |
|
q19-Hb |
50 |
3.0 |
9.0 |
5.816 |
1.3835 |
|
q20-TC |
50 |
1200 |
3800 |
2628.76 |
677.370 |
|
q21-Platelet |
50 |
12000 |
93000 |
55022.00 |
23180.034 |
|
q22-MCV |
50 |
78 |
159 |
115.76 |
20.422 |
|
q23-MCH |
50 |
26 |
50 |
35.24 |
5.141 |
|
q24-MCHC |
50 |
22.0 |
42.0 |
31.864 |
3.9202 |
|
q26- Total Bilirubin |
50 |
1.0 |
5.0 |
1.582 |
1.1002 |
|
q27-SGOT |
50 |
32 |
178 |
60.20 |
32.386 |
|
q28-SGPT |
50 |
28 |
387 |
51.34 |
49.969 |
|
q32- Vit B12 |
50 |
41 |
590 |
210.48 |
148.178 |
Comparison of Bone marrow aspiration findings with age
|
BM Aspiration |
Age |
Statistical inference |
|||||
|
Less than 30yrs |
More than 30yrs |
Total |
|||||
|
N |
% |
N |
% |
N |
% |
||
|
Pancytopenia with no specific features |
5 |
23.8% |
10 |
34.5% |
15 |
30.0% |
X2=3.853 Df=3 .278>0.05 Not Significant |
|
Pancytopenia with megaloblastic picture |
15 |
71.4% |
14 |
48.3% |
29 |
58.0% |
|
|
AML |
1 |
4.8% |
2 |
6.9% |
3 |
6.0% |
|
|
Aplastic Anemia |
0 |
.0% |
3 |
10.3% |
3 |
6.0% |
|
|
Total |
21 |
100.0% |
29 |
100.0% |
50 |
100.0% |
|
In our study, we attempted to compare the distribution of causes of pancytopenia with regard to the age of the patients, but it is not statistically significant.
Comparison of Bone marrow aspiration findings with gender distribution
|
BM Aspiration |
Gender |
Statistical inference |
|||||
|
Male |
Female |
Total |
|||||
|
n |
% |
N |
% |
n |
% |
||
|
Pancytopenia with no specific features |
10 |
33.3% |
5 |
25.0% |
15 |
30.0% |
X2=5.939 Df=3 .115>0.05 Not Significant |
|
Pancytopenia with megaloblastic picture |
14 |
46.7% |
15 |
75.0% |
29 |
58.0% |
|
|
AML |
3 |
10.0% |
0 |
.0% |
3 |
6.0% |
|
|
Aplastic Anemia |
3 |
10.0% |
0 |
.0% |
3 |
6.0% |
|
|
Total |
30 |
100.0% |
20 |
100.0% |
50 |
100.0% |
|
In our study, we compared the gender wise distribution of pancytopenia by comparing with bone marrow aspiration findings, but it is not statistically significant
Comparison of serum Vitamin B12 levels with age wise distribution
|
Age |
B12 |
Statistical inference |
|||||
|
Less than 200 |
More than 200 |
Total |
|||||
|
n |
% |
n |
% |
N |
% |
||
|
Less than 30yrs |
16 |
51.6% |
5 |
26.3% |
21 |
42.0% |
X2=3.095 Df=1 .079>0.05 Not Significant |
|
More than 30yrs |
15 |
48.4% |
14 |
73.7% |
29 |
58.0% |
|
|
Total |
31 |
100.0% |
19 |
100.0% |
50 |
100.0% |
|
In our study, we compared the prevalence of vitamin B12 deficiency in patients presenting with pancytopenia with age wise distribution. But, it is not statistically significant.
Comparison of serum Vitamin B12 levels with gender wise distribution
|
Sex |
B12 |
Statistical inference |
|||||
|
Less than 200 |
More than 200 |
Total |
|||||
|
N |
% |
N |
% |
n |
% |
||
|
Male |
15 |
48.4% |
15 |
78.9% |
30 |
60.0% |
X2=4.584 Df=1 .032<0.05 Significant |
|
Female |
16 |
51.6% |
4 |
21.1% |
20 |
40.0% |
|
|
Total |
31 |
100.0% |
19 |
100.0% |
50 |
100.0% |
|
In our study, we compared the prevalence of vitamin B12 deficiency in patients presenting with pancytopenia with gender wise distribution. We came to the conclusion that serum vitamin B12 deficiency is more prevalent among female gender. P value is less than 0.05, which is statistically significant.
Comparison of serum Vitamin B12 levels with reticulocyte percentage distribution
|
Reticulocyte percentage |
B12 |
Statistical inference |
|||||
|
Less than 200 |
More than 200 |
Total |
|||||
|
n |
% |
N |
% |
n |
% |
||
|
Less than 1 |
30 |
96.8% |
14 |
73.7% |
44 |
88.0% |
X2=5.947 Df=1 .015<0.05 Significant |
|
More than 1 |
1 |
3.2% |
5 |
26.3% |
6 |
12.0% |
|
|
Total |
31 |
100.0% |
19 |
100.0% |
50 |
100.0% |
|
In our study, we attempted to compare the serum vitamin B12 levels in regard to the reticulocyte count. We found that in patients presenting with pancytopenia, having low serum vitamin B12 is usually associated with low reticulocyte percentage, which is statistically significant. Thus, Reticulocyte percentage can be taken as surrogate marker for patients presenting with pancytopenia due to Vitamin B12 deficiency, one of the most common cause for pancytopenia.
Comparison of pretreatment reticulocyte percentage with of post treatment reticulocyte percentage distribution.
|
Reticulocyte percentage |
Post treatment Reticulocyte percentage |
Statistical inference |
|||||
|
Less than 1 |
More than 1 |
Total |
|||||
|
N |
% |
N |
% |
n |
% |
||
|
Less than 1 |
31 |
96.9% |
13 |
72.2% |
44 |
88.0% |
X2=6.630 Df=1 .010<0.05 Significant |
|
More than 1 |
1 |
3.1% |
5 |
27.8% |
6 |
12.0% |
|
|
Total |
32 |
100.0% |
18 |
100.0% |
50 |
100.0% |
|
In our study, we treated patients presenting with pancytopenia with low reticulocyte count, low serum vitamin B12 with appropriate doses of parenteral Cyanocobalamin preparations along supplementing the patients with folate, ferrous sulphate tablets to meet proliferating marrow demand. Post treatment reticulocyte count taken after one week of treatment before discharge. We came to the conclusion there is significant improvement in hematological parameters after parenteral cobalamin administration. P value is 0.10, which is less than 0.05, which is statistically significant.
DISCUSSION:
Pancytopenia is one of the most common hematological entities observed in the clinical setting.VitaminB12 deficiency is one of the most common, easily treatable and correctable cause for pancytopenia. In our study conducted among 50 patients with age more than 13 years presented with pancytopenia at Mahatma Gandhi Government General Hospital, Trichy.
The age wise distribution of pancytopenia revealed 24% of the patients were less than 20 years, 18% were between 21 and 30years, 24% were between 31 and 40 years, 26% of the patients were between 41 and 50 years, 8% were between above 51 years. The mean age of the patients in our study was 32.4 years, which is close to the mean age of the study conducted by Ramdas Jella et al; at Telangana were 34.9 plus or minus 4.3 years. The mean age in study conducted by B N Gayathri et al was 42 years; age range of the patients was between 2 and 80 years.
Gender wise distribution of pancytopenia revealed ratio of 1.5:1 comprising 30 male patients and 20 female patients, which is similar to gender distribution of Ramdas Jella et al which showed ratio of 1.4:1.The male female sex ratio in Khunger et al study is 1.2:1; gender distribution in B N Gayathri et al, Dubey et al was 1.2:1, 1.4:1 respectively.
The most common presenting features in patients presenting with pancytopenia are easy fatigability (100%), bleeding in 30% of the patients. Neurological manifestations like paraparesis observed in 2 cases. Psychiatric manifestations were observed in 2 cases; which is comparable to the presenting feature in studies like Dubey et al; Benazeer Mansuri et al; B N Gayathri et al where common presentation was weakness.
On analyzing relationship between chronic drug exposure to drugs like metformin, Proton pump inhibitors revealed only8% of these patients had pancytopenia. In our study, 52% of the patients were on vegan diet which is not statistically insignificant.
The most common clinical findings were pallor (100%), knuckle hyperpigmentation (44%), splenomegaly (30%), hepatomegaly (20%),icterus(20%),generalised lymphadenopathy(6%), sternal tenderness(4%).Similar observations were noted in the study conducted by T.N.Dubey et al .The observations in the study by Benazeer Mansuri et al is pallor(100%), hepatospleenomegaly (48%),jaundice(8%),lymphadenopathy(4%).
The red cell indices like MCV showed 66% of the patients revealed macrocytosis defined by MCV values more than 100 femtolitres. Elevated liver parameters observed in 64% of the patients. Reticulocyte percentage analysis revealed 88% of the patients have values less than 1%.
Peripheral smear findings comprises the spectrum of megaloblastic anemia (58%),dimorphic anemia(16%),pancytopenia(26%).In Fahim Manzoor et al revealed anisocytosis in most of the cases (58%) followed by megaloblastosis(25 cases),normocytic normochromic anemia(34%).
31% of the patients found to have serum Vitamin B12 less than 200 pg/L. We could not establish any relationship between age and serum vitamin B12 levels. Low serum vitamin B12 levels are more common among females. Low serum VitaminB12 levels are associated with low reticulocyte count.
Among 50 cases of pancytopenia, 5 patients were found to be ICTC positive.
Bone marrow aspiration findings revealed hypercellular marrow with megaloblastic features in 29 cases; hypercellular marrow with no specific features in 15 cases; hypocellular marrow suggestive of aplastic anemia in 3 cases.3 cases were found to have acute myeloid leukemia. The above observed findings were noted in several studies like B N Gayathri et al, Dubey et al, Fahim Manzoor et al, Ramdas Jella et al, Osman Yokus et al.
CONCLUSION:
From our study, we came to the following conclusions;
COMPARISON OF ETIOLOGICAL CAUSES OF PANCYTOPENIA OF OUR STUDY WITH OTHER STUDIES
|
Causes |
Gayathri et al (107 cases) |
Osman Yokus et al (137 cases) |
Fahim Manzoor et al (50 cases) |
Ramdas Jella et al (56 cases) |
Dubey et al (70 cases) |
Present study (50 cases) |
|
First common cause |
Megaloblastic anemia (77) |
Megaloblastic anemia (24) |
Megaloblastic anemia (56%) |
Megaloblastic anemia (24) |
Megaloblastic anemia (29) |
Megaloblastic anemia (29) |
|
Second common cause |
Aplastic anemia (19) |
Hyperspleenism (21) |
Aplastic anemia (14%) |
Aplastic anemia (13) |
Aplastic anemia (16) |
Hyperspleenism (10) |
|
Third common cause |
Sub leukemic leukemia (4) |
Acute Leukemoid Leukemia (19) |
Hyperspleenism (8%) |
Rheumatoid arthritis (4) |
Hyperspleenism (11) |
HIV (5) |
|
Fourth common cause |
Malaria (2) |
Aplastic anemia (11) |
Post viral illness (9%) |
Malaria (4) |
Acute myeloid Leukemia (9) |
Aplastic anemia (3) |
• Megaloblastic anemia due to Vitamin B12 deficiency is the most common cause of pancytopenia in our study.
• The mean age of the patients with pancytopenia in our study is32.84 years.
• There is male dominance with male to female ratio of the incidence is 1.5:1.
• The most common clinical presentation is easy fatigability, pallor, followed by other findings like hepatospleenomegaly, bleeding manifestations, jaundice, and lymphadenopathy.
• The low serum vitamin B12 is more common among female gender.
• There is positive correlation between reticulocyte percentage and serum vitaminB12 levels.
• Patients presented with pancytopenia due to megaloblastic anemia reversed and treated successfully with parenteral Cyanocobalamin therapy as evident by increase in reticulocyte percentage after the treatment.
LIMITATIONS:
• Sample size of this study is very limited.
• Etiological diagnosis of megaloblastic anemia is not evaluated.
• Serum folate levels are not estimated in this study.
REFERENCES:
1. Harrison’s principles of Internal Medicine 19th Edition.
2. Williams WJ, Bentkr E, Erskv AJ. Hematology third Ed. Singapore: Mcgraw Hill Book company;1986 :161.
3. Gayathri B., Rao K. Pancytopenia: A clinic hematological study.2011; 3 (1):p.15.doi:10.4103/0974-2727.78555.
4. Khunger JM, Arculselvi S, Sharma U, Ranga S,Talib VH. Pancytopenia- A clinico-hematological study of 200 cases. Indian J Pathol Microbiol.2002; 45: 375-9.
5. Knodke K, Marwah S, Buxi G, Vadav RB, Chaturvedi NK. Bone marrow examination in cases of pancytopenia. J Academy Clin Med 2001;2: 55-9.
6. Gupta V, Tripathi S, Tilak V, Bhatia BD.A study of clinico-hematological profiles of pancytopenia in children. Tropical Doct.2008;38: 241-3
7. Manzoor F, Karandikar MN, Nimbargi RC, Pancytopenia: A clinico-hematological study. Med J DY Patil Univ 2014;7: 25-8
8. Jella R, Jella V. Clinico-hematological analysis of pancytopenia. Int J Adv Med 2016; 3: 176-9.
9. Makheja DK, Maheswari KB, Arain S, Kumar S, Kumari S, Vikash. The common causes leading to pancytopenia in patients presenting to tertiary care hospital. Pak J Med Sci.2013; 29: 1108-11.
10. Azaad MA, Li YP, Zhang QR, Wang HX. Detection of pancytopenia associated with clinical manifestation and their final diagnosis. Open J Blood Dis.2015; 5: 17-30.
11. Mansuri B, Thekdi KP.A prospective study among cases of the pancytopenia on the basis of clinico-hematological analysis and bone marrow aspiration. Int J Res Med Sci 2017; 5: 3545-9.
12. Anita P, Vijay D. Clinico-hematological analysis of pancytopenia: a bone marrow study. National J Laboratory Med.2013; 2 (4):12-7.
13. Kar M, Ghosh A. Pancytopenia .J Indian Acad Clin Med.2002; 3: 29-34.
14. Dubey TN, Nigotia P, Saxena R. The common causes of pancytopenia in patients presenting in hospital of central India. Int J Con Med Research.2015; 3: 77-83.
15. Wintrobs MM clinical Methodology 8th ed. Philadelphia, lea febiger 1981, pp 699.