A Comparative Study Of Computed Tomography Pulmonary Angiography (Ctpa) Findings And D-Dimer Levels In Patients With Suspected Acute Pulmonary Embolism Using Ctpa As Gold Standard
- Shreya Panchani , R3 resident doctor, Radiodiagnosis, parul sevashram Hospital
- Anilkumar Rathva , Professor and Head, department of radiodiagnosis, Parul Sevashram Hospital
- Bhargav Gandhi , Assistant Professor, Radiodiagnosis, Parul Sevashram Hospital
- Dipti Parmar , R3 resident doctor, Radiodiagnosis, parul sevashram Hospital
Article Information:
Abstract:
Background: D-dimer is widely used in the diagnostic evaluation of suspected pulmonary embolism (PE), but its relationship with CTPA-confirmed disease and embolic distribution remains uncertain. Objective: To assess the diagnostic performance of D-dimer for acute PE and its association with CTPA-defined embolic distribution. Methods: This cross-sectional diagnostic-accuracy study included 70 adults referred for CTPA. D-dimer was measured before anticoagulant or thrombolytic therapy. CTPA served as the reference standard. Group comparisons, correlation analysis, and receiver operating characteristic analysis were performed. Results: CTPA confirmed PE in 31 patients (44.3%). Mean D-dimer levels were higher in PE-positive than PE-negative patients (7084.58 vs 3790.49; p<0.001). The AUC was 0.729 (95% CI 0.584–0.874). A data-derived threshold of ≥9,210 study-recorded units yielded 64.5% sensitivity, 97.4% specificity, and 82.9% accuracy. D-dimer was not significantly associated with embolic level, laterality, or number of involved arterial levels. Conclusion: D-dimer showed moderate diagnostic utility but limited value for estimating anatomical embolic burden.
Keywords:
Article :
INTRODUCTION:
Acute pulmonary embolism (PE) is a potentially life-threatening complication of venous thromboembolism (VTE) and is often difficult to diagnose due to its non-specific clinical presentation. The current European guidelines focus on rapid risk assessment and the use of clinical probability, laboratory testing and imaging to prevent both under-investigation and over-investigation [1].
PE and deep-vein thrombosis are part of the same disease spectrum and remain a significant cause of cardiovascular morbidity and mortality [2]. Common clinical features are dyspnoea, pleuritic chest pain, tachycardia, syncope and haemodynamic instability, none of which is specific enough to make the diagnosis alone [3].
Diagnostic strategies start with the estimation of pretest probability and then proceed to the testing of D-dimer in the appropriate patient. In patients with a low risk of venous thromboembolism, clinical prediction models can safely decrease unnecessary imaging when used in conjunction with D-dimer [4].
Computed tomography pulmonary angiography (CTPA) is the main imaging modality used for suspected acute PE, and allows direct visualization of pulmonary arterial filling defects [5]. The advent of multidetector CT has enhanced the evaluation of the main, lobar, segmental and subsegmental pulmonary arteries and has made CTPA a valuable reference test in clinical practice [6].
Although useful for diagnosis, CTPA is an x-ray procedure that uses both ionizing radiation and iodinated contrast, and the benefit of the procedure is highly dependent on the proper selection of patients. Research comparing D-dimer exclusion strategies to direct CTPA referral has emphasized the importance of not ordering unnecessary imaging, especially in patients with low clinical probability [7]. D-dimer is a degradation product of cross-linked fibrin and is a marker of coagulation and fibrinolysis activation [8].
It is very sensitive for acute venous thromboembolism, but not very specific as levels can be elevated in a variety of other conditions including age, malignancy, infection, inflammation, trauma, surgery, and others [9].
D-dimer is known primarily as an exclusion test, but its association with CTPA-proven PE and embolic distribution is inconsistent. The present study was therefore conducted to compare the levels of D-dimer in patients with and without CTPA-proven PE, to determine the relationship between D-dimer levels and embolic level, laterality and arterial involvement, and to assess the diagnostic discrimination of D-dimer in adults referred for CTPA.
MATERIALS AND METHODS:
Study design and setting
This hospital-based cross-sectional diagnostic-accuracy study was conducted in the Department of Radiodiagnosis, Parul Institute of Medical Sciences and Research, Parul Sevashram Hospital, Vadodara, Gujarat, from December 2024 to December 2025. Computed tomography pulmonary angiography (CTPA) was used as the reference standard for diagnosing acute pulmonary embolism (PE).
Study participants
Adults aged ≥18 years who were consecutively referred for CTPA because of clinical suspicion of acute PE and provided written informed consent were enrolled. Pregnant patients, those with known hypersensitivity to iodinated contrast, and patients with technically inadequate or non-diagnostic CTPA examinations were excluded.
Based on an anticipated institutional referral rate of five to six eligible patients per month, the expected sample size was 60–72 participants over 12 months. A total of 70 participants were included.
Data collection and D-dimer measurement
Demographic characteristics, presenting clinical information, vital signs, and established thromboembolic risk factors—including smoking, immobilization, recent surgery, previous deep-vein thrombosis or PE, malignancy, hormone therapy or oral contraceptive use, trauma, and obesity—were recorded using a structured case-report form.
D-dimer was measured using an automated immunoturbidimetric assay. Blood sampling was performed within 24 hours of CTPA and before initiation of anticoagulant or thrombolytic therapy. D-dimer values were analysed as continuous measurements on the scale recorded in the study data.
CTPA acquisition and interpretation
CTPA was performed using a 16-slice multidetector CT scanner (Alexion 16, Toshiba). Non-ionic iodinated contrast containing iohexol 350 mg iodine/mL was administered at 1.2–1.5 mL/kg through a power injector at 4 mL/s. Scanning was performed with participants supine and their arms raised above the head during a single breath-hold, covering the lungs from base to apex. Acquisition parameters included 120 kV, 85–160 mA, a rotation time of 0.75 seconds, and a pitch of 0.8–1.2. Images were reconstructed at 1-mm slice thickness with a 0.5–1-mm reconstruction interval.
Multiplanar reformations, maximum-intensity projections, and volume-rendered images were reviewed for pulmonary arterial filling defects. CTPA findings were classified according to the presence or absence of PE, most-central embolus level (main, lobar, or segmental/subsegmental), laterality, and number of arterial levels involved. Interpretive discrepancies were resolved by radiologist consensus.
Statistical analysis
Continuous variables were summarized as mean ± standard deviation and median with interquartile range, while categorical variables were presented as n (%). Welch’s independent-samples t test was used to compare age and mean D-dimer levels between patients with and without CTPA-confirmed PE. The Mann–Whitney U test provided a rank-based comparison of D-dimer distributions. Categorical variables were compared using Fisher’s exact test, with odds ratios and 95% confidence intervals reported where appropriate.
Among patients with confirmed PE, D-dimer levels were compared across the most-central embolus levels using the Kruskal–Wallis test and between unilateral and bilateral PE using the Mann–Whitney U test. Spearman’s rank correlation assessed the relationship between D-dimer level and the number of involved arterial levels.
Receiver operating characteristic analysis was performed to evaluate the ability of D-dimer to discriminate CTPA-confirmed PE. The area under the curve and its 95% confidence interval were calculated. An exploratory data-derived threshold was identified using the maximum Youden index, with corresponding sensitivity, specificity, predictive values, likelihood ratios, and overall accuracy. All tests were two-sided, and p<0.05 was considered statistically significant. Analyses were performed using IBM SPSS Statistics version 25.0 and jamovi.
Ethical considerations
The study was approved by the Parul University Institutional Ethics Committee for Human Research (PUIECHR/PIMSR/00/081734/8108; 17 December 2024). Written informed consent was obtained from every participant. Confidentiality was maintained through anonymized data handling, and no investigation or intervention was performed solely for research purposes.
RESULTS:
Seventy patients with suspected acute pulmonary embolism were included in the analysis. The mean age was 51.50 ± 12.55 years (median 52.5; range 21–89 years), and men accounted for n=41 (58.6%). CTPA confirmed pulmonary embolism in n=31 (44.3%; 95% CI 33.2%–55.9%). Age, sex, and the assessed clinical risk factors were not significantly associated with CTPA-confirmed pulmonary embolism (Table 1).
Table 1. Participant characteristics according to CTPA-confirmed pulmonary embolism status
|
Characteristic |
Overall |
PE present |
PE absent |
Effect/test statistic |
p value |
|
Age, years |
51.50 ± 12.55 |
51.03 ± 11.76 |
51.87 ± 13.28 |
Welch t=-0.28; df=67.17 |
0.780 |
|
Male sex |
41 (58.6%) |
22 (71.0%) |
19 (48.7%) |
OR=2.57 (95% CI 0.95–6.98) |
0.087 |
|
Smoking |
21 (30.0%) |
11 (35.5%) |
10 (25.6%) |
OR=1.59 (95% CI 0.57–4.46) |
0.436 |
|
Immobilization |
20 (28.6%) |
11 (35.5%) |
9 (23.1%) |
OR=1.83 (95% CI 0.64–5.22) |
0.295 |
|
Recent surgery |
18 (25.7%) |
9 (29.0%) |
9 (23.1%) |
OR=1.36 (95% CI 0.47–4.00) |
0.594 |
|
Previous DVT/PE |
14 (20.0%) |
6 (19.4%) |
8 (20.5%) |
OR=0.93 (95% CI 0.29–3.03) |
1.000 |
|
Malignancy |
11 (15.7%) |
6 (19.4%) |
5 (12.8%) |
OR=1.63 (95% CI 0.45–5.95) |
0.520 |
|
Hormone therapy/OCP use |
9 (12.9%) |
2 (6.5%) |
7 (17.9%) |
OR=0.32 (95% CI 0.06–1.64) |
0.281 |
|
Trauma |
18 (25.7%) |
7 (22.6%) |
11 (28.2%) |
OR=0.74 (95% CI 0.25–2.22) |
0.784 |
|
Obesity |
8 (11.4%) |
4 (12.9%) |
4 (10.3%) |
OR=1.30 (95% CI 0.30–5.66) |
1.000 |
Data are n (%) or mean ± SD. Percentages in the PE-present and PE-absent columns are column percentages. Odds ratios compare the listed characteristic with its absence; male sex is compared with female sex. Welch’s t test was used for age and Fisher’s exact test for categorical variables. CI, confidence interval; CTPA, computed tomography pulmonary angiography; DVT, deep-vein thrombosis; OCP, oral contraceptive pill; OR, odds ratio; PE, pulmonary embolism.
CTPA distribution
Among the 31 patients with CTPA-confirmed pulmonary embolism, the most-central embolus level was lobar in n=12 (38.7%), segmental/subsegmental in n=12 (38.7%), and the main pulmonary artery in n=7 (22.6%). When all involved arterial levels were considered, lobar branches were affected in n=19 (61.3%) and segmental/subsegmental branches in n=16 (51.6%). Emboli were bilateral in n=20 (64.5%) and involved a single arterial level in n=22 (71.0%) (Table 2).
Table 2. Anatomical distribution of pulmonary embolism on CTPA
|
Imaging domain |
Category |
n (%) |
|
Most-central embolus level |
Main pulmonary artery |
7 (22.6%) |
|
Most-central embolus level |
Lobar |
12 (38.7%) |
|
Most-central embolus level |
Segmental/subsegmental |
12 (38.7%) |
|
Any arterial involvement* |
Main pulmonary artery |
7 (22.6%) |
|
Any arterial involvement* |
Lobar branches |
19 (61.3%) |
|
Any arterial involvement* |
Segmental/subsegmental branches |
16 (51.6%) |
|
Number of arterial levels involved |
One |
22 (71.0%) |
|
Number of arterial levels involved |
Two |
7 (22.6%) |
|
Number of arterial levels involved |
Three |
2 (6.5%) |
|
Laterality |
Unilateral |
11 (35.5%) |
|
Laterality |
Bilateral |
20 (64.5%) |
Percentages use the 31 participants with CTPA-confirmed pulmonary embolism as the denominator. *Arterial involvement categories are non-exclusive; percentages therefore do not sum to 100%. CTPA, computed tomography pulmonary angiography.
D-dimer and CTPA-confirmed pulmonary embolism
D-dimer levels were higher in patients with CTPA-confirmed pulmonary embolism than in those without pulmonary embolism (7084.58 ± 4196.99 vs 3790.49 ± 2339.82; mean difference 3294.09, 95% CI 1598.14–4990.04; Welch’s t=3.913, p<0.001). The rank-based comparison was concordant (Mann–Whitney U=881.5, p=0.001) (Table 3; Figure 1).
Table 3. Comparison of D-dimer levels by CTPA-confirmed pulmonary embolism status
|
Measure |
PE present |
PE absent |
Effect estimate |
Test statistic |
p value |
|
Mean ± SD |
7084.58 ± 4196.99 |
3790.49 ± 2339.82 |
Mean difference 3294.09 |
Welch t=3.913; |
<0.001 |
|
Median (IQR) |
9360 (1970.0–9657.5) |
3490 (3360.0–3620.0) |
— |
Mann–Whitney U=881.5 |
0.001 |
|
Range |
336–12810 |
200–9380 |
— |
— |
— |
D-dimer values are presented on the measurement scale recorded in the study dataset. CI, confidence interval; CTPA, computed tomography pulmonary angiography; IQR, interquartile range; PE, pulmonary embolism; SD, standard deviation.
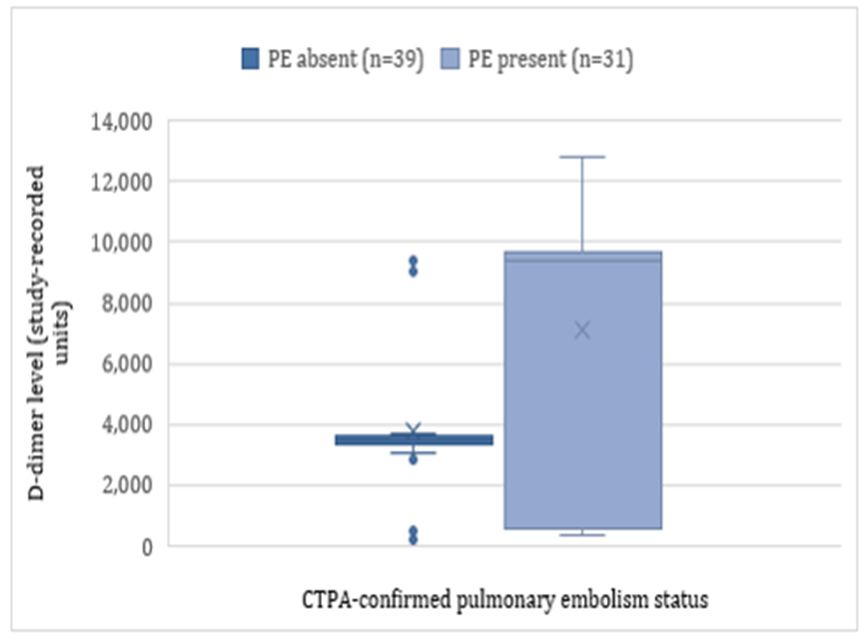
Figure 1. Distribution of D-dimer levels according to CTPA-confirmed pulmonary embolism status. Boxes show the median and interquartile range, whiskers extend to 1.5 times the interquartile range, and points represent individual participants.
D-dimer and embolic distribution
Within the pulmonary embolism-positive group, D-dimer levels did not differ significantly by the most-central embolus level (Kruskal–Wallis H=2.748, p=0.253) or laterality (Mann–Whitney U=91.5, p=0.457). D-dimer also showed no significant correlation with the number of involved arterial levels (Spearman rs=0.157, p=0.400) (Table 4).
Table 4. Association between D-dimer levels and CTPA-defined embolic distribution among PE-positive participants
|
CTPA feature |
D-dimer summary, median (IQR) |
Test statistic |
p value |
|
Most-central embolus level |
Main: n=7, 9685 (9395–9905) |
Kruskal–Wallis H=2.748 |
0.253 |
|
Laterality |
Bilateral: n=20, 9310 (2658.8–9522.2) |
Mann–Whitney U=91.5 |
0.457 |
|
Number of arterial levels involved |
Correlation between D-dimer level and number of involved arterial levels (1–3) |
Spearman rank correlation=0.157 |
0.400 |
Analyses were restricted to the 31 participants with CTPA-confirmed pulmonary embolism. D-dimer values are presented on the measurement scale recorded in the study dataset. CTPA, computed tomography pulmonary angiography; IQR, interquartile range; PE, pulmonary embolism.
Discrimination of CTPA-confirmed pulmonary embolism
ROC analysis demonstrated moderate discrimination of CTPA-confirmed pulmonary embolism by D-dimer, with an AUC of 0.729 (95% CI: 0.584–0.874; p=.002). The maximum Youden index identified a data-derived cutoff of ≥9,210 study-recorded units, providing 64.5% sensitivity, 97.4% specificity, 95.2% positive predictive value, 77.6% negative predictive value, and 82.9% overall accuracy. (Figure2)
Combined ROC Curves
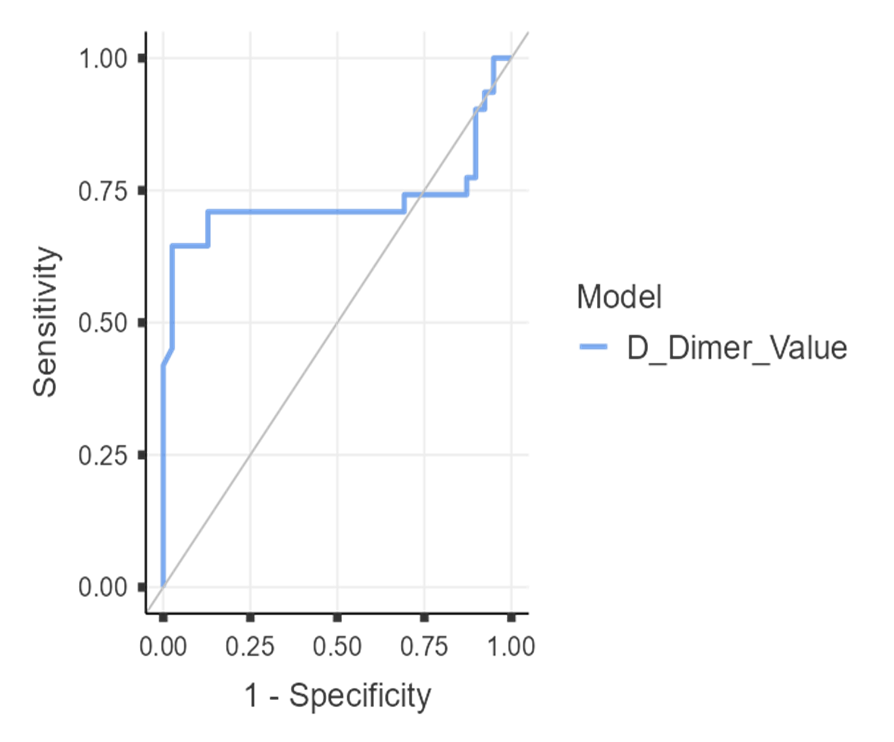
Figure 2. Receiver operating characteristic curve showing the diagnostic performance of D-dimer for identifying CTPA-confirmed pulmonary embolism. The area under the curve was 0.729 (95% CI: 0.584–0.874; p=.002), indicating moderate discriminatory ability. The diagonal line represents no discrimination.
DISCUSSION:
In this diagnostic-accuracy study performed in a hospital setting, CTPA was used to confirm the diagnosis of acute pulmonary embolism in 31 of 70 patients (44.3%). Patients with PE had significantly elevated D-dimer levels compared to those without PE, and moderate discrimination was achieved with ROC analysis (AUC 0.729).
The exploratory threshold of ≥9,210 study-recorded units had a high specificity (97.4%) and positive predictive value (95.2%), but a low sensitivity (64.5%).
There was no significant correlation between D-dimer and the most central level of embolus, laterality or the number of arterial levels involved. The results of this study indicate that D-dimer should be used in conjunction with clinical evaluation and CTPA and not as a diagnostic or anatomical severity marker.
The high CTPA positivity rate in our cohort probably reflects selective referral of patients with substantial clinical suspicion. In the Christopher study, van Belle et al. prospectively evaluated 3,306 patients using a dichotomized Wells rule, D-dimer testing, and CT.
In patients with an “unlikely” clinical probability and a normal D-dimer, PE was excluded without imaging and the three-month thromboembolic event rate after a negative diagnostic strategy was low. They showed that the structured pathway was most useful when used in conjunction with formal pretest-probability assessment, and not as a standalone test, for the use of D-dimer [10].
This principle was extended by the ADJUST-PE study. In patients with non-high clinical probability, Righini et al. prospectively validated an age-adjusted D-dimer threshold. In patients ≥75 years of age, age adjustment raised the number of patients in whom PE could be excluded from 6.4% to 29.7% without any additional false-negative events.
These results differ from our data-derived high threshold, which maximized specificity instead of exclusion sensitivity. Our threshold was chosen from a small number of participants (70) and was not associated with clinical probability or age, so should not be considered a rule-out threshold [11].
The use of probability-adapted strategies has also minimized unnecessary CTPA. PE was diagnosed at baseline in 13% of the 3,465 evaluable patients in the prospective YEARS study. In untreated patients in whom PE was initially ruled out, 0.61% developed symptomatic venous thromboembolism in three months.
The YEARS algorithm did not require CTPA in 48% of patients, whereas the Wells rule and a fixed threshold of 500 ng/mL required CTPA in 34%. These results highlight the need for different thresholds for D-dimer depending on clinical probability, while our study evaluated biomarker discrimination after patients were referred for CTPA [12].
Likewise, Kearon et al. assessed the PEGeD strategy, with a D-dimer threshold of < 1,000 ng/mL in patients with low clinical pretest probability and < 500 ng/mL in those with moderate clinical pretest probability. The strategy was safe and avoided imaging and anticoagulation in appropriately selected outpatients and reduced the use of chest imaging compared to conventional fixed-threshold strategies.
This is a stark contrast to our exploratory threshold sensitivity of 64.5%, which further supports the notion that a highly specific threshold may be useful to identify patients at risk for PE, but should not be used as a safe alternative to validated exclusion pathways [13].
However, our finding of a significantly elevated D-dimer in PE-positive patients is consistent with studies of quantitative
D-dimer levels. Hochuli et al. reported that higher concentrations were correlated with a higher median pulmonary arterial clot score (11 vs. 5) and a higher percentage of patients with extensive obstruction scores >10 (53% vs. 16%).
Main pulmonary artery thrombi were also more common above this D-dimer level (37% vs. 9%). Our D-dimer levels, on the other hand, were not significantly different between central embolus level or laterality.
This difference could be due to the smaller number of PE-positive patients, the lack of formal assessment of obstruction scores, the differences in the assays, and the skewing of many values towards the upper end of the recorded distribution [14].
A moderate but statistically significant correlation between D-dimer and CTPA clot burden (r=0.36) was also reported by Jeebun et al. Their study also correlated radiological severity with selected clinical and biomarker variables, indicating that D-dimer might be a marker of the overall thrombotic burden, but not sufficiently specific for anatomical localization. Our correlation with the number of involved arterial levels was less strong and non-significant (rs=0.157), suggesting that simple counts of involved levels may not be as accurate as validated obstruction indices [15] in reflecting the volume of thrombus.
Ji et al. compared D-dimer with radiological severity, measured by the Mastora obstruction score, and found a positive correlation between D-dimer concentration, clot burden, and right ventricular dysfunction on CTPA. Their results suggest that quantitative obstruction scoring can show associations that are not detected if PE is scored only as main, lobar or segmental.
The lack of such a relationship in our cohort should not therefore be interpreted as evidence that D-dimer is unrelated to thrombus burden, but rather that D-dimer did not differentiate the relatively broad anatomical categories used in the present analysis [16].
Similarly, Geissenberger et al. showed that increased D-dimer levels correlated with established clinical, laboratory and radiological markers of the severity of acute PE, but were not reliable predictors of long-term outcome. Their analysis points to an important difference between diagnostic presence, anatomical burden, haemodynamic severity and prognosis. We studied the first two domains, and found moderate diagnostic discrimination, but no clear anatomical gradient, and did not evaluate outcomes like right ventricular dysfunction, treatment escalation, recurrence, or mortality [17].
The moderate AUC seen in our cohort is clinically plausible as D-dimer is a marker of fibrin formation and degradation, and not specific to pulmonary arterial thrombosis. The high overlap of the PE-positive and PE-negative distributions may be due to other reasons for increased D-dimer in patients referred for imaging.
Other patients with anatomically small or older emboli may have lower levels, however. The high positive predictive value at the exploratory threshold was also affected by the high prevalence of PE (44.3%) and would likely be lower in lower prevalence settings.
This study has several strengths. D-dimer sampling was done within 24 hours of CTPA and prior to anticoagulant or thrombolytic therapy, all examinations were analyzed with a standardized multidetector protocol, and both distributional and ROC analyses were conducted. The study also explored if D-dimer was a marker of embolic location and extent beyond the presence of PE.
This study had few limitations also. The single-centre sample was small, with only 31 PE-positive patients, reducing power for subgroup comparisons. The study did not incorporate a validated pretest-probability score into the diagnostic-accuracy analysis, and the D-dimer measurement units require explicit clarification before publication.
The data-derived threshold was selected and evaluated in the same cohort and is therefore susceptible to optimism and should not be recommended clinically without external validation. Embolic burden was classified by anatomical level and laterality rather than a validated obstruction score, while age-adjusted thresholds, right ventricular findings, clinical severity, and follow-up outcomes were not evaluated.
CONCLUSION:
D-dimer levels were significantly higher in patients with CTPA-confirmed pulmonary embolism and showed moderate diagnostic discrimination. However, the limited sensitivity of the exploratory threshold and the absence of a consistent association with embolic distribution indicate that D-dimer should complement, rather than replace, clinical assessment and CTPA.
REFERENCES:
1. Konstantinides SV, Meyer G, Becattini C, et al. 2019 ESC Guidelines for the diagnosis and management of acute pulmonary embolism developed in collaboration with the European Respiratory Society. Eur Heart J. 2020;41(4):543–603.
2. Goldhaber SZ, Bounameaux H. Pulmonary embolism and deep vein thrombosis. Lancet. 2012;379(9828):1835–1846.
3. Stein PD, Henry JW. Clinical characteristics of patients with acute pulmonary embolism stratified according to their presenting syndromes. Chest. 1997 Oct;112(4):974-9. doi: 10.1378/chest.112.4.974.
4. Wells PS, Anderson DR, Rodger M, et al. Evaluation of D-dimer in the diagnosis of suspected deep-vein thrombosis. N Engl J Med. 2003;349(13):1227–1235.
5. Remy-Jardin M, Remy J. Spiral CT angiography of the pulmonary circulation. Radiology. 1999;212(3):615–636.
6. Stein PD, Fowler SE, Goodman LR, et al. Multidetector computed tomography for acute pulmonary embolism. N Engl J Med. 2006;354(22):2317–2327.
7. Eng CW, Wansaicheong G, Goh SK, Earnest A, Sum C. Exclusion of acute pulmonary embolism: computed tomography pulmonary angiogram or D-dimer. Singapore Med J. 2009;50(4):403–406.
8. Adam SS, Key NS, Greenberg CS. D-dimer antigen: current concepts and future prospects. Blood. 2009;113(13):2878–2887.
9. Righini M, Perrier A, De Moerloose P, Bounameaux H. D-dimer for venous thromboembolism diagnosis: 20 years later. J Thromb Haemost. 2008;6(7):1059–1071.
10. van Belle A, Büller HR, Huisman MV, et al. Effectiveness of managing suspected pulmonary embolism using an algorithm combining clinical probability, D-dimer testing, and computed tomography. JAMA. 2006;295(2):172–179. doi:10.1001/jama.295.2.172
11. Righini M, Van Es J, Den Exter PL, et al. Age-adjusted D-dimer cutoff levels to rule out pulmonary embolism: the ADJUST-PE study. JAMA. 2014;311(11):1117–1124. doi:10.1001/jama.2014.2135
12. van der Hulle T, Cheung WY, Kooij S, et al. Simplified diagnostic management of suspected pulmonary embolism: the YEARS study. Lancet. 2017;390(10091):289–297. doi:10.1016/S0140-6736(17)30885-1
13. Kearon C, de Wit K, Parpia S, et al. Diagnosis of pulmonary embolism with D-dimer adjusted to clinical probability. N Engl J Med. 2019;381(22):2125–2134. doi:10.1056/NEJMoa1909159
14. Hochuli M, Duewell S, Frauchiger B. Quantitative D-dimer levels and the extent of venous thromboembolism in CT angiography and lower-limb ultrasonography. Vasa. 2007;36(4):267–274. doi:10.1024/0301-1526.36.4.267
15. Jeebun V, Doe SJ, Singh L, Worthy SA, Forrest IA. Are clinical parameters and biomarkers predictive of severity of acute pulmonary emboli on CTPA? QJM. 2010;103(2):91–97. doi:10.1093/qjmed/hcp162
16. Ji Y, Sun B, Juggessur-Mungur KS, Li Z, Zhang Z. Correlation of D-dimer level with the radiological severity indexes of pulmonary embolism on computed tomography pulmonary angiography. Chin Med J. 2014;127(11):2025–2029. doi:10.3760/cma.j.issn.0366-6999.20133021
17. Geissenberger F, Schwarz F, Probst M, et al. D-Dimer predicts disease severity but not long-term prognosis in acute pulmonary embolism. Clin Appl Thromb Hemost. 2019;25:1076029619863495. doi:10.1177/1076029619863495