Analysis of Lipid and Lipoprotein Profile in HIV-Infected and Non-HIV-Infected Diabetic Patients.
- Karri Satya S.L. Narasimha Murthy , Postgraduate, Department of General Medicine, JSS Medical College, Mysuru, Karnataka, India.
- Rajendra Prasad , Associate Professor, Department of General Medicine, JSS Medical College, Mysuru, Karnataka, India.
Article Information:
Abstract:
Background: Dyslipidemia is a common metabolic abnormality in patients with diabetes mellitus and may be further influenced by HIV (Human Immunodeficiency Virus) infection and ART (Anti-Retroviral Therapy). Alterations in lipid and lipoprotein profiles increase the risk of cardiovascular disease and contribute significantly to morbidity among diabetic patients. This study was undertaken to compare lipid and lipoprotein abnormalities between HIV-infected diabetic patients and non-HIV-infected diabetic patients and to evaluate the influence of ART duration on lipid parameters. Methods: An observational case-control study was conducted over 18 months in a tertiary care hospital. A total of 120 diabetic patients were enrolled using purposive sampling, including 60 HIV-positive diabetics and 60 HIV-negative diabetics. Participants were recruited from outpatient, inpatient, and Master Health Check-up departments. Statistical analysis was performed using SPSS version 28, with p<0.05 considered significant. Results: The mean total cholesterol and LDL levels were significantly higher among HIV-positive diabetics (171.74±32.15 mg/dL and 107.22±30.29 mg/dL, respectively) compared with HIV-negative diabetics (140.68±29.94 mg/dL and 73.29±35.41 mg/dL; p<0.001). Conversely, triglycerides and VLDL levels were significantly lower in HIV-positive diabetics (125.65±58.88 mg/dL and 24.52±11.40 mg/dL) than in HIV-negative diabetics (164.93±80.81 mg/dL and 33.09±16.18 mg/dL; p=0.003 and p=0.001, respectively). HDL levels did not differ significantly between groups (p=0.503). HIV-positive patients receiving ART for more than five years demonstrated lower total cholesterol, LDL, TG, and VLDL levels compared to those on ART for shorter durations, indicating a favorable effect of prolonged ART on lipid parameters. Conclusion: HIV infection significantly influences lipid and lipoprotein profiles in diabetic patients. HIV-positive diabetics exhibited higher total cholesterol and LDL levels, while triglyceride and VLDL levels were lower compared to HIV-negative diabetics. Longer duration of ART was associated with improved lipid parameters. Routine lipid monitoring and individualized management strategies are essential to reduce cardiovascular risk among HIV-infected diabetic patients.
Keywords:
Article :
INTRODUCTION:
The interaction between lipid metabolism and chronic diseases has gained increasing attention, particularly among individuals living with HIV (Human Immunodeficiency Virus) who are receiving long-term ART (Anti-Retroviral Therapy). Dyslipidemia is a common metabolic complication in both HIV infection and DM (Diabetes Mellitus), and the coexistence of these conditions can further increase the risk of CVD (Cardiovascular Disease). Understanding the lipid and lipoprotein profiles of HIV-infected diabetic patients compared with non-HIV-infected diabetic individuals is essential for developing effective management strategies.
HIV infection is associated with alterations in lipid metabolism characterized by elevated TG (Triglycerides), TC (Total Cholesterol), and LDL-C (Low-Density Lipoprotein Cholesterol), along with reduced HDL-C (High-Density Lipoprotein Cholesterol). These abnormalities contribute to an increased risk of cardiovascular complications. Although ART has substantially improved survival among HIV-infected individuals, certain regimens, particularly those containing PIs (Protease Inhibitors) and NRTIs (Nucleoside Reverse Transcriptase Inhibitors), have been shown to exacerbate dyslipidemia by increasing TG and TC levels while lowering HDL-C concentrations.[1]
The duration of ART also plays an important role in the severity of lipid abnormalities. Patients receiving ART for more than two years have been reported to exhibit significantly higher TC, LDL-C, and TG levels than those with shorter treatment duration.[2] Even in the absence of ART, HIV infection can produce moderate lipid disturbances through direct viral effects and chronic inflammation, although these changes are generally less pronounced than those observed in treated individuals.[3]. Diabetes mellitus itself is characterized by elevated TG, reduced HDL-C, and, in some cases, increased TC and LDL-C, all of which contribute to heightened cardiovascular risk. The coexistence of HIV infection and diabetes can further aggravate these lipid abnormalities. Studies have demonstrated a high prevalence of dyslipidemia among both HIV-infected and non-HIV-infected diabetic patients, emphasizing the need for comprehensive metabolic assessment in these populations.[4]. The combined effects of HIV infection, ART exposure, and diabetes create distinct patterns of dyslipidemia that require targeted interventions. Comparing lipid profiles between HIV-infected diabetic patients and non-HIV-infected diabetic individuals is therefore crucial for optimizing treatment strategies and reducing long-term cardiovascular risk.[5,6]
Aims and Objectives
The study aimed to evaluate lipid and lipoprotein abnormalities among diabetic patients with and without HIV infection and to identify the independent predictor variables associated with abnormal lipid and lipoprotein profiles. The objectives are to determine the independent predictors of dyslipidemia in HIV-infected and non-HIV-infected diabetic patients and to compare the pattern and prevalence of lipid and lipoprotein abnormalities between diabetic patients with HIV infection and those without HIV infection.
MATERIALS AND METHODS:
Study Design
This study was conducted as an observational case-control study over a period of 18 months to compare lipid and lipoprotein profiles between HIV-infected diabetic patients and non-HIV diabetic patients. Participants were selected using a purposive sampling technique, a non-probability sampling method that facilitated the targeted recruitment of eligible individuals who met the predefined inclusion and exclusion criteria, thereby ensuring the selection of appropriate study subjects relevant to the study objectives.
Inclusion and Exclusion Criteria
The study included adults aged 18 years and above who were diagnosed with diabetes mellitus, comprising HIV-infected patients receiving ART for at least one year and non-HIV-infected diabetic patients. Patients with active opportunistic infections and those currently receiving lipid-lowering therapy were excluded from the study. These eligibility criteria were established to ensure a relatively homogeneous study population and to minimize the influence of confounding factors, such as acute infections and pharmacological lipid modification, thereby enabling a more accurate assessment of the effect of HIV status and ART on lipid and lipoprotein profiles.
Sample Size Calculation
The sample size was calculated based on the prevalence of dyslipidemia in the target population, estimated at 8%. Using the formula for sample size estimation in prevalence studies:
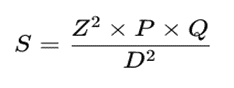
Where:
● Z=1.96Z = 1.96Z=1.96 (standard normal deviate at 5% significance level),
● P=0.08P = 0.08P=0.08 (estimated prevalence),
● Q=1−P=0.92Q = 1 - P = 0.92Q=1−P=0.92,
● D=0.05D = 0.05D=0.05 (margin of error).
● Calculation
● S= (1.96)2×0.08×0.92(0.05)2=113≈120 samples = \frac{(1.96)^2 \times 0.08 \times 0.92}{(0.05)^2} = 113\approx. 120 \text{samples} S=(0.05)2(1.96)2×0.08×0.92=113≈120 samples
Data Collection Procedure
Data were collected from eligible participants attending the General Medicine Outpatient and Inpatient Departments and the Master Health Check-up Outpatient Department after obtaining informed consent. Each participant underwent a detailed clinical history and physical examination, followed by anthropometric measurements, including height and weight for calculating BMI (Body Mass Index), and standardized measurement of systolic and diastolic blood pressure. Fasting venous blood samples were collected and analyzed using validated laboratory methods to assess lipid and lipoprotein profiles, including total cholesterol, triglycerides, LDL-C, and HDL-C. Lipid abnormalities were classified according to WHO dyslipidemia guidelines and compared between HIV-infected diabetic patients and non-HIV diabetic patients to evaluate the association of HIV status with alterations in lipid profiles.
Statistical Analysis
The collected data were entered into Microsoft Excel 2010 and analyzed using SPSS for Windows version 28. Continuous variables, including lipid levels, BMI, and blood pressure, were summarized as mean ± standard deviation (SD), while categorical variables were presented as frequencies and percentages. The chi-square test was used to compare categorical variables, the independent samples t-test was applied to compare the means between the two study groups, and logistic regression analysis was performed to identify independent predictors of abnormal lipid and lipoprotein profiles. A p-value of less than 0.05 was considered statistically significant, and the findings were presented in tables and graphs for clear interpretation.
RESULTS:
Table 1: Demographic Characteristics of Study Participants According to HIV Status
|
Variable |
HIV Positive Diabetic (n=60) |
HIV Negative Diabetic (n=60) |
P-value |
|
Age 20–30 yrs |
4 (6.7%) |
2 (3.3%) |
0.559 |
|
Age 30–40 yrs |
14 (23.3%) |
15 (25.0%) |
|
|
Age 40–50 yrs |
29 (48.3%) |
14 (23.3%) |
|
|
Age >50 yrs |
13 (21.7%) |
29 (48.3%) |
|
|
Male |
39 (65.0%) |
42 (70.0%) |
Not significant |
|
Female |
21 (35.0%) |
18 (30.0%) |
Table 1 illustrates the demographic profile of the study participants. The majority of HIV-positive diabetics belonged to the 40–50 years age group, whereas most HIV-negative diabetics were above 50 years. Male predominance was observed in both groups. No significant association was found between age group and HIV status.
Table 2: Lifestyle Characteristics and Duration of Diabetes Mellitus
|
Variable |
HIV Positive Diabetic (n=60) |
HIV Negative Diabetic (n=60) |
P-value |
|
Alcohol Use – Yes |
26 (43.0%) |
28 (47.0%) |
0.714 |
|
Alcohol Use – No |
34 (57.0%) |
32 (53.0%) |
|
|
DM Duration <1 year |
5 (8.3%) |
3 (5.0%) |
0.175 |
|
DM Duration 1–3 years |
22 (36.7%) |
20 (33.3%) |
|
|
DM Duration 3–5 years |
10 (16.7%) |
4 (6.7%) |
|
|
DM Duration >5 years |
23 (38.3%) |
33 (55.0%) |
Table 2 shows alcohol consumption history and duration of diabetes among study participants. Alcohol use was similarly distributed in both groups. Most participants had diabetes for more than five years, with no statistically significant difference between the groups.
Table 3: Comparison of Anthropometric Measurements between Study Groups
|
Parameter |
HIV Positive Diabetic |
HIV Negative Diabetic |
P-value |
|
Waist Circumference (cm) |
84.68 ± 6.42 |
87.03 ± 6.55 |
0.050 |
|
Height (m) |
1.64 ± 0.09 |
1.61 ± 0.12 |
0.166 |
|
Weight (kg) |
62.18 ± 11.31 |
62.55 ± 12.13 |
0.864 |
|
BMI (kg/m²) |
23.17 ± 3.39 |
23.84 ± 4.76 |
0.372 |
Table 3 compares anthropometric parameters between HIV-positive and HIV-negative diabetic patients. Waist circumference demonstrated a borderline significant difference, whereas height, weight, and BMI were comparable between the groups.
Table 4: Comparison of Lipid Profile Parameters between HIV Positive and HIV Negative Diabetic Individuals
|
Lipid Parameter |
HIV Positive Diabetic |
HIV Negative Diabetic |
P-value |
|
Total Cholesterol (mg/dL) |
171.74 ± 32.15 |
140.68 ± 29.94 |
<0.001* |
|
Triglycerides (mg/dL) |
125.65 ± 58.88 |
164.93 ± 80.81 |
0.003* |
|
HDL (mg/dL) |
40.03 ± 1.91 |
39.66 ± 3.90 |
0.503 |
|
LDL (mg/dL) |
107.22 ± 30.29 |
73.29 ± 35.41 |
<0.001* |
|
VLDL (mg/dL) |
24.52 ± 11.40 |
33.09 ± 16.18 |
0.001* |
|
*Significant at p<0.05 |
|||
Table 4 demonstrates significant differences in lipid profiles between the two groups. HIV-positive diabetics had significantly higher total cholesterol and LDL levels, while triglyceride and VLDL levels were significantly higher among HIV-negative diabetics. HDL levels were similar in both groups.
Table 5: Comparison of Glycemic and Blood Pressure Parameters
|
Parameter |
HIV Positive Diabetic |
HIV Negative Diabetic |
P-value |
|
Fasting Blood Sugar (mg/dL) |
118.62 ± 23.06 |
138.37 ± 33.05 |
<0.001* |
|
Diastolic Blood Pressure (mmHg) |
82.52 ± 5.56 |
81.60 ± 5.19 |
0.353 |
Table 5 observes that HIV-negative diabetic patients had significantly higher fasting blood sugar levels compared to HIV-positive diabetics. However, diastolic blood pressure did not differ significantly between the groups.
Table 6: Duration of Antiretroviral Therapy (ART) Among HIV Positive Diabetic Patients
|
Duration of ART |
Frequency (n=60) |
Percentage |
|
<1 year |
2 |
3.3% |
|
1–3 years |
19 |
31.7% |
|
3–5 years |
10 |
16.7% |
|
>5 years |
29 |
48.3% |
Table 6 illustrates the distribution of ART duration among HIV-positive diabetic patients. Nearly half of the participants had been receiving ART for more than five years, indicating long-term treatment exposure.
Table 7: Association of ART Duration and Immune Status with Lipid Profile Among HIV Positive Diabetic Patients
|
A. ART Duration and Lipid Profile |
|||||||
|
ART Duration |
Total Cholesterol |
TG |
HDL |
LDL |
VLDL |
||
|
<1 year |
204.9 |
134.6 |
41.0 |
137.0 |
26.9 |
||
|
1–3 years |
178.7 |
129.6 |
40.2 |
113.1 |
25.2 |
||
|
3–5 years |
178.0 |
173.3 |
40.0 |
103.4 |
34.7 |
||
|
>5 years |
162.8 |
107.6 |
39.9 |
102.3 |
20.7 |
||
|
B. CD4 Count Distribution |
|||||||
|
CD4 Count (cells/mm³) |
Frequency |
Percentage |
|||||
|
<200 |
4 |
6.7% |
|||||
|
200–499 |
34 |
56.7% |
|||||
|
≥500 |
22 |
36.7% |
|||||
Table 7 shows that lipid profile parameters varied according to ART duration. Patients on ART for more than five years had comparatively lower total cholesterol and LDL levels, suggesting a favorable lipid profile with prolonged therapy. The CD4 count distribution revealed that most participants had moderate immune status (200–499 cells/mm³), while over one-third maintained satisfactory immune function (≥500 cells/mm³).
DISCUSSION:
The present study compared lipid and lipoprotein profiles between 60 HIV-positive diabetic patients and 60 HIV-negative diabetic patients to evaluate the influence of HIV infection and ART on lipid metabolism. Although demographic characteristics were largely comparable between the groups, significant differences were observed in lipid parameters, glycemic control, and ART-related outcomes.
The majority of HIV-positive diabetics belonged to the 40–50-year age group (48.3%), whereas 48.3% of HIV-negative diabetics were aged over 50 years, with no significant difference in age distribution (p=0.559). Male predominance was evident in both groups (65% vs. 70%), consistent with previous reports from Dehong, China, where males constituted 53.8% of HIV patients with diabetes,[7] and Saudi Arabia, where 84.01% of HIV patients with diabetes were male.[8] Similarly, alcohol consumption did not differ significantly between groups (43% vs. 47%, p=0.714), indicating comparable lifestyle characteristics.
The most important findings of this study relate to lipid abnormalities. HIV-positive diabetic patients exhibited significantly higher total cholesterol (171.74 ± 32.15 mg/dL) and LDL cholesterol (107.22 ± 30.29 mg/dL) than HIV-negative diabetics (140.68 ± 29.94 mg/dL and 73.29 ± 35.41 mg/dL, respectively; p<0.001). These findings support evidence that HIV infection and ART contribute to dyslipidemia, increasing cardiovascular risk. Lee et al. emphasized that dyslipidemia management in HIV patients requires conventional lipid-lowering therapy while accounting for ART-related drug interactions.[9]
In contrast, HIV-negative diabetics demonstrated significantly higher triglycerides (164.93 ± 80.81 mg/dL) and VLDL (33.09 ± 16.18 mg/dL) compared with HIV-positive diabetics (125.65 ± 58.88 mg/dL and 24.52 ± 11.40 mg/dL; p=0.003 and p=0.001). HDL levels remained similar in both groups (p=0.503). While Lamon-Fava and Schaefer reported that HIV infection generally raises triglycerides and lowers LDL and HDL, particularly with protease inhibitor-based ART,[10] Roberts et al. similarly observed increases in total cholesterol, triglycerides, and LDL after indinavir therapy, with minimal changes in HDL.[11]
Anthropometric measurements showed only a borderline difference in waist circumference, with HIV-negative diabetics having a slightly higher mean waist circumference (87.03 ± 6.55 cm vs. 84.68 ± 6.42 cm, p=0.050), while BMI, height, and weight remained comparable.
An interesting observation was the better glycemic control among HIV-positive diabetics, who had significantly lower fasting blood sugar (118.62 ± 23.06 mg/dL) than HIV-negative diabetics (138.37 ± 33.05 mg/dL, p<0.001). This finding may reflect improved treatment adherence and regular follow-up through ART clinics. Han et al. similarly reported better glycemic outcomes among HIV-positive patients,[12] although another cohort study found that only 52.3% achieved HbA1c values ≤7%, highlighting ongoing challenges in diabetes management.[13]
Duration of diabetes and diastolic blood pressure were similar between groups, differing from the findings of Melaku et al., who reported high rates of uncontrolled blood pressure among both HIV-positive and HIV-negative patients.[14]
Within the HIV-positive group, ART duration showed a meaningful relationship with lipid metabolism. Nearly 48.3% had received ART for more than five years, and longer ART exposure was associated with lower total cholesterol, LDL, triglycerides, and VLDL levels. The association was significant for VLDL (p=0.028) and for overall lipid profile improvement (p=0.011). These findings suggest that prolonged ART may stabilize lipid abnormalities through sustained viral suppression and improved immune recovery. Previous studies have similarly emphasized that newer ART regimens have fewer adverse lipid effects and that cardiovascular risk assessment should incorporate both traditional and HIV-specific factors.[15,16]
The immune profile further supports these findings. Most HIV-positive patients had CD4 counts between 200–499 cells/mm³ (56.7%), while 36.7% had counts ≥500 cells/mm³, indicating relatively preserved immune function. Only 6.7% had CD4 counts below 200 cells/mm³, suggesting that severe immunosuppression was uncommon.
The present findings closely align with previous literature on HIV-associated dyslipidemia. Woyesa et al. reported higher rates of hypercholesterolemia and hypertriglyceridemia among HIV-infected diabetic patients,[17] while Zhang et al. demonstrated that ART-related alterations in plasma lipid species contribute to diabetes risk.[18] Sydney et al. further showed that Integrase Strand Transfer Inhibitor-based regimens influence lipid metabolism,[4] whereas Ohunene et al. highlighted that dyslipidemia is common even before ART initiation, underscoring the independent role of HIV infection.[19] Similarly, Di Yacovo et al. observed improvements in LDL particle characteristics and inflammatory markers following ART initiation,[20] supporting the favorable lipid trends observed among long-term ART users in this study.
Patients receiving ART for more than five years demonstrated lower total cholesterol (162.8 mg/dL), triglycerides (107.6 mg/dL), LDL (102.3 mg/dL), and VLDL (20.7 mg/dL), suggesting clinically meaningful metabolic benefits. In addition, statin therapy may provide dual benefits by reducing lipid levels and modulating chronic HIV-associated inflammation.[21] Overall, the relatively preserved immune status of the study population, reflected by predominantly moderate CD4 counts, indicates that the observed metabolic changes were likely influenced more by ART and chronic HIV management than by advanced HIV disease itself.[22]
This study demonstrates that HIV-positive diabetic patients exhibit a distinct pattern of dyslipidemia characterized by elevated total cholesterol and LDL cholesterol, whereas HIV-negative diabetics show higher triglyceride and VLDL levels. Longer ART exposure appears to improve lipid parameters, reinforcing the importance of sustained ART adherence, routine lipid monitoring, and comprehensive cardiovascular risk assessment in the long-term management of diabetic patients living with HIV.
Limitations
This study has certain limitations. It was conducted at a single tertiary care center with a relatively small sample size, which may limit the generalizability of the findings. The use of purposive sampling may have introduced selection bias. The cross-sectional study design precludes establishing causal relationships between HIV status, ART duration, and lipid abnormalities. Additionally, potential confounding factors such as diet, physical activity, genetic predisposition, and ART adherence were not assessed. The exclusion of patients receiving lipid-lowering therapy may have underestimated the overall burden of dyslipidemia in the study population.
CONCLUSION:
The present study demonstrated significant differences in lipid profiles between HIV-positive and HIV-negative diabetic patients, with higher total cholesterol and LDL levels observed in the HIV-positive group, while triglyceride and VLDL levels were lower and HDL levels remained comparable. A longer duration of ART was associated with a more favorable lipid profile, suggesting a potential beneficial effect of sustained treatment on metabolic outcomes. These findings emphasize the importance of regular lipid monitoring and comprehensive management of HIV-positive diabetic patients to reduce cardiovascular risk, while further research is needed to evaluate the long-term impact of different ART regimens on lipid metabolism.
REFERENCES:
1. Nsagha DS, Weledji EP, Assob NJ, et al. Highly active antiretroviral therapy and dyslipidemia in people living with HIV/AIDS in Fako Division, South West Region of Cameroon. BMC Cardiovasc Disord 2015;15:1-8.
2. Ombeni W, Kamuhabwa AR. Lipid profile in HIV-infected patients using first-line antiretroviral drugs. J Int Assoc Providers AIDS Care 2016;15(2):164-71.
3. Liu S, Wei B, Liang W, et al. The effects of ART on the dynamics of lipid profiles in Chinese Han HIV-infected patients: comparison between NRTI/NNRTI and NRTI/INSTI. Front Public Health 2023;11:1161503.
4. Sydney C, Nandlal L, Haffejee Fet al. Lipid profiles of HIV-infected diabetic patients. J Endocrinol Metab Diabetes S Afr 2023;28(2):56-61.
5. Bowman ER, Kulkarni M, Gabriel J, et al. Plasma lipidome abnormalities in people with HIV initiating antiretroviral therapy. Translational Medicine Communications 2020;5(1):26.
6. Indumati V, Vijay V, Shekhanawar MS, et al. Comparison of serum lipid profile in HIV positive patients on ART with ART naïve patients. J Clin Diagn Res 2014;8(10):CC06.
7. Ye R, Li J, Yao S, et al. Prevalence and related factors on diabetes among HIV/AIDS receiving antiretroviral therapy in Dehong Dai and Jingpo Autonomous Prefecture. Chin J Epidemiol 2019;40(6):654-9.
8. Alsaeed AH, Aljanobe AH, Alhassan SH, et al. Prevalence of Diabetes Mellitus in People Living With HIV in Dammam, Saudi Arabia. Cureus 2024;16(7).
9. Lee D. HIV: how to manage dyslipidaemia in HIV. Drugs in Context 2022;11:2021-8.
10. Lamon-Fava S, Schaefer EJ. Abnormalities in lipid metabolism in HIV. In: Nutrition and HIV [Internet]. Boston, MA: Springer 2003:87–105.
11. Roberts AD, Muesing RA, Parenti DM, et al. Alterations in serum levels of lipids and lipoproteins with indinavir therapy for human immunodeficiency virus–infected patients. Clin Infect Dis 1999;29(2):441-3.
12. Han JH, Crane HM, Bellamy SL, et al. HIV infection and glycemic response to newly initiated diabetic medical therapy. AIDS 2012;26(16):2087–95.
13. Happ LP, Monroe AK, Young HA, et al. Individual-level and clinic-level factors associated with achieving glycemic control in a large cohort of people with HIV in care – Washington, DC. J Acquir Immune Defic Syndr 2020;85(1):113-22.
14. Melaku T, Chelkeba L, Mekonnen Z. Clinical care & blood pressure control among hypertensive people living with human immune deficiency virus: prospective cohort study. Ann Med Surg (Lond) 2020;54:114-24.
15. Boccara F, Lang S, Meuleman C, et al. HIV and coronary heart disease: time for a better understanding. Journal of the American College of Cardiology 2013;61(5):511-23.
16. Lake JE, Currier JS. Metabolic disease in HIV infection. Lancet Infect Dis 2013;13(11):964-75.
17. Woyesa S, Mamo A, Mekonnen Z, et al. Lipid and lipoprotein profile in HIV-infected and non-infected diabetic patients: a comparative cross-sectional study design, southwest Ethiopia. HIV AIDS (Auckl) 2021;13:1119-26.
18. Zhang E, Chai JC, Deik AA, et al. Plasma Lipidomic Profiles and Risk of Diabetes: 2 Prospective Cohorts of HIV-Infected and HIV-Uninfected Individuals. J Clin Endocrinol Metab 2021;106(4):999-1010.
19. Ohunene DM, Shehu MS, Numbere TW, et al. Prevalence of dyslipidemia in treatment-naïve HIV-infected patients attending a faith-based hospital, Jos Plateau State, Nigeria, 2019. J Interv Epidemiol Public Health 2023;6(1).
20. Di Yacovo S, Saumoy M, Sánchez-Quesada JL, et al. Lipids, biomarkers, and subclinical atherosclerosis in treatment-naive HIV patients starting or not starting antiretroviral therapy: comparison with a healthy control group in a 2-year prospective study. PLoS One 2020;15(8):e0237739.
21. Mehraj V, Chen J, Routy JP. Effects of statins beyond lipid-lowering agents in ART-treated HIV infection. Frontiers in Immunology 2024;15:1339338.
22. Williams PL, Wu JW, Cohn SE, et al. Improvement in lipid profiles over 6 years of follow-up in adults with AIDS and immune reconstitution. HIV Med 2009;10(5):290-301.