Peri-Operative Effects on Blood Sugar in Diabetic Patients Undergoing Surgery Under General Anaesthesia - A Prospective Clinical Study.
- S. Meiyappan , Assistant Professor, Department of Anaesthesia, Dhanalakshmi Srinivasan Medical College and Hospital, Siruvachur, Perambalur, Tamil Nadu, India
- Andrews , Assistant Professor, Department of Anaesthesia, Dhanalakshmi Srinivasan Medical College and Hospital, Siruvachur, Perambalur, Tamil Nadu, India
- Geetha J. , Professor, Department of Anaesthesia, Dhanalakshmi Srinivasan Medical College and Hospital, Siruvachur, Perambalur, Tamil Nadu, India
- Kishore Kumar M. , Postgraduate, Department of Anaesthesia, Dhanalakshmi Srinivasan Medical College and Hospital, Siruvachur, Perambalur, Tamil Nadu, India
- Avanthika Prasanth , Medical Undergraduate, Dhanalakshmi Srinivasan Medical College and Hospital, Siruvachur, Perambalur, Tamil Nadu, India
- Zeeshan Mahdoom , Medical Undergraduate, Dhanalakshmi Srinivasan Medical College and Hospital, Siruvachur, Perambalur, Tamil Nadu, India.
Article Information:
Abstract:
Background: The dynamicity of changes in life style and food habits have made diabetes a highly rampant disorder in the present era. Carbohydrate metabolic response and stress hormonal surges and insulin resistance cause rise in blood sugar levels. The blood sugar rises at various points of time and the values are analysed to correlate with HbA₁c levels. The research query dealt on importance, reliability and clinical correlation between blood sugar and HbA₁c levels and their perioperative variations. MATERIALS & METHODS: This was a Prospective observational clinical study conducted from January 2026 to June 2026. Study Population: All diabetic patients optimised for fasting blood sugar levels who underwent elective surgery under general anaesthesia. Study Sample Size: 30 – a convenient sample size depending on patient input. RESULTS: Our study sample consisted of varied type of sugars with optimised fasting and random sugars in all patients. HbA₁c was variable. The correlation of fasting blood sugar with HbA₁c was poor, r = 0.34. Correlating pre-operative blood sugar with time of incision showed p = 0.2 and r = 0.6. The blood sugar peaked at 1st hour of Surgery – considering the difference in sugar levels between pre-operative and 1st hour - p = 0.03. The sugar levels observed intra-operatively first hour and first hour in the postoperative period were significantly related, p = 0.09. The MAP values fairly remained around baseline value throughout the surgery, revealing a well-controlled titrated use of analgesics and vasodilators to prevent sympathetic response. MAP was mainly noted alongside blood sugar time points to rule out rise in levels due to sympathetic stimulation. Diabetics with optimised fasting sugar but high HbA₁c showed high blood sugar differences at one and two hours of surgery, not normalising post-operatively even after one hour. CONCLUSION: HbA₁c levels take 10–12 weeks for normalisation. Diabetic patients who underwent surgery under GA were taken up after optimisation of fasting and prandial sugar levels which were versatile with therapy. Blood sugars rise through incision towards completion and close to preoperative levels after 1 hour of post-operative period. The blood sugar variations peaked after first hour of intraoperative period and correlated closely (p = 0.09) with one hour post-operative point of time. Patients with higher HbA₁c with optimal blood sugar levels revealed sharper rise of blood sugar levels in the intra-operative period and failed to fall through first hour of post-operative period. Altered erythrokinetics as in anemia and pregnancy significantly affect HbA₁c readings as much as method used for estimating HbA₁c. HbA₁c may play vital role in detecting prediabetic state and degree of hemolysis in hemolytic anemia. Optimisation of HbA₁c may be recommended in elective, planned major surgery with adequate preparation time for a better surgical outcome. ABBREVIATIONS: GHB-Glycated Hemoglobin, MAP-Mean Arterial Pressure, FBS-Fasting Blood Sugar, GA-General Anesthesia, CRF-Chronic Renal Failure, ACTH- Adrenocorticotropic Hormone.
Keywords:
Article :
INTRODUCTION:
The incidence of diabetes is ever increasing in India and etiological factors shift from lifestyle to dietary habits and genetics. An estimated rise to 264 cases per one lakh population from a 1990 prevalence of 162.7 new cases per one lakh population vividly shows an alarm on the socioeconomic burden, signalling to activate methods to screen, detect, counsel and treat along with prevention of end-organ damage.
The prevalence of diabetes is high in patients admitted for surgery, amounting to up to 20%. The data available shows about 8–17% of patients admitted for orthopaedic, gynaecological and vascular operations have diagnosed diabetes, and about 25% have either undiagnosed or unmanaged hyperglycaemia. Surgical outcome is dependent on perioperative care in allaying patho- physiological responses to surgical trauma.
Biochemical alterations occur due to stressors and mediators, resulting in metabolic response. The ultimate goal of healing is to maintain adequate tissue perfusion (nutrition–glucose) and oxygenation.
Normal cortisol production rises from a baseline of 10 mg/day to 50 mg/day for minor surgery, 75–150 mg/day for major surgery, and up to 300 mg/day in severe stress. Cortisol levels increase within 30–60 minutes after incision and peak between 4 and 24 hours and may stay up for 7 days. This evolved into our research question of increase in blood sugar levels in diabetics through the perioperative period, apart from ablating the sympathetic responses be appropriate measures during general anesthesia. In this short study we intended to observe MAP as a marker for sympathetic response and HbA1c for control of diabetes along with blood sugar.
Aims and Objectives
1. To evaluate the variations in blood sugar from fasting level through the intra-operative period to the post-operative period in diabetic patients undergoing elective surgery under GA.
2. To note the baseline blood sugar and HbA1c with MAP for the study group.
3. To enumerate the difference in blood sugar levels from fasting sugar level to induction of anesthesia, incision, 1, 2 and 3 hours or completion of surgery, first, second and 12 hours post-operative period.
4. To observe the mean arterial pressure alongside the blood sugar levels at various points of time.
5. To relate the HbA1c levels with the above values and derive the trend of rise of blood sugar so that treatment could be planned.
MATERIALS AND METHODS:
Study Type
Prospective observational clinical study.
Study Population
All diabetic patients optimised for fasting blood sugar levels who underwent elective surgery under general anaesthesia.
Study Sample Size
30 – a convenient sample size depending on patient input.
Study Period
January 2026 to June 2026.
Exclusion Criteria
• Patients with sepsis and ketosis.
• ASA IV were excluded from the study.
• Patients who were reluctant to undergo multiple blood sugar testing were excluded.
Methods
All ASA II and III diabetic (Type 2) adults posted for elective surgery under general anaesthesia, irrespective of their HbA1c but with optimal fasting blood sugar less than 110 mg/dL without cardiac or hypertensive end organ problems were accepted for the study.
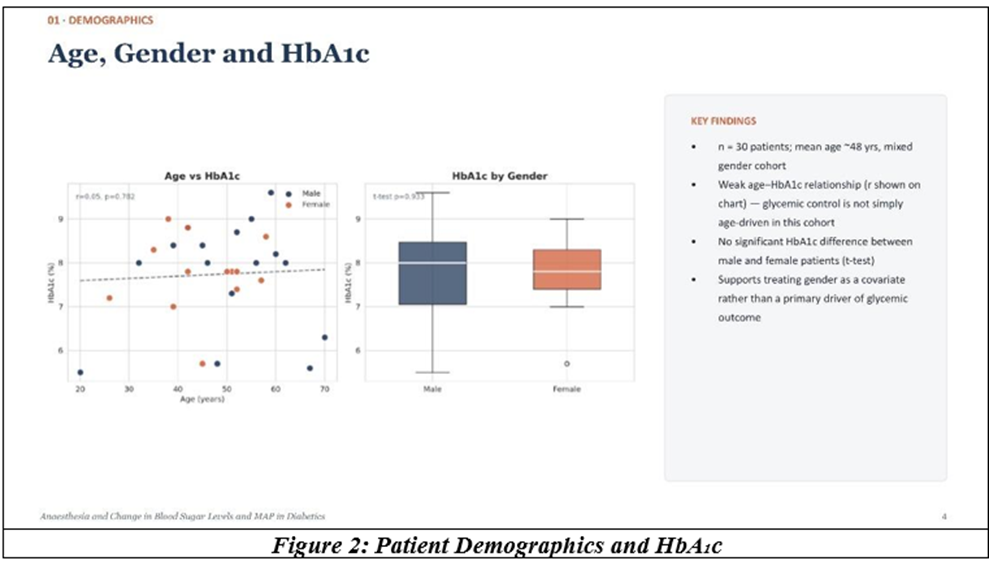
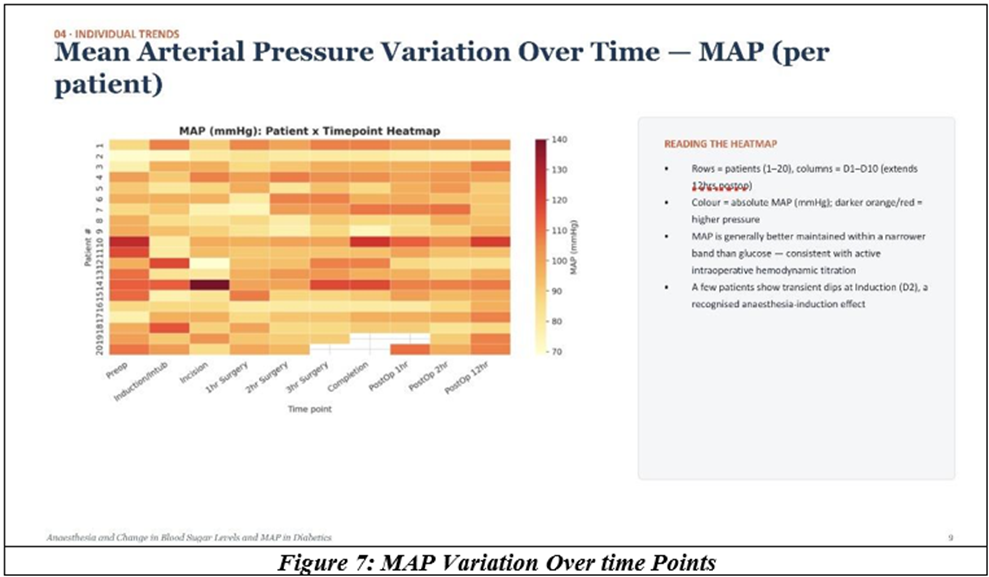
Age, gender, diagnosis and surgery were noted as patient data. HbA1c value at pre-operative anaesthetic check time was noted for all patients. Blood sugar by glucometer and MAP by NIBP monitor were noted at 10 points of time apart from baseline value.
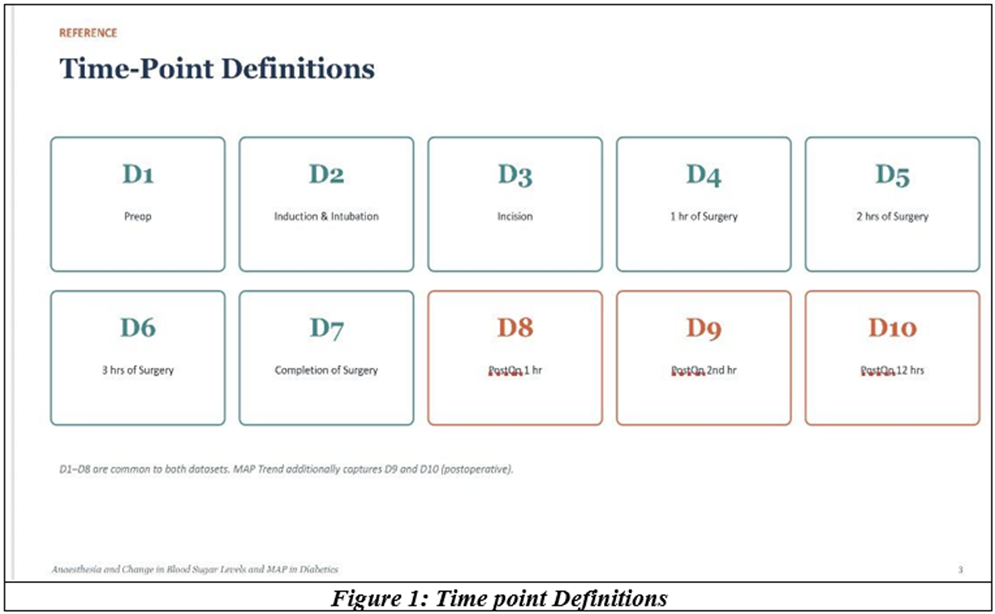
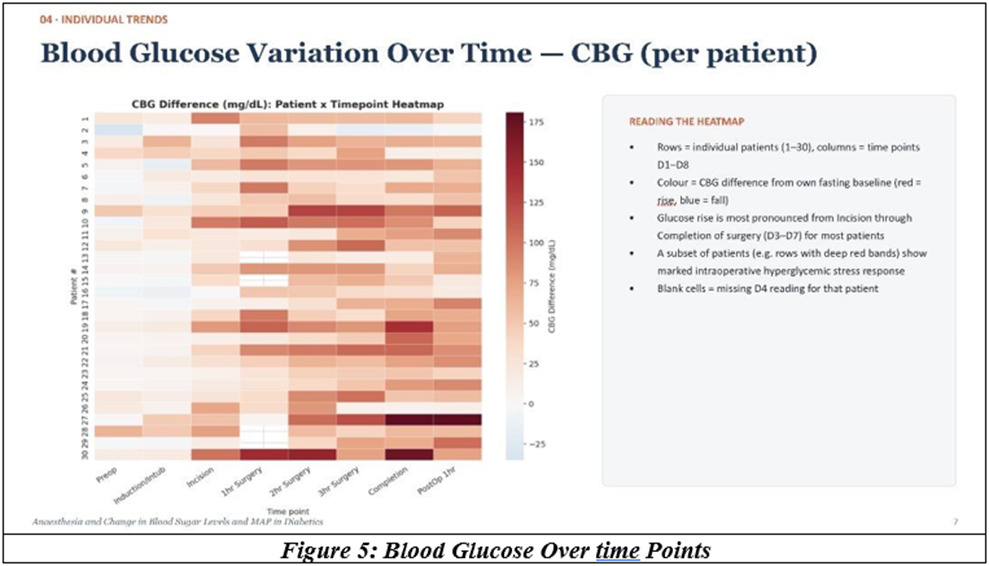
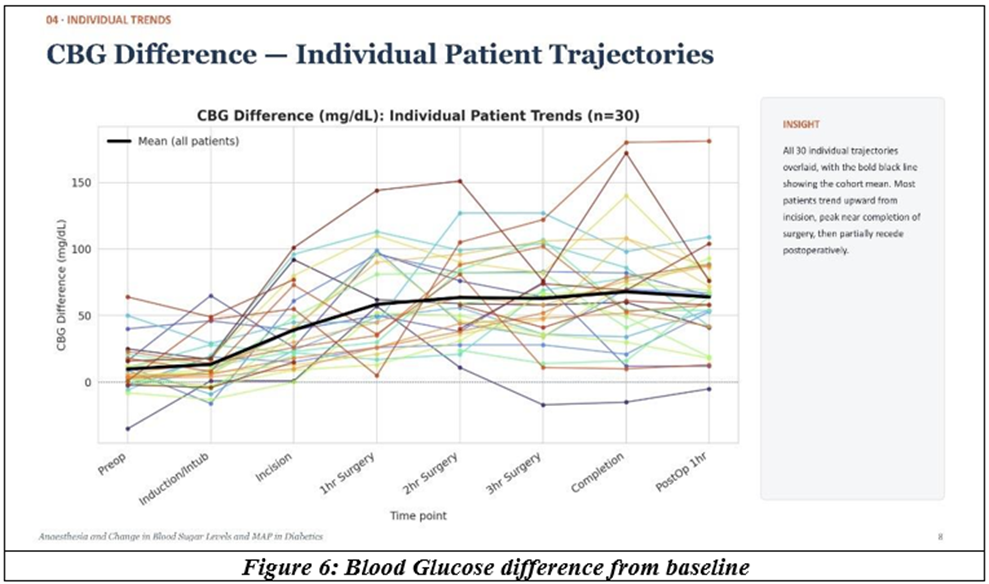
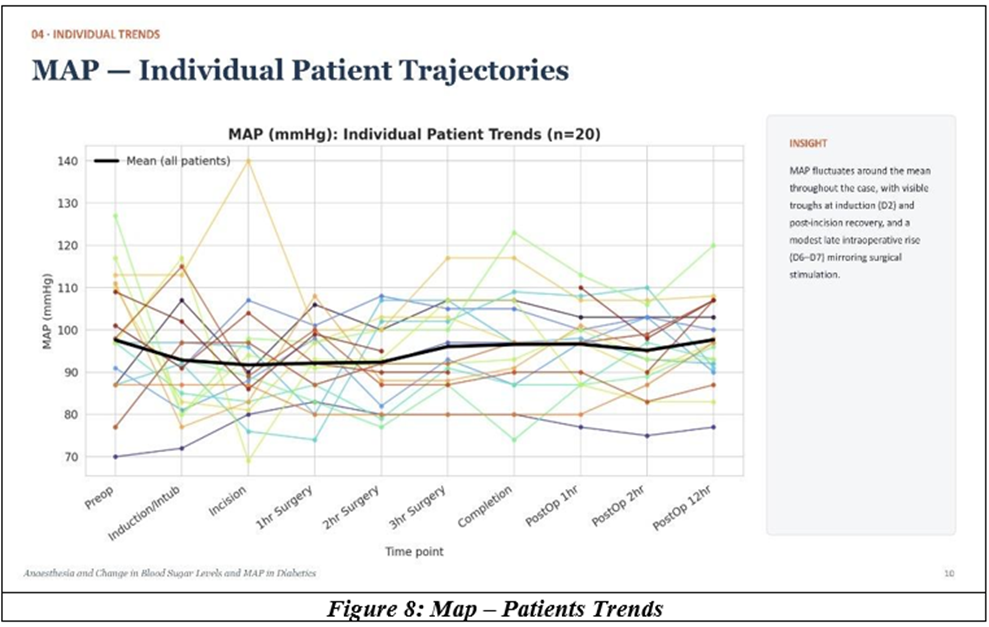
Fasting blood sugar on the day of surgery (D1), during induction/intubation (D2), incision (D3), 1 hour of surgery (D4), 2 hours of surgery (D5), 3 hours of surgery (D6), completion of surgery (D7), post-operative 1 hour (D8), post-op 2 hours (D9), 12 hours post-op (D10) are all noted. The value D1-D10 are the difference in blood sugar from baseline, MAP at the same points of time was noted to evaluate the haemodynamic response to sympathetic stimulation due to surgery.
All patients underwent a thorough pre-anaesthetic evaluation and information about a non-chargeable free recurrent estimation of blood sugar by finger prick. All surgeries were performed by general anaesthesia with propofol (2 mg/kg), vecuronium (0.1 mg/kg) and fentanyl (2 µg/kg), lignocaine (2 mg/kg) IV to allay sympathetic response due to intubation and maintained by O₂/N₂O and intermittent positive pressure ventilation with PEEP of 5 cm water.
MAP was maintained between 90–100 mmHg. MAP was maintained by titration with 0.1 mg bolus of Nitroglycerin. Paracetamol 1g as infusion for analgesia and infiltration of laparoscopic incisions with 0.25% bupivacaine as appropriate, along with Inj. Tramadol 50 mg IV towards the end of surgery for pain relief were given.
All patients were administered with neostigmine 2.5 mg with glycopyrrolate 0.6 mg to reverse the residual neuromuscular blockade and all patients were extubated on the table. The differences in blood sugar from baseline value obtained at various point of time, as described above, and other data collected were tabulated and analysed.
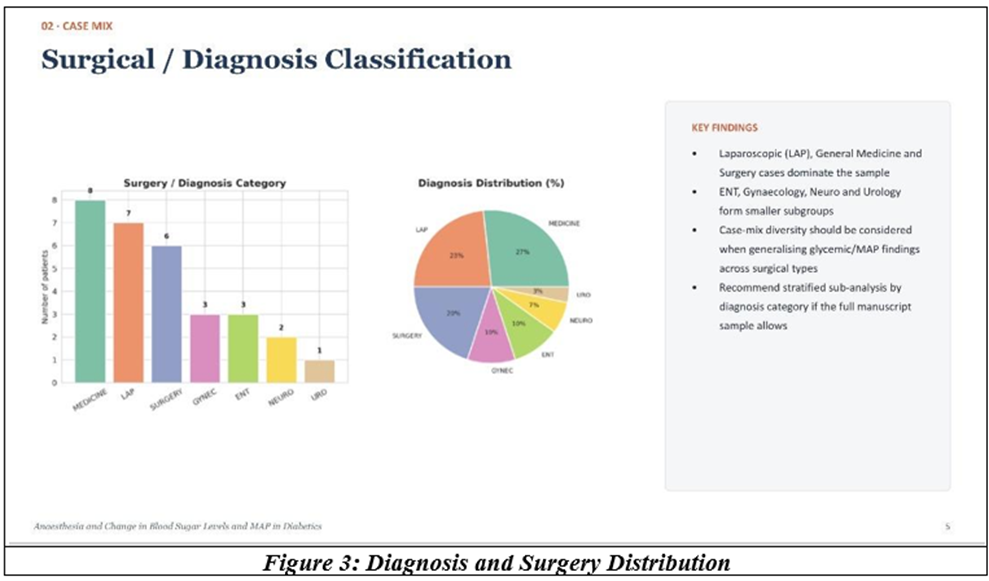
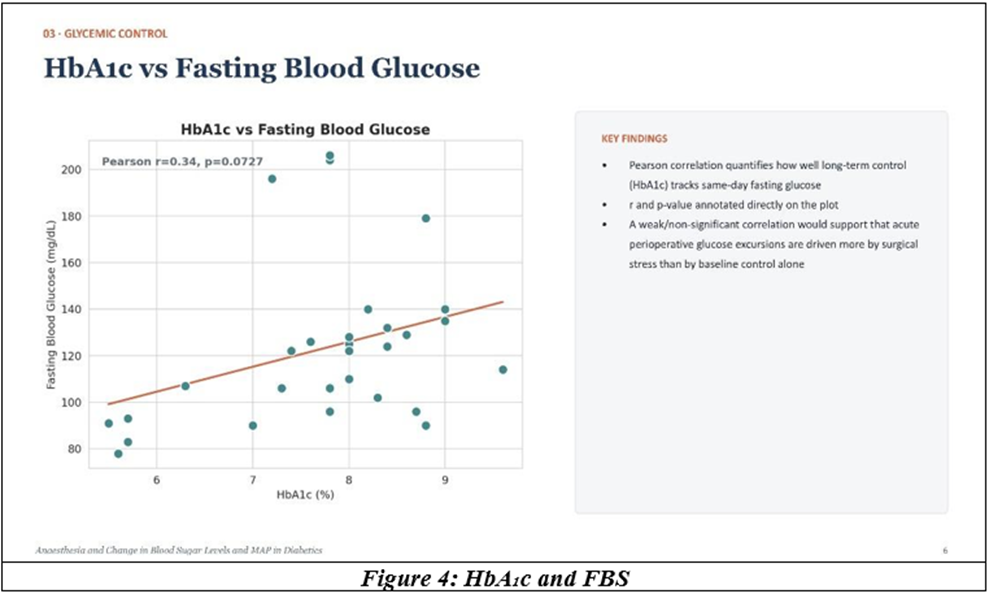
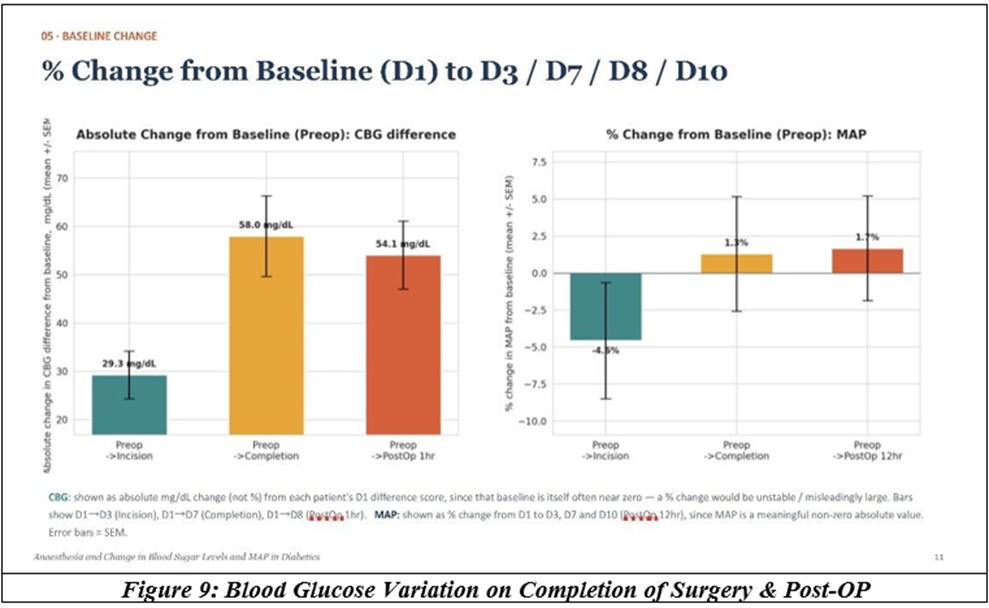
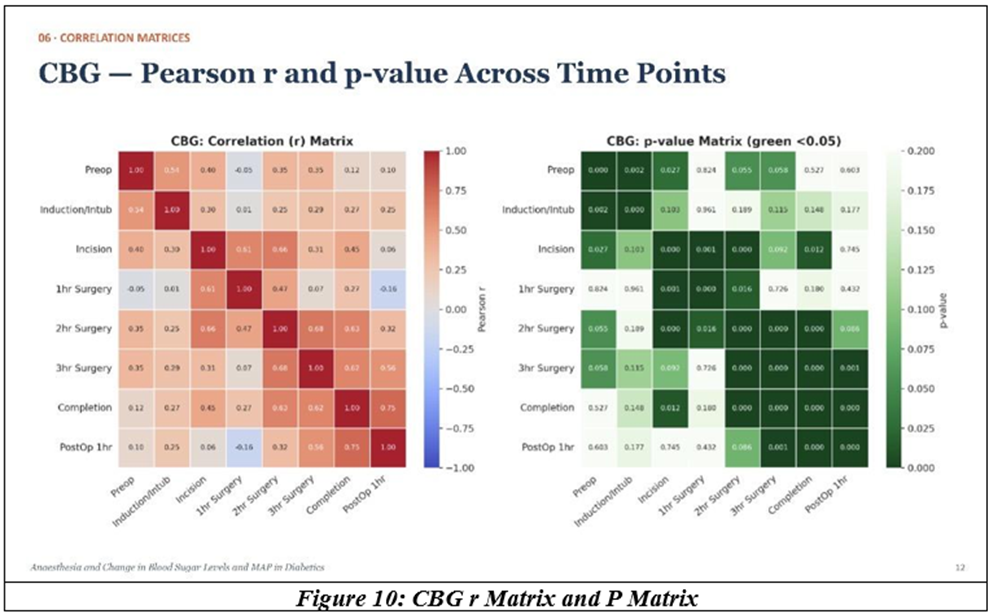
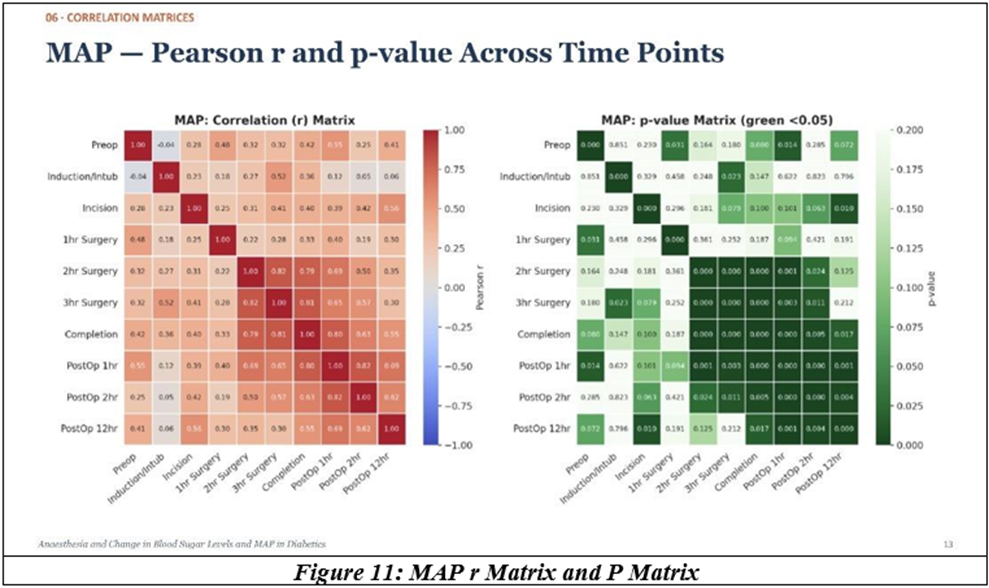
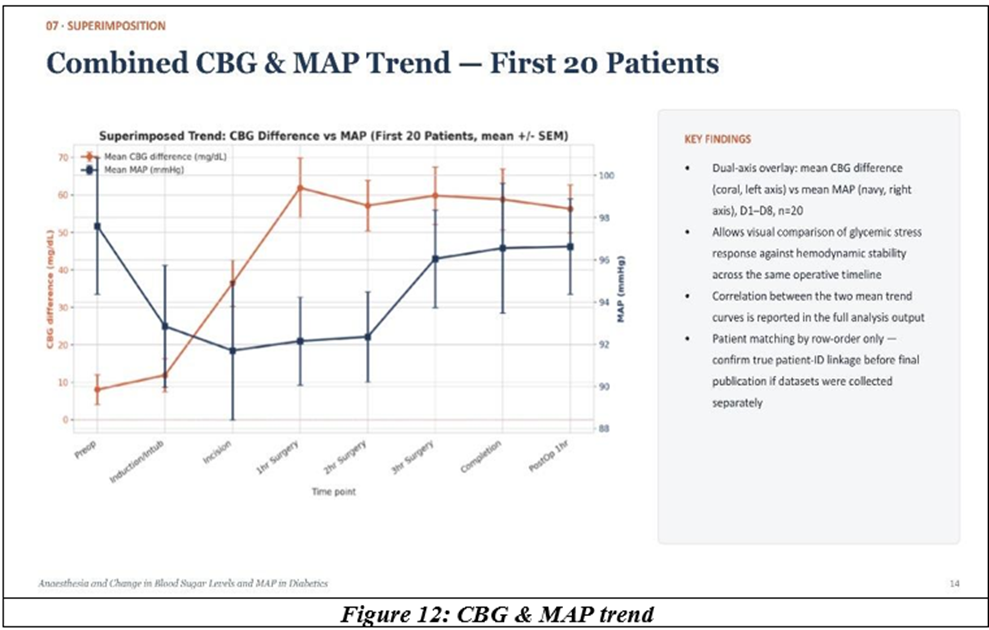
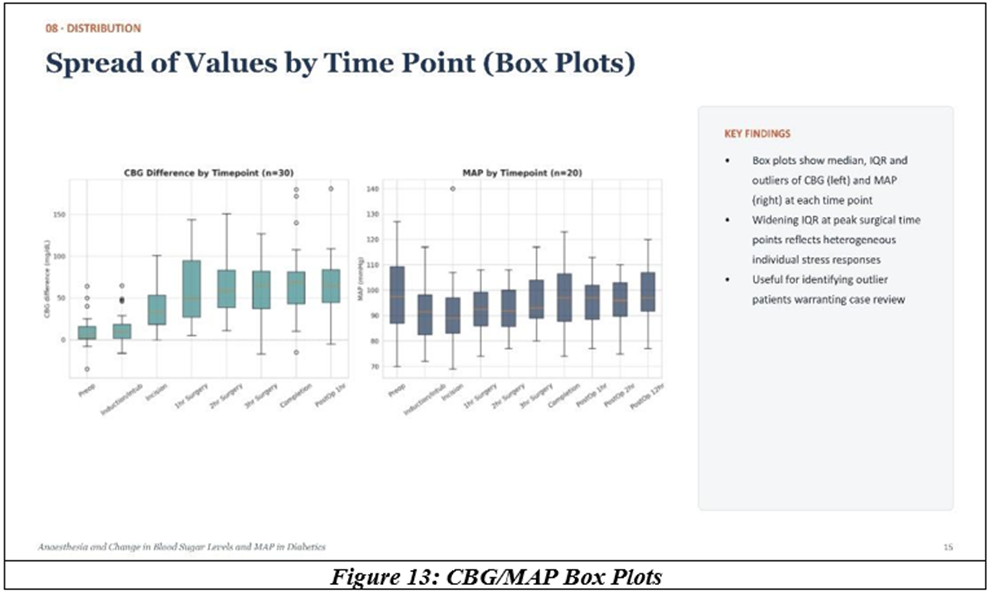
The study group was a mix of cases with predominant laparoscopic surgeries. The scatter plot between pre-operative HbA1c and fasting sugar on the day of surgery showed poor correlation (r = 0.34). MAP is general was better maintained within a narrower band than glucose - consistent with active intraoperative haemodynamic titration. Though fasting blood sugars were optimal for all patients, the rise in blood sugar on incision and return to baseline after one hour of surgery was sharper in patients with higher HbA1c than those with HbA1c close to normal percentage.
RESULTS:
DISCUSSION:
Surgery and injury initiate metabolic responses which are closely related to post-operative complications and delayed recovery.[1] From pre-operative anxiety and fasting to pain, drugs and dehydration, various factors are named stressors in surgical care. Due to large differences in handling perioperative care with various centres and countries, the outcomes are also variable. The principles of enhanced recovery after surgery (ERAS) protocols aim to reduce variations and optimise patient care.[2]
Stress hormones are key mediators of metabolic responses in surgery. Catecholamines, cortisol, glucagon, growth hormone, ACTH, ADH and cytokines such as TNF-α and IL-6 play key roles, whereas suppression of insulin, ILGF-1, testosterone and T3 also exert metabolic responses.
The defence reactions as metabolic responses to trauma include changes in homeostatic reflex activity (thermoregulatory and cardiovascular), reduction in appetite and change in gut motility, activation of hypothalamopituitary-adrenal axis, increase in hormone levels as discussed above, mobilisation of energy reserves, changes in fuel utilisation, alteration of acute-phase plasma protein response, rise in metabolic rate, insulin resistance, increased skeletal muscle breakdown and organ dysfunction.[3]
The metabolic response to injury is divided into two phases: ebb phase and flow phase. The ebb phase, which is immediately following injury, metabolic activity is reduced, decreased body temperature and diminished spontaneous activity. Substrate is available but utilisation is reduced. The ebb phase is a complex neuroendocrine response,[4] characterised by mobilisation of energy reserves and changes in the central control of a number of homeostatic reflexes. The ebb phase is transient or persists for 24 hours or more. It includes the fight-or-flight response or alerting response on which superimposed effects of fluid loss from circulation, tissue damage and pain occurs.
Endocrine Response to Trauma/Surgery
Nociceptive stimuli increase via a complex series of neuronal interactions involving 5-HT, GABA and the opioids, and the release of corticotrophin-releasing factor (CRF) by the parvocellular nuclei of the posterior hypothalamus. CRF is secreted into the capillary plexus of the hypophyseal portal system, and is then carried to adenohypophysis, where it stimulates adrenocorticotrophic hormone secretion. CRF is the main stimulus for ACTH production, but vasopressin released concomitantly from the neurohypophysis following activation of magnocellular supraoptic nuclei of hypothalamus is involved.[5]
Plasma cortisol levels are increased after every minor and moderate trauma, but plasma ACTH increases with severe injury to a concentration needed for maximal stimulation of adrenal cortex.Growth hormones, endorphins and prolactin, secreted by anterior pituitary, are released acutely after injury and the relations with severity are complex.[6]
The release of vasopressin from posterior pituitary is increased in ebb phase and plasma concentration is proportional to severity of injury.[7] Increased activity of sympathetic system leads to release of norepinephrine from postganglionic nerve fibres and epinephrine from adrenal medullary cells. Insulin secretion is suppressed by adrenaline acting on α-adrenergic receptors.[8] Glucagon secretion is stimulated by raised catecholamines by β-adrenergic receptor mechanism. Increased central adrenergic activity raises prolactin.[9]
Prolactin may increase glucocorticoid secretion[10] and is an immunostimulatory hormone.[11] Increased sympathetic activity leads to increased glycogenolysis from liver and plasma.Increase in metabolic rate and core temperature are characteristic of flow phase.
Measurement of Energy Expenditure
In patients who suffered trauma or burns or elective surgery show elevated metabolic rate proportional to severity of pathologic insult. Patients, on average, have a measured energy expenditure of 120–130% of basal predicted value, but a wide range of variability is expected.[12]
Blood glucose concentrations are related to the intensity of surgical injury. Increased hepatic glycogenolysis, gluconeogenesis, insulin resistance leading to reduced peripheral utilisation of glucose are all endocrine responses to surgery. In cardiac surgery, blood glucose increases up to 180–216 mg/dl or 10–12 mmol per litre and remain elevated for 24 hours after surgery.[13] The activation of the stress response was first demonstrated by Egdohl in animal experiments by measuring adrenal corticosteroid concentration in samples from adrenal vein following limb injury in innervated and denervated extremities.[14]
Effects of Anaesthesia on Stress Response to Surgery
McDonald and colleagues demonstrated the suppressant effect of therapeutic doses of morphine on the hypothalamic-pituitary-adrenal axis in human.[15] The inhibitory effects of morphine occur at hypothalamic level. Large doses of opioids were observed to suppress pituitary responses until cardiopulmonary bypass in cardiac surgeries. Morphine 4 mg/kg, fentanyl 50–100 µg/kg, sufentanil 20 µg/kg were found to suppress growth hormone and cortisol release until CPB.[16] Pelvic surgery needed fentanyl 5 µg/kg, Lower abdominal surgery needed 15 µg/kg while this high-dose opioid technique delayed recovery, often needed ventilatory support and haemodynamic stability.[17]
Etomidate
Etomidate interferes with production of steroids from adrenal cortex by reversible inhibition of 11β-hydroxylase and cholesterol side-chain cleaving enzyme. A single dose suppressed aldosterone and cortisol for 6–12 hrs,[18] while an infusion (1–2 hrs) blocked cortisol synthesis up to 24 hours.[19] In critically ill patients, the use of etomidate was associated with increased mortality.[20]
Midazolam
Midazolam with an imidazole ring, in addition to basic benzodiazepine structure, attenuates cortisol responses to both peripheral and upper abdominal surgery.[21]
Clonidine and Dexmedetomidine
The α₂ agonists in use reduce sympathoadrenal and cardiovascular responses to noxious stimuli.
Regional Anaesthesia
Epidural blockade from T4 to S5 established at the start of surgery prevented increase in cortisol and glucose concentrations in response to hysterectomy.[22]
Both afferent input from the operative site to the central nervous system and the hypothalamic–pituitary axis and efferent autonomic neuronal pathways to liver and adrenal medulla are blocked. Epidural block up to C6 inhibited glycemic changes but not cortisol rises in response to upper abdominal and thoracic surgery.[23]
Thoracic epidural and general anaesthesia in cardiac surgery was associated with less release of troponin T.[24] In cases of refractory angina, thoracic epidural has been successfully used as a form of treatment,[25] as the sympatholytic effects of blockade of cardiac sympathetic afferents and efferents may improve the oxygen demand–supply balance. The use of anticoagulants may be a cause of concern in regional techniques for cardiac patients.
Formula 1
Glycated Hemoglobin (HbA1c)
Glycated hemoglobin is a common essential parameter, both to detect prediabetes and long term metabolic control of diabetes. Glycation is a process by which sugars are attached to hemoglobin. Glycated hemoglobin is also called glycohemoglobin as most mono-saccharides including glucose, galactose and fructose spontaneously bond with hemoglobin when present in the bloodstream. The primary metabolic fuel in humans is glucose[26] because it binds to Hb only 21% as likely as galactose and 13% as likely as fructose.
HbA1c is defined as beta N-1 deoxy fructosyl hemoglobin, as a component, HbA1c is a stable minor Hb variant formed in vivo by post-translational modification by glucose-containing primarily glycated N-terminal β chains.[27]
When HbA was subjected to cation exchange chromatography, the first fraction to separate was designated HbA₀ and subsequent fractions as HbA₁a, HbA₁b and HbA₁c in the order of elution. HbA₁c was first separated from other forms of hemoglobin by Huisman and Meyering in 1958 using a chromatographic column.[28] It was first characterised as a glycoprotein by Bookchin and Gallop in 1968.[29] Its increase in diabetes was first described in 1969 by Samuel Rahbar and co-workers.[30] and the reactions leading to its formation was characterised by Bunn and co-workers in 1975.[31]
Anthony Cerami, Ronald Koenig et al. in 1976 proposed the use of HbA₁c[32] for monitoring the degree of control of glucose metabolism. Earlier in 1955 itself Kunkel et al[33] observed that adult Hb could electrophoretically be shown to consist of fast and slow migrating components. Rahbar demonstrated that the fast hemoglobin component[34] was increased in persons with uncontrolled diabetes. Clinical relevance of GHb was established by Bunn and Nathan[35] and Kinetics was studied by Goldstein.[36]
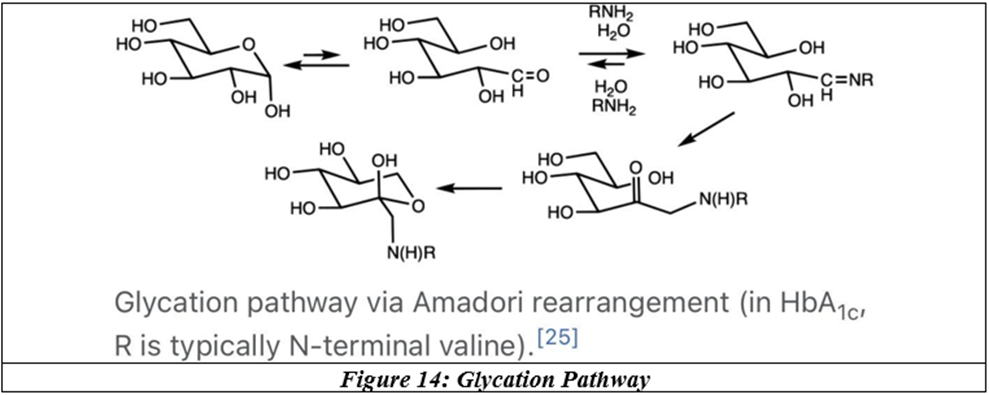
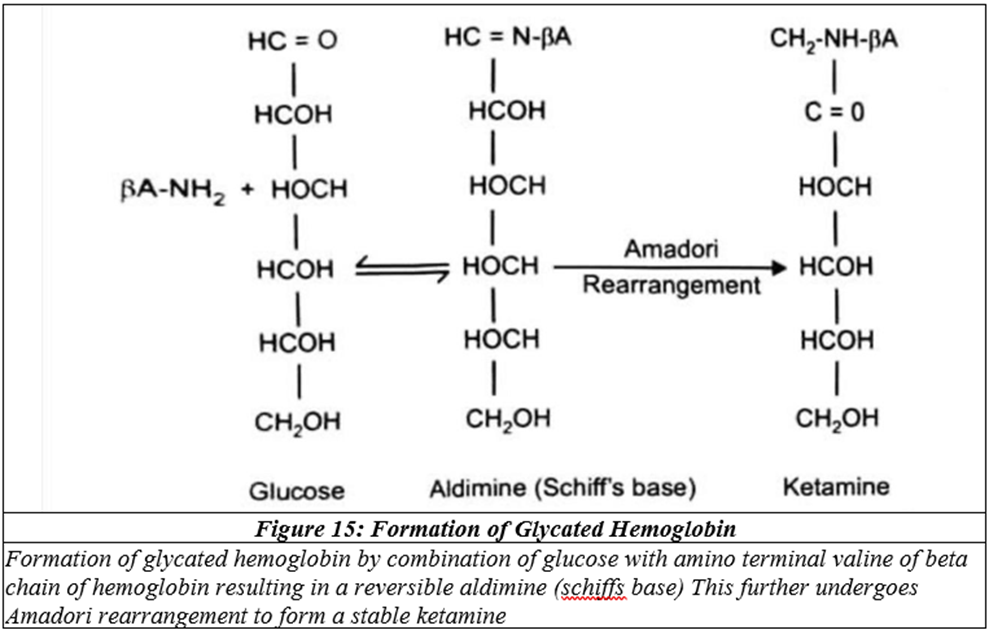
Glycation of haemoglobin takes place by interaction of glucose with the amino-terminal valine of one or both beta chains of HbA. This glycation site alters the mobility of haemoglobin in cation exchange chromatography. This is the major glycated haemoglobin named HbA1c. Glycation also occurs at other sites of the Hb molecule, namely epsilon amino groups of lysine residues and alpha chains, where though glycation is extensive, it does not alter ionic charge and hence cannot be separated by ionic exchange chromatography.
Formula 2
The initial process of glycation results in an unstable compound produced by interaction of amine group in haemoglobin with carbonyl group of glucose. This produces the unstable Schiff base, which is proportional to current glycemia and hence can reflect results of GHb assessment in cation exchange chromatography, where Schiff base, which is pre-glycohaemoglobin, co-elutes with HbA1c. This Schiff base can be removed by saline incubation. Schiff base can either dissociate or convert to stable ketoamine by Amadori rearrangement.
Methods used to Estimate Glycated Hemoglobin
A knowledge about the methodology of estimating GHb is essential to choose the appropriate method in special clinical situations such as pregnancy, in order to avoid false positive and false negative results. The 4 basic principles involved are: (a) difference in ionic charge, (b) structural characteristics, e.g. immuno turbidimetric and boronic affinity methods, and (c) chemical reactivity and (d) enzyme method.
Methods based on difference in ionic discharge are extensively used, but pre-glyco Hb must be removed before column chromatography to reduce false high values. The methods based on structural characteristics of GHb utilises a column containing maminophenylboronic acid coupled to agarose considering stronger affinity of HbA1 to boronic acid, hence elution slower than HbA0. This method is unaffected by pH, temperature and storage but by quality of agar gel. Methods based on chemical reactivity utilises generation of 5-hydroxy methyl furfusal from glycoamino groups on Hb by heating Hb in a weak acid.[37] This method is extensively used in a modified form as it is laborious but least expensive. By this method good, bad and poor diabetic controls is given by levels of GHb as 8%, 8–10% and >10% respectively.
In enzyme methods Hb is digested by a protease to yield fructosyl amino acid as it releases hydrogen to react with chromogens in the presence of peroxidase. Direct enzymatic HbA1c assays have the advantages of accuracy, specificity and applicability to all chemistry analysers. The point of care methods use immunoturbidometry with higher coefficient of variation (5%) than standard techniques.
Correlation of Glycated Hb and Blood Glucose. Clinical Relevance of HbA₁c:
Metabolic Control
The GHb values after 2 months of follow-up in type 2 diabetes had close correlation with mean blood glucose values.[38] Type I diabetes had linear relationship between glycemic control & HbA₁c: each 1% increased HbA₁c corresponded to an increase of 30 mg/dl increase in average blood glucose.
HbA₁c does not reflect glycemic excursions - a patient with marked glycemic excursions may exhibit same HbA₁c values as those with stable sugars. At very high fasting sugars HbA₁c values are in high range 9–12%. At lower level percentage of HbA₁c, the major contributor is postprandial sugars. The metabolic control of diabetes was presumed to be reflected by control in the last 120 days (in early period of HbA₁c use) corresponding to life span of erythrocytes. Large numbers of erythrokinetic studies recently have confirmed that blood glucose of past one month, two months and three months contribute to 50%, 40% and 10% respectively to the final result.[39]
Anemia and HbA₁c
Commonest anemia is iron deficiency with microcytic hypochromic erythrocytes. A stable anemic condition does not affect estimation directly when HPLC, boronic affinity or turbidoisometric or enzyme methods are used. However, in dynamic phase of anemia with alterations in erythrokinetics, as for example in the recovery phase of anemia, more young RBCs are included proportionally in the assay leading to low values of HbA₁c.
Hemolytic anemias with ongoing destruction of RBCs reflect low levels of HbA₁c. Indirectly HbA₁c is used to detect degree of hemolysis. HbA₁c estimated by column methods and HPLC are unreliable in patients with hemoglobinopathies.
HbA₁c in Pregnancy
Hemodilution, hyperdynamicity and concomitant iron deficiency anemia attribute to altered erythrokinetics in pregnancy resulting in lower and considerable HbA₁c levels. A nondiabetic pregnant lady has lower blood glucose than nonpregnant lady and HbA₁c is lower by 1.5–2%.
The fetal malformations and macrosomia following GDM had direct relationship with blood glucose. The congenital anomalies were 2%, 3% and 10% for HbA₁c with zero, 2 and 8 standard deviation above normal mean value respectively.[40]
In pregnancy it is thus advisable to estimate HbA₁c once a month as the past one month period is a major contributor to HbA1c. It is feasible to achieve HbA₁c values of less than 5.5% in GDM, less than 6.5% in pregestational type 2 diabetes and less than 7.0% in type 1 DM with pregnancy.
HbA₁c in Renal Disease
Blood glucose estimations are more reliable than HbA₁c in renal disease due to altered erythrokinetics resulting from anemia due to micronutrient deficiency (B₁₂, iron) deficiency and that of erythropoietin.
HbA₁c and Complications of DM
Glycemic control has strict correlation with microvascular complications of diabetes. A more recent-onset type 2 DM needs a stricter target than a longstanding type 2 DM with relaxed targets.
A GTT, prandial glucose level and HbA₁c had the same sensitivity to diagnose diabetes.[41]
SUMMARY OF RESULTS
Our study sample consisted of varied type of sugars with optimised fasting and random sugars in all patients. HbA₁c was variable. The correlation of fasting blood sugar with HbA₁c was poor, r = 0.34. Correlating pre-operative blood sugar with time of incision showed p = 0.2 and r = 0.6. The blood sugar peaked at 1st hour of Surgery – considering the difference in sugar levels between pre-operative and 1st hour - p = 0.03. The sugar levels observed intra-operatively first hour and first hour in the postoperative period were significantly related, p = 0.09.
The MAP values fairly remained around baseline value throughout the surgery, revealing a well-controlled titrated use of analgesics and vasodilators to prevent sympathetic response. MAP was mainly noted alongside blood sugar time points to rule out rise in levels due to sympathetic stimulation. Diabetics with optimised fasting sugar but high HbA₁c showed high blood sugar differences at one and two hours of surgery, not normalising post-operatively even after one hour.
CONCLUSION:
HbA₁c or glycated hemoglobin fraction is not absolutely correlating with fall in blood glucose levels instantly and may take 10 to 12 weeks to reach normal levels. HbA₁c definitely influences the amplitude of rise in blood sugar, especially in prolonged surgeries with extensive dissection right through the first intraoperative hour. Plastic and cosmetic surgeries highly dependent on wound healing, if elective and have time span would especially need to normalise HbA₁c though gradual, before surgery.
REFERENCES:
1. Soop M, Ljungqvist O. Metabolic responses to surgical stress. Clin Nutr ESPEN 2025;67:178-83.
2. Gustafsson HD, et al. 20 years of ERAS: What next? World J Surg 2008;32(5):1087-9.
3. Campbell JT, Little RA. Metabolism and metabolic response to trauma. Churchill Davidson pp. 103-5.
4. Barton RN. The neuroendocrinology of physical injury. Baillière’s Clin Endocrinol Met 1987;1:335-74.
5. Gann DS, Lilly MP. The neuroendocrine response to multiple trauma. World J Surg 1983;7(1):101-18.
6. Barton RN, Stoner HB, Watson SM. Relationships among plasma cortisol, adrenocorticotrophin, and severity of injury in recently injured patients. J Trauma 1987;27(4):384-92.
7. Anderson ID, Forsling ML. Acute injury is a potent stimulus of vasopressin release. J Physiol 1989: p. 416.
8. Frayn KN, Maycock PF, Little RA, et al. Factors affecting the plasma insulin concentration shortly after accidental injury in man. Arch Emerg Med 1987;4(2):91-9.
9. Noel GL, Suh HK, Stone JG, et al. Human prolactin and growth hormone release during surgery and other conditions of stress. J Clin Endocrinol Metab 1972;35(6):840-51.
10. MacLeod RM, Thorner MO, Scapagnini U, eds. Prolactin: Basic and clinical correlates. Liviana Press 1985:609-14.
11. Reichlin S. Neuroendocrine immune reaction. N Engl J Med 1992;329:1246-53.
12. Weissman C, Kemper M, Elwyn DH, et al. The energy expenditure of the mechanically ventilated critically ill patient. An analysis. Chest 1986;89(2):254-9.
13. Desborough JP. The stress response to trauma and surgery. Br J Anaesth 2000;85(1):109-17.
14. Egdahl RH. Pituitary-adrenal response following trauma to the isolated leg. Surgery 1959;46(1):9-21.
15. Masterson GR, Mostafa SM. Adrenocortical function in critical illness. BJA 1998;81(3):308-10.
16. Desborough JP, Hall GM. Modification of hormonal and metabolic response to surgery by narcotics and GA. Clin Anaesth 1989;3:317-34.
17. Lacoumenta S, Paterson JL, Myers MA, et al. Effects of cortisol suppression by etomidate on changes in circulating metabolites associated with pelvic surgery. Acta Anaesthesiol Scand 1986;30(1):101-4.
18. Wang C, Chan V, Yeung RT. Effect of surgical stress on pituitary-testicular function. Clin Endocrinol (Oxf) 1978;9(3):255-66.
19. Nicholson G, Burrin JM, Hall GM. Peri-operative steroid supplementation. Anaesthesia 1998;53(11):1091-104.
20. Liem TH, Hasenbos MA, Booij LH, et al. Coronary artery bypass grafting using two different anesthetic techniques: Part 2: Postoperative outcome. J Cardiothorac Vasc Anesth 1992;6(2):156-61.
21. Crozier TA, Beck D, Schlaeger M, et al. Endocrinological changes following etomidate, midazolam, or methohexital after minor surgery. Anesthesiology 1987;66:628-35.
22. Enquist A, Brandt MR, Fernandes A, et al. The blocking effect of epidural analgesia on the adrenocortical and hyperglycemic responses to surgery. Acta Anaes Scand 1977;21:330-5.
23. Bromage PR, Shibata HR, Willoughby HW. Influence of prolonged epidural blockade on blood sugar and cortisol responses to operations upon the upper part of the abdomen and the thorax. Surg Gynecol Obstet 1971;132(6):1051-6.
24. Liu S, Carpenter RL, Neal JM. Epidural anesthesia and analgesia. Their role in postoperative outcome. Anesthesiology 1995;82(6):1474-506.
25. Moore CM, Cross MH, Desborough JP, et al. Hormonal effects of thoracic extradural analgesia for cardiac surgery. Br J Anaesth 1995;75(4):387-93.
26. Bunn HF, Higgins PJ. Reaction of monosaccharides with proteins: possible evolutionary significance. Science 1981;213(4504):222-4.
27. Miedema K. Standardization of HbA₁c and optimal range of monitoring. Scand J Clin Lab Invest 2005;65(Suppl 240):61-72.
28. Huisman THJ, Martis EA, Dozy A. Chromatography of hemoglobin types on carboxymethylcellulose. J Lab Clin Med 1958;52(2):312-27.
29. Bookchin RM, Gallop PM. Structure of HbA₁c – nature of N-terminal beta chain blocking group. Biochem Biophys Res Commun 1968;32(1):86-93.
30. Rahbar S, Blumenfeld O, Ranney HM. Studies of an unusual hemoglobin in patients with diabetes mellitus. Biochem Biophys Res Commun 1969;36(5):838-43.
31. Haney DN, Bunn HF, Gabbay KH, et al. Further identification of the nature and linkage of carbohydrate in HbA₁c. Biochem Biophys Res Commun 1975;67(1):103-9.
32. Koenig RJ, Peterson CM, Jones RL, et al. Correlation of glucose regulation and HbA₁c in DM. N Engl J Med 1976;295(8):417-20.
33. Kunkel GH, Wallenius G. New hemoglobin in normal adult blood. Science 1955;122(3163):288.
34. Rahbar S. An abnormal hemoglobin in red cells of diabetes mellitus. Clin Chim Acta 1968;22(2):296-8.
35. Nathan DM, Singer DE, Hurxthal K, et al. The clinical information value of the glycosylated hemoglobin assay. N Engl J Med 1984;310(6):341-6.
36. Goldstein DE, Cermann CM, et al. Glycated hemoglobin kinetics: predicted and actual rates of change. Diabetes 1989;38:459.
37. Flückiger R, Winterhalter KH. In vitro synthesis of HbA₁c. FEBS Lett 1976;71(2):356-60.
38. Chandalia HB, Sadikot S, Bhargav DK, et al. Estimation of glycosylated hemoglobins by a simple chemical method and its use in monitoring control of diabetes mellitus. J Assoc Physicians India 1980;28(9):285-6.
39. Tahara Y, Shima K. The response of GHb to stepwise plasma glucose change over time in diabetic patients. Diabetes Care 1993;16(9):1313-4.
40. Guerin A, Nisenbaum R, Ray JG. Use of maternal GHb concentration to estimate the risk of congenital anomalies in the offspring of women in pre pregnancy with diabetes. Diabetes Care 2007;30(7):1920-5.
41. Rey E, Attie C, Bonin A. The effects of first trimester diabetes control on the incidence of macrosomia. Am J Obstet Gyn 1999;181(1):202-6.