Evaluation of Carotid Intima-Media Thickness by Ultrasonography in Patients with Type 2 Diabetes Mellitus: A Cross-Sectional Study.
- Ashish J Agrawal , Associate Professor, Department of Radiodiagnosis and Imaging, JMF's ACPM Medical College & Hospital, Morane (P.L.) Sakri Road, Dhule – 424001, Maharashtra, INDIA
- Krupalsingh N Sisodiya , Professor and HOD, Department of Radiodiagnosis and Imaging, JMF's ACPM Medical College & Hospital, Morane (P.L.) Sakri Road, Dhule – 424001, Maharashtra, INDIA
- Rahul G Bachhav , Associate Professor, Department of Radiodiagnosis and Imaging, JMF's ACPM Medical College & Hospital, Morane (P.L.) Sakri Road, Dhule – 424001, Maharashtra, INDIA
Article Information:
Abstract:
Background: Type 2 diabetes mellitus is associated with accelerated atherosclerosis and an increased risk of cardiovascular disease. Carotid intima-media thickness, measured by high-resolution B-mode ultrasonography, is a non-invasive marker of subclinical arterial-wall changes. Its assessment may help identify diabetic patients with a greater burden of cardiovascular risk before clinically apparent vascular disease develops. Aim: To evaluate carotid intima-media thickness by ultrasonography in patients with type 2 diabetes mellitus. Materials and Methods: This hospital-based cross-sectional study included 200 adult patients with T2DM. Demographic characteristics, duration of diabetes, anthropometric measurements, blood pressure, smoking, physical activity and cardiovascular-risk factors were recorded. Fasting plasma glucose, HbA1c, lipid profile, serum creatinine and diabetes-related complications were assessed. Right and left common carotid artery CIMT was measured approximately 1 cm proximal to the carotid bulb using high-resolution B-mode ultrasonography. Increased CIMT was defined as a mean value of at least 0.80 mm. Appropriate descriptive and inferential statistical tests, correlation analysis and multiple linear regression were applied. A p value below 0.05 was considered statistically significant. Results: The mean age was 54.38±10.72 years, 59.5% were men, and the mean duration of diabetes was 8.74±5.63 years. The mean right, left and bilateral CIMT values were 0.80±0.18, 0.83±0.19 and 0.82±0.18 mm, respectively. Left CIMT was significantly greater than right CIMT, with a mean difference of 0.03 mm (95% CI: 0.02-0.04; p<0.001). Increased CIMT was detected in 117 (58.5%) patients, carotid plaque in 69 (34.5%), and either abnormality in 131 (65.5%). CIMT increased significantly with age, BMI and diabetes duration. Greater CIMT was associated with male sex, hypertension, smoking, physical inactivity, poor glycaemic control and dyslipidaemia. HbA1c (r=0.44), LDL-C (r=0.39), fasting glucose (r=0.31), triglycerides (r=0.26) and serum creatinine (r=0.22) correlated positively with CIMT, whereas HDL-C correlated negatively (r=−0.24). Patients with retinopathy, nephropathy, neuropathy or any microvascular complication had significantly greater CIMT. Age, BMI, diabetes duration, systolic blood pressure, male sex and smoking remained independent predictors in multivariable analysis. Conclusion: Subclinical carotid atherosclerosis was common among patients with T2DM. Greater CIMT was associated with prolonged diabetes, poor glycaemic control, adverse lipid parameters and conventional cardiovascular-risk factors. Ultrasonographic CIMT and plaque assessment may complement established cardiovascular-risk evaluation and facilitate the identification of high-risk patients requiring intensive risk-factor modification
Keywords:
Article :
INTRODUCTION:
Type 2 diabetes mellitus (T2DM) is a chronic metabolic disorder characterized by persistent hyperglycaemia resulting from insulin resistance and progressive impairment of pancreatic β-cell function. Its increasing prevalence has created a substantial global health burden. Cardiovascular disease, including coronary artery disease, cerebrovascular disease and peripheral arterial disease, is the principal cause of morbidity and mortality among individuals with T2DM. The increased cardiovascular risk is attributable to the combined effects of chronic hyperglycaemia, hypertension, dyslipidaemia, obesity, insulin resistance, endothelial dysfunction, oxidative stress and systemic inflammation. These abnormalities accelerate atherosclerosis, which may remain clinically silent for several years before presenting as myocardial infarction or stroke.
Early identification of subclinical atherosclerosis may facilitate timely cardiovascular-risk assessment and preventive intervention. Carotid intima-media thickness (CIMT), measured using high-resolution B-mode ultrasonography, is a non-invasive, reproducible and relatively inexpensive marker of arterial wall changes. It represents the combined thickness of the intimal and medial layers of the carotid artery. CIMT is generally measured at the far wall of the common carotid artery in a plaque-free segment, following standardized protocols. The Mannheim consensus distinguishes diffuse intima-media thickening from carotid plaque, defining plaque as a focal structure encroaching into the arterial lumen by at least 0.5 mm, by 50% of the surrounding CIMT, or having a thickness greater than 1.5 mm.[1]
Patients with T2DM commonly demonstrate increased CIMT compared with individuals without diabetes, indicating accelerated vascular ageing and subclinical atherosclerosis. A meta-analysis demonstrated that CIMT is associated with adverse lipid parameters among patients with T2DM, including increased triglycerides, total cholesterol and low-density lipoprotein cholesterol.[2] Increasing age, longer duration of diabetes, poor glycaemic control, hypertension, obesity, smoking, diabetic nephropathy and dyslipidaemia may contribute to greater CIMT.[3,4] CIMT may also correlate with microvascular complications such as diabetic retinopathy and nephropathy, suggesting that macrovascular and microvascular injury share common metabolic and endothelial mechanisms.[3]
Although CIMT can provide valuable information regarding vascular health, it should be interpreted as part of an integrated cardiovascular-risk assessment rather than as an isolated diagnostic test or treatment target.[1,5] Assessment of CIMT and its relationship with clinical, anthropometric and biochemical characteristics may help identify patients with T2DM who have a greater burden of subclinical atherosclerosis. Therefore, the present study evaluated CIMT by ultrasonography in patients with T2DM and examined its association with demographic characteristics, duration of diabetes, glycaemic control, lipid profile and other cardiovascular-risk factors.
AIM
To evaluate carotid intima-media thickness by ultrasonography in patients with type 2 diabetes mellitus.
OBJECTIVES
1. To measure right, left and mean carotid intima-media thickness in patients with type 2 diabetes mellitus using high-resolution B-mode ultrasonography.
2. To determine the association of CIMT with age, sex, body mass index, duration of diabetes, blood pressure and other cardiovascular-risk factors.
3. To assess the relationship of CIMT with glycaemic control, lipid profile and diabetes-related complications.
MATERIALS AND METHODS:
Source of Data
The study participants were recruited from patients with T2DM attending the outpatient and inpatient services of the Departments of General Medicine and Endocrinology at the study hospital. Ultrasonographic measurements were performed in the Department of Radiodiagnosis. Relevant clinical information was obtained through participant interviews, clinical examinations, medical records and laboratory investigations.
Study Design
A hospital-based observational cross-sectional study was conducted.
Study Location
The study was conducted in the Departments of General Medicine/Endocrinology and Radiodiagnosis of a tertiary-care teaching hospital.
Study Duration
The study was conducted over a period of 18 months, including participant recruitment, clinical evaluation, laboratory investigation, ultrasonographic assessment, data entry and statistical analysis.
Sample Size
A total of 200 eligible patients with T2DM were included in the study. Consecutive eligible patients attending the study centre during the defined study period were enrolled until the required sample size was achieved.
Study Population
The study population consisted of adult patients with an established diagnosis of T2DM who attended the selected tertiary-care hospital during the study period and fulfilled the eligibility criteria.
Inclusion Criteria
1. Patients aged 30 years or older.
2. Patients diagnosed with T2DM according to accepted diagnostic criteria or receiving antidiabetic treatment.
3. Patients with a documented duration of diabetes or reliable clinical records.
4. Patients who provided written informed consent.
5. Patients who underwent the required clinical, biochemical and ultrasonographic evaluation.
Exclusion Criteria
1. Patients with type 1 diabetes mellitus, gestational diabetes or secondary diabetes.
2. Patients with a previous history of myocardial infarction, coronary revascularization, stroke, transient ischaemic attack or peripheral arterial disease.
3. Patients with known carotid-artery surgery, carotid stenting or neck irradiation.
4. Patients with severe renal failure, decompensated liver disease, active infection, malignancy or critical illness.
5. Pregnant women.
6. Patients receiving long-term corticosteroids or other medicines known to cause secondary hyperglycaemia.
7. Patients in whom adequate visualization of the carotid arteries was not possible.
8. Patients unwilling to participate or having incomplete essential clinical or laboratory information.
Sampling Technique
A consecutive sampling technique was used. All patients with T2DM presenting during the study period were screened against the eligibility criteria. Eligible patients who provided informed consent were enrolled sequentially until 200 participants had been included.
Procedure and Methodology
Approval was obtained from the Institutional Ethics Committee before commencing the study. Written informed consent was obtained from every participant. A predesigned and pretested case-record form was used to record demographic characteristics, clinical history, examination findings, laboratory results and ultrasonographic measurements.
Information was collected regarding age, sex, duration of diabetes, antidiabetic treatment, hypertension, dyslipidaemia, smoking, alcohol consumption, family history of cardiovascular disease and diabetes-related complications. A history of retinopathy, nephropathy and neuropathy was recorded from medical documents and relevant clinical assessments.
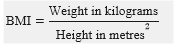
Height was measured without footwear to the nearest 0.1 cm, and weight was measured using a calibrated weighing scale to the nearest 0.1 kg. Body mass index was calculated as:
Blood pressure was measured using a calibrated sphygmomanometer after the participant had rested for at least five minutes. Two readings were obtained at an appropriate interval, and their average was used for analysis.
Ultrasonographic Measurement of CIMT
Carotid ultrasonography was performed using a high-resolution ultrasound machine equipped with a 7-12 MHz linear-array transducer. Participants were examined in the supine position with the neck mildly extended and rotated away from the side being examined.
The right and left common carotid arteries were assessed in longitudinal views. CIMT was measured at the far wall of a plaque-free segment approximately 1 cm proximal to the carotid bulb. It was defined as the distance between the leading edge of the lumen-intima interface and the leading edge of the media-adventitia interface. Three measurements were obtained from each side, and their averages were calculated. Mean CIMT was calculated from the mean right and left CIMT values.
Carotid plaque was recorded separately and was defined according to the Mannheim consensus as a focal structure extending into the arterial lumen by at least 0.5 mm, by at least 50% of the surrounding CIMT, or having a thickness greater than 1.5 mm.[1] Wherever feasible, all examinations were performed by the same experienced radiologist, who was unaware of the biochemical results, to reduce observer-related variability.
Sample Processing
After overnight fasting for approximately 8-12 hours, venous blood was collected from each participant under aseptic precautions. Approximately 5-7 mL of blood was divided into appropriate collection tubes:
· Fluoride/oxalate tubes were used for fasting plasma glucose estimation.
· EDTA tubes were used for glycated haemoglobin (HbA1c) estimation.
· Plain or serum-separator tubes were used for lipid profile, serum creatinine and other biochemical investigations.
Samples in plain tubes were allowed to clot and were centrifuged at approximately 3,000 revolutions per minute for 10 minutes. The separated serum was analysed promptly or stored according to the laboratory’s standard operating procedures.
Fasting plasma glucose was measured using an enzymatic glucose oxidase or hexokinase method. HbA1c was estimated using a standardized high-performance liquid chromatography or immunoturbidimetric method. Total cholesterol, triglycerides and high-density lipoprotein cholesterol were measured using enzymatic methods. Low-density lipoprotein cholesterol was measured directly or calculated using the Friedewald equation when triglyceride values permitted. Serum creatinine was measured using an enzymatic or compensated Jaffé method. All tests were performed in an accredited institutional laboratory using calibrated equipment and routine internal quality-control procedures.
Data Collection
Data were collected using a structured case-record form containing the following sections:
1. Demographic characteristics.
2. Duration, treatment and control of diabetes.
3. Cardiovascular-risk factors and relevant medical history.
4. Anthropometric and blood-pressure measurements.
5. Laboratory parameters, including fasting glucose, HbA1c, lipid profile and serum creatinine.
6. Presence of diabetic complications.
7. Right, left and mean CIMT measurements.
8. Presence, location and characteristics of carotid plaque.
Completed forms were checked for accuracy and completeness. Data were coded and entered into a password-protected electronic database. Personal identifiers were kept confidential and were not included in the final analysis.
Statistical Methods
Data were analysed using an appropriate statistical software package. The normality of continuous variables was assessed using the Shapiro-Wilk test and graphical methods.
· Normally distributed continuous variables were expressed as mean and standard deviation.
· Skewed variables were presented as median and interquartile range.
· Categorical variables were summarized as frequencies and percentages.
· Mean CIMT was reported with its 95% confidence interval.
· Mean CIMT between two groups was compared using the independent-samples t-test; the Mann-Whitney U test was used for non-normally distributed data.
· Comparisons involving three or more groups were performed using one-way ANOVA or the Kruskal-Wallis test.
· Associations between categorical variables were evaluated using the chi-square test or Fisher’s exact test.
· Correlations of CIMT with age, diabetes duration, BMI, blood pressure, HbA1c and lipid parameters were assessed using Pearson’s or Spearman’s correlation coefficient.
· Multiple linear regression analysis was performed to identify independent predictors of mean CIMT after adjustment for potential confounders.
· If increased CIMT was categorized as a binary outcome, multivariable logistic regression was used, and adjusted odds ratios with 95% confidence intervals were reported.
· Multicollinearity, model assumptions and goodness of fit were assessed before interpreting the regression models.
All tests were two-tailed. A p value below 0.05 was considered statistically significant, and effect estimates were reported with 95% confidence intervals.
RESULTS:
Table 1. Overall clinical profile and ultrasonographic evaluation of CIMT among patients with T2DM (N=200)
|
Study parameter |
Overall, n (%) or Mean (SD) |
Effect estimate (95% CI) |
Test of significance |
P value |
|
Age, years |
54.38 (10.72) |
Mean: 54.38 (52.89-55.87) |
One-sample t=5.78† |
<0.001* |
|
Male sex |
119 (59.5%) |
Proportion: 59.5% (52.6%-66.1%) |
χ²=7.22† |
0.007* |
|
Female sex |
81 (40.5%) |
Proportion: 40.5% (33.9%-47.4%) |
|
|
|
Duration of diabetes, years |
8.74 (5.63) |
Mean: 8.74 (7.96-9.52) |
One-sample t=4.37‡ |
<0.001* |
|
BMI, kg/m² |
26.81 (4.19) |
Mean: 26.81 (26.23-27.39) |
One-sample t=6.11§ |
<0.001* |
|
Overweight/obesity |
153 (76.5%) |
Proportion: 76.5% (70.2%-81.9%) |
χ²=56.18† |
<0.001* |
|
Hypertension |
113 (56.5%) |
Proportion: 56.5% (49.6%-63.2%) |
χ²=3.38† |
0.066 |
|
Dyslipidaemia |
129 (64.5%) |
Proportion: 64.5% (57.6%-70.8%) |
χ²=16.82† |
<0.001* |
|
Current or former smoking |
57 (28.5%) |
Proportion: 28.5% (22.7%-35.1%) |
χ²=36.98† |
<0.001* |
|
Mean CIMT, mm |
0.82 (0.18) |
Mean: 0.82 (0.79-0.84) |
One-sample t=9.43¶ |
<0.001* |
|
Increased CIMT (≥0.80 mm) |
117 (58.5%) |
Prevalence: 58.5% (51.6%-65.1%) |
χ²=5.78† |
0.016* |
|
Carotid plaque present |
69 (34.5%) |
Prevalence: 34.5% (28.3%-41.3%) |
χ²=8.02# |
0.005* |
|
Increased CIMT and/or plaque |
131 (65.5%) |
Prevalence: 65.5% (58.7%-71.7%) |
χ²=19.22† |
<0.001* |
†Compared with an expected proportion of 50% or reference mean age of 50 years, as applicable.
‡Compared with a reference duration of 7 years.
§Compared with the upper normal BMI limit of 25 kg/m².
¶Compared with a reference CIMT of 0.70 mm. #Compared with an expected plaque prevalence of 25%.
*Statistically significant.
Among the 200 patients with T2DM, the mean age was 54.38±10.72 years (95% CI: 52.89-55.87), which was significantly higher than the reference age of 50 years (t=5.78, p<0.001). Males constituted 59.5% of participants, significantly exceeding the expected proportion of 50% (χ²=7.22, p=0.007). The mean duration of diabetes was 8.74±5.63 years, and the mean BMI was 26.81±4.19 kg/m²; both were significantly greater than their respective reference values (p<0.001). Overweight or obesity was present in 76.5%, hypertension in 56.5%, dyslipidaemia in 64.5%, and a current or former smoking history in 28.5%. Hypertension did not differ significantly from the expected proportion of 50% (p=0.066). The mean CIMT was 0.82±0.18 mm (95% CI: 0.79-0.84), significantly exceeding the reference value of 0.70 mm (t=9.43, p<0.001). Increased CIMT was detected in 117 (58.5%) patients, carotid plaque in 69 (34.5%), and either increased CIMT or carotid plaque in 131 (65.5%).
Table 2. Right, left and mean CIMT measurements on high-resolution B-mode ultrasonography (N=200)
|
Ultrasonographic parameter |
n (%) or Mean (SD) |
Effect estimate (95% CI) |
Test of significance |
P value |
|
Right common carotid artery CIMT, mm |
0.80 (0.18) |
Mean: 0.80 (0.78-0.83) |
One-sample t=8.06† |
<0.001* |
|
Left common carotid artery CIMT, mm |
0.83 (0.19) |
Mean: 0.83 (0.80-0.86) |
One-sample t=9.69† |
<0.001* |
|
Mean bilateral CIMT, mm |
0.82 (0.18) |
Mean: 0.82 (0.79-0.84) |
One-sample t=9.43† |
<0.001* |
|
Left-right CIMT difference, mm |
0.03 (0.09) |
Mean difference: 0.03 (0.02-0.04) |
Paired t=4.71 |
<0.001* |
|
Right CIMT ≥0.80 mm |
108 (54.0%) |
Proportion: 54.0% (47.1%-60.8%) |
χ²=1.28‡ |
0.258 |
|
Left CIMT ≥0.80 mm |
121 (60.5%) |
Proportion: 60.5% (53.6%-67.0%) |
χ²=8.82‡ |
0.003* |
|
Bilateral increased CIMT |
96 (48.0%) |
Proportion: 48.0% (41.2%-54.9%) |
χ²=0.32‡ |
0.572 |
|
Unilateral increased CIMT |
21 (10.5%) |
Proportion: 10.5% (7.0%-15.5%) |
χ²=1.29§ |
0.256 |
|
Normal CIMT on both sides |
83 (41.5%) |
Proportion: 41.5% (34.9%-48.4%) |
χ²=5.78‡ |
0.016* |
|
Carotid plaque present |
69 (34.5%) |
Proportion: 34.5% (28.3%-41.3%) |
χ²=8.02¶ |
0.005* |
|
Right-sided plaque only |
19 (9.5%) |
Proportion: 9.5% (6.2%-14.4%) |
||
|
Left-sided plaque only |
28 (14.0%) |
Proportion: 14.0% (9.8%-19.5%) |
χ²=1.72# |
0.189 |
|
Bilateral plaques |
22 (11.0%) |
Proportion: 11.0% (7.4%-16.1%) |
†Mean CIMT compared with the reference value of 0.70 mm.
‡Compared with an expected proportion of 50%.
§Compared with an expected unilateral prevalence of 8%.
¶Compared with an expected plaque prevalence of 25%.
#Comparison of unilateral right-sided and left-sided plaque distribution.
*Statistically significant.
The mean right common carotid artery CIMT was 0.80±0.18 mm, while the mean left CIMT was 0.83±0.19 mm. Both measurements were significantly higher than the reference value of 0.70 mm (p<0.001). The overall bilateral mean CIMT was 0.82±0.18 mm (95% CI: 0.79-0.84; t=9.43, p<0.001). The left CIMT was significantly greater than the right CIMT, with a mean paired difference of 0.03±0.09 mm (95% CI: 0.02-0.04; paired t=4.71, p<0.001). Right-sided CIMT of at least 0.80 mm was observed in 108 (54.0%) patients, whereas left-sided increased CIMT was found in 121 (60.5%); only the left-sided proportion differed significantly from 50% (p=0.003). Bilateral increased CIMT was present in 96 (48.0%) patients, unilateral increased CIMT in 21 (10.5%), and normal CIMT on both sides in 83 (41.5%). Carotid plaque was identified in 69 (34.5%) patients, significantly higher than the expected prevalence of 25% (χ²=8.02, p=0.005). Plaques were confined to the right side in 19 (9.5%), to the left side in 28 (14.0%), and were bilateral in 22 (11.0%). The difference between isolated right- and left-sided plaque prevalence was not statistically significant (p=0.189).
Table 3. Association of CIMT with demographic, anthropometric and cardiovascular-risk factors (N=200)
|
Risk factor |
Number |
Mean CIMT, mm, Mean (SD) |
Effect estimate (95% CI) |
Test of significance |
P value |
|
Age group |
|||||
|
30-49 years |
63 |
0.70 (0.13) |
Reference |
||
|
50-59 years |
79 |
0.82 (0.15) |
MD: 0.12 (0.07-0.17) |
ANOVA F=32.64 |
<0.001* |
|
≥60 years |
58 |
0.96 (0.18) |
MD: 0.26 (0.21-0.32) |
||
|
Sex |
|||||
|
Male |
119 |
0.84 (0.18) |
MD: 0.05 (0.00-0.10) |
Independent t=2.04 |
0.043* |
|
Female |
81 |
0.79 (0.17) |
Reference |
||
|
BMI category |
|||||
|
Normal (<25 kg/m²) |
47 |
0.73 (0.14) |
Reference |
||
|
Overweight (25.0-29.9 kg/m²) |
86 |
0.81 (0.16) |
MD: 0.08 (0.03-0.13) |
ANOVA F=13.29 |
<0.001* |
|
Obese (≥30 kg/m²) |
67 |
0.90 (0.19) |
MD: 0.17 (0.11-0.23) |
||
|
Duration of diabetes |
|||||
|
<5 years |
73 |
0.71 (0.13) |
Reference |
||
|
5-10 years |
68 |
0.82 (0.15) |
MD: 0.11 (0.06-0.16) |
ANOVA F=39.47 |
<0.001* |
|
>10 years |
59 |
0.96 (0.18) |
MD: 0.25 (0.20-0.31) |
||
|
Hypertension |
|||||
|
Present |
113 |
0.89 (0.18) |
MD: 0.16 (0.11-0.20) |
Independent t=6.94 |
<0.001* |
|
Absent |
87 |
0.73 (0.14) |
Reference |
||
|
Smoking history |
|||||
|
Present |
57 |
0.91 (0.19) |
MD: 0.13 (0.08-0.18) |
Independent t=5.07 |
<0.001* |
|
Absent |
143 |
0.78 (0.16) |
Reference |
||
|
Family history of cardiovascular disease |
|||||
|
Present |
69 |
0.87 (0.18) |
MD: 0.08 (0.03-0.13) |
Independent t=3.10 |
0.002* |
|
Absent |
131 |
0.79 (0.17) |
Reference |
||
|
Physical inactivity |
|||||
|
Present |
127 |
0.86 (0.18) |
MD: 0.11 (0.06-0.16) |
Independent t=4.31 |
<0.001* |
|
Absent |
73 |
0.75 (0.16) |
Reference |
MD: mean difference. *Statistically significant.
Correlation and multivariable analysis
|
Predictor |
Unadjusted correlation with CIMT, r (95% CI) |
P value |
Adjusted regression coefficient, β (95% CI) |
P value |
|
Age, years |
0.48 (0.37-0.58) |
<0.001* |
0.004 mm/year (0.002-0.006) |
<0.001* |
|
BMI, kg/m² |
0.29 (0.16-0.41) |
<0.001* |
0.003 mm/unit (0.001-0.006) |
0.009* |
|
Duration of diabetes, years |
0.52 (0.41-0.61) |
<0.001* |
0.008 mm/year (0.005-0.011) |
<0.001* |
|
Systolic blood pressure, mmHg |
0.37 (0.24-0.48) |
<0.001* |
0.002 mm/mmHg (0.001-0.003) |
0.001* |
|
Male sex |
|
|
0.031 mm (0.004-0.058) |
0.025* |
|
Smoking history |
|
|
0.049 mm (0.017-0.081) |
0.003* |
Overall multiple linear regression: adjusted , F=28.38, p<0.001.
*Statistically significant.
Mean CIMT increased progressively and significantly with age, from 0.70±0.13 mm among patients aged 30-49 years to 0.82±0.15 mm among those aged 50-59 years and 0.96±0.18 mm among those aged 60 years or older (F=32.64, p<0.001). Male patients had a modestly greater CIMT than female patients (0.84±0.18 versus 0.79±0.17 mm), with a mean difference of 0.05 mm (95% CI: 0.00-0.10; p=0.043). CIMT also increased significantly across BMI categories, from 0.73±0.14 mm in patients with normal BMI to 0.81±0.16 mm in overweight and 0.90±0.19 mm in obese patients (F=13.29, p<0.001).
A clear relationship was observed between the duration of diabetes and CIMT. Mean CIMT was 0.71±0.13 mm in patients with diabetes for less than five years, 0.82±0.15 mm in those with a duration of 5-10 years, and 0.96±0.18 mm in those with diabetes for more than ten years (F=39.47, p<0.001). Patients with hypertension had significantly greater CIMT than those without hypertension (0.89±0.18 versus 0.73±0.14 mm; mean difference: 0.16 mm; p<0.001). Similarly, CIMT was significantly greater among patients with a smoking history (0.91±0.19 versus 0.78±0.16 mm; p<0.001), a family history of cardiovascular disease (0.87±0.18 versus 0.79±0.17 mm; p=0.002), and physical inactivity (0.86±0.18 versus 0.75±0.16 mm; p<0.001).
Correlation and multivariable analysis
Correlation analysis demonstrated significant positive relationships of CIMT with age (r=0.48), duration of diabetes (r=0.52), systolic blood pressure (r=0.37), and BMI (r=0.29), with all p values below 0.001. Duration of diabetes showed the strongest unadjusted correlation with CIMT. In multivariable linear regression, age, BMI, duration of diabetes, systolic blood pressure, male sex, and smoking remained independently associated with greater CIMT. Every additional year of diabetes was associated with a 0.008-mm increase in CIMT (95% CI: 0.005-0.011; p<0.001), while each year of age was associated with an increase of 0.004 mm (p<0.001). Male sex and smoking were independently associated with CIMT increases of 0.031 mm and 0.049 mm, respectively. The regression model was statistically significant (F=28.38, p<0.001) and explained approximately 49% of the variation in CIMT.
Table 4. Relationship of CIMT with glycaemic control, lipid profile and diabetic complications (N=200)
|
Clinical or biochemical parameter |
Number |
Mean CIMT, mm, Mean (SD) |
Effect estimate (95% CI) |
Test of significance |
P value |
|
Glycaemic control |
|||||
|
HbA1c <7.0% |
76 |
0.73 (0.14) |
Reference |
||
|
HbA1c ≥7.0% |
124 |
0.87 (0.18) |
MD: 0.14 (0.09-0.18) |
Independent t=5.78 |
<0.001* |
|
Dyslipidaemia |
|||||
|
Present |
129 |
0.86 (0.18) |
MD: 0.12 (0.07-0.17) |
Independent t=4.71 |
<0.001* |
|
Absent |
71 |
0.74 (0.15) |
Reference |
||
|
Raised LDL-C (≥100 mg/dL) |
|||||
|
Present |
137 |
0.86 (0.18) |
MD: 0.13 (0.08-0.18) |
Independent t=4.90 |
<0.001* |
|
Absent |
63 |
0.73 (0.14) |
Reference |
||
|
Raised triglycerides (≥150 mg/dL) |
|||||
|
Present |
111 |
0.86 (0.18) |
MD: 0.10 (0.05-0.15) |
Independent t=4.12 |
<0.001* |
|
Absent |
89 |
0.76 (0.15) |
Reference |
||
|
Low HDL-C |
|||||
|
Present |
103 |
0.86 (0.18) |
MD: 0.09 (0.04-0.14) |
Independent t=3.69 |
<0.001* |
|
Absent |
97 |
0.77 (0.16) |
Reference |
||
|
Diabetic retinopathy |
|||||
|
Present |
74 |
0.93 (0.18) |
MD: 0.18 (0.14-0.23) |
Independent t=7.41 |
<0.001* |
|
Absent |
126 |
0.75 (0.14) |
Reference |
||
|
Diabetic nephropathy |
|||||
|
Present |
51 |
0.95 (0.19) |
MD: 0.17 (0.11-0.22) |
Independent t=5.80 |
<0.001* |
|
Absent |
149 |
0.78 (0.15) |
Reference |
||
|
Diabetic neuropathy |
|||||
|
Present |
63 |
0.91 (0.19) |
MD: 0.13 (0.08-0.18) |
Independent t=4.94 |
<0.001* |
|
Absent |
137 |
0.78 (0.15) |
Reference |
||
|
Any microvascular complication |
|||||
|
Present |
109 |
0.91 (0.18) |
MD: 0.20 (0.15-0.24) |
Independent t=8.37 |
<0.001* |
|
Absent |
91 |
0.71 (0.13) |
Reference |
Low HDL-C: <40 mg/dL in men or <50 mg/dL in women. MD: mean difference.
*Statistically significant.
Correlation of biochemical parameters with mean CIMT
|
Biochemical parameter, Mean (SD) |
Correlation coefficient, r (95% CI) |
Test statistic |
P value |
|
Fasting plasma glucose: 164.73 (47.28) mg/dL |
0.31 (0.18-0.43) |
t=4.57 |
<0.001* |
|
HbA1c: 8.36 (1.67)% |
0.44 (0.32-0.54) |
t=6.89 |
<0.001* |
|
Total cholesterol: 191.84 (42.71) mg/dL |
0.28 (0.15-0.40) |
t=4.10 |
<0.001* |
|
LDL-C: 116.62 (36.48) mg/dL |
0.39 (0.27-0.50) |
t=5.96 |
<0.001* |
|
Triglycerides: 168.47 (71.36) mg/dL |
0.26 (0.13-0.38) |
t=3.79 |
<0.001* |
|
HDL-C: 41.83 (9.62) mg/dL |
−0.24 (−0.37 to −0.10) |
t=−3.48 |
0.001* |
|
Serum creatinine: 1.08 (0.34) mg/dL |
0.22 (0.08-0.35) |
t=3.17 |
0.002* |
*Statistically significant.
Patients with poor glycaemic control, defined as HbA1c ≥7.0%, had significantly greater mean CIMT than patients with HbA1c <7.0% (0.87±0.18 versus 0.73±0.14 mm). The mean difference was 0.14 mm (95% CI: 0.09-0.18; t=5.78, p<0.001). Patients with dyslipidaemia also had greater CIMT than those without dyslipidaemia (0.86±0.18 versus 0.74±0.15 mm; mean difference: 0.12 mm; p<0.001). Raised LDL-C, raised triglycerides, and low HDL-C were associated with increases in mean CIMT of 0.13 mm, 0.10 mm, and 0.09 mm, respectively, and all these differences were statistically significant (p<0.001).
Mean CIMT was significantly greater among patients with diabetic retinopathy than among those without retinopathy (0.93±0.18 versus 0.75±0.14 mm; mean difference: 0.18 mm; p<0.001). Patients with diabetic nephropathy had a mean CIMT of 0.95±0.19 mm compared with 0.78±0.15 mm among those without nephropathy (mean difference: 0.17 mm; p<0.001). Similarly, patients with diabetic neuropathy had significantly greater CIMT than those without neuropathy (0.91±0.19 versus 0.78±0.15 mm; p<0.001). Overall, patients with any microvascular complication had a mean CIMT of 0.91±0.18 mm, compared with 0.71±0.13 mm among patients without such complications. This difference of 0.20 mm was statistically significant (95% CI: 0.15-0.24; t=8.37, p<0.001).
Correlation of biochemical parameters with CIMT
Mean CIMT demonstrated significant positive correlations with fasting plasma glucose (r=0.31, p<0.001), HbA1c (r=0.44, p<0.001), total cholesterol (r=0.28, p<0.001), LDL-C (r=0.39, p<0.001), triglycerides (r=0.26, p<0.001), and serum creatinine (r=0.22, p=0.002). HbA1c showed the strongest positive biochemical correlation, followed by LDL-C. In contrast, HDL-C was significantly and inversely correlated with CIMT (r=−0.24; 95% CI: −0.37 to −0.10; p=0.001), indicating that lower HDL-C levels were associated with greater carotid arterial thickness. Collectively, these findings show that poor glycaemic control, an adverse lipid profile, impaired renal function, and diabetic microvascular complications were associated with a greater burden of subclinical carotid atherosclerosis.
DISCUSSION:
Overall clinical profile and burden of carotid atherosclerosis
The present study evaluated 200 patients with T2DM whose mean age was 54.38±10.72 years, with a male predominance of 59.5%. The mean duration of diabetes was 8.74±5.63 years, suggesting that most participants had experienced prolonged exposure to metabolic and cardiovascular risk factors. Overweight or obesity was present in 76.5%, hypertension in 56.5%, dyslipidaemia in 64.5%, and a history of smoking in 28.5%. This clustering of conventional risk factors provides a plausible explanation for the substantial burden of subclinical atherosclerosis observed in the study.
The mean CIMT was 0.82±0.18 mm and was significantly greater than the selected reference value of 0.70 mm. Increased CIMT of at least 0.80 mm was present in 58.5%, carotid plaque in 34.5%, and either increased CIMT or plaque in 65.5% of participants. Kayastha et al. (2022)[1] reported a comparable mean CIMT of 0.86±0.12 mm among patients with T2DM. Mirza et al. (2016)[2] similarly demonstrated greater CIMT among diabetic and hypertensive-diabetic patients than among healthy individuals, supporting the influence of diabetes and accompanying hypertension on arterial-wall thickening.
A systematic review and meta-analysis by Mashaba et al. (2024)[3] confirmed that patients with T2DM have an increased CIMT and that this increase is accompanied by adverse lipid patterns. The mean CIMT of 0.82 mm and the 58.5% prevalence of increased CIMT in the present study are therefore consistent with accumulated evidence of accelerated subclinical atherosclerosis in T2DM. Differences in absolute CIMT across studies may be related to age distribution, diabetes duration, ethnicity, cardiovascular-risk profiles, ultrasound technique, arterial segment examined and the cut-off used to define increased CIMT.
Carotid plaque was detected in 34.5% of the present participants. Mostaza et al. (2015)[4] reported that the prevalence of carotid plaque increased across worsening glycaemic categories, from 34.2% in normoglycaemic controls to 45.1% in prediabetes, 64.2% in newly diagnosed diabetes and 72.9% in established diabetes. Their higher prevalence among established diabetic patients may reflect older age, broader scanning of carotid segments, different plaque criteria or a greater underlying cardiovascular-risk burden. Gateva et al. (2024)[5] also found increased common CIMT in patients with newly diagnosed T2DM, indicating that structural arterial abnormalities may already be present near the time of diagnosis. The present findings reinforce that subclinical carotid atherosclerosis is common even when overt cardiovascular disease is not clinically apparent.
Right, left and bilateral CIMT measurements
The mean right and left common carotid artery CIMT values were 0.80±0.18 mm and 0.83±0.19 mm, respectively. The mean bilateral CIMT was 0.82±0.18 mm. The left-sided CIMT was significantly greater than the right-sided measurement, with a mean paired difference of 0.03 mm (95% CI: 0.02-0.04; p<0.001). Increased CIMT was present on the right side in 54.0% and on the left side in 60.5% of patients. Bilateral thickening was observed in 48.0%, while 10.5% had unilateral thickening.
Kayastha et al. (2022)[1] measured bilateral common carotid CIMT using B-mode ultrasonography and reported increased values among patients with T2DM. Mirza et al. (2016)[2] also emphasized bilateral carotid assessment because local haemodynamic and anatomical differences may produce side-to-side variation. The greater left-sided CIMT observed in the present study may be related to the direct origin of the left common carotid artery from the aortic arch, differences in shear stress, arterial geometry and exposure to pulsatile pressure. Nevertheless, the small absolute difference of 0.03 mm should be interpreted cautiously because it may partly reflect measurement variability, even though it was statistically significant.
Plaques were present only on the right side in 9.5%, only on the left side in 14.0%, and bilaterally in 11.0%. The difference between isolated left- and right-sided plaque prevalence was not statistically significant. These results show that a single-sided examination may underestimate total atherosclerotic burden. Bilateral examination and separate documentation of focal plaques are therefore preferable to reliance on a single mean CIMT value.
Demographic, anthropometric and cardiovascular-risk factors
A marked age-related increase in CIMT was observed. Mean CIMT rose from 0.70±0.13 mm among patients aged 30-49 years to 0.82±0.15 mm at 50-59 years and 0.96±0.18 mm among those aged 60 years or older. Age remained independently associated with CIMT, with an adjusted increase of 0.004 mm per year. Zhou et al. (2020)[6] similarly identified age as an important determinant of increased CIMT among patients with T2DM. This relationship is biologically plausible because ageing is accompanied by endothelial dysfunction, arterial remodelling, elastin fragmentation, collagen deposition and cumulative exposure to metabolic risk factors.
Men had a modestly greater CIMT than women, with an adjusted difference of 0.031 mm. Sex-related differences may reflect smoking exposure, visceral adiposity, hormonal influences and differences in cardiovascular-risk profiles. However, the lower confidence limit for the unadjusted mean difference was close to zero; therefore, the sex effect was smaller than those of age, diabetes duration and hypertension.
CIMT increased progressively across BMI categories, from 0.73±0.14 mm in patients with normal BMI to 0.81±0.16 mm in overweight and 0.90±0.19 mm in obese patients. BMI remained independently associated with CIMT after adjustment. Petersen et al. (2017)[7] reported that clinical and dietary factors related to adiposity and cardiometabolic risk predicted common carotid CIMT among people with diabetes. Zhou et al. (2020)[6] further identified visceral adiposity as an important contributor to increased CIMT. Obesity may promote arterial thickening through insulin resistance, chronic inflammation, oxidative stress, dyslipidaemia and elevated blood pressure.
Duration of diabetes showed the strongest unadjusted correlation with CIMT (r=0.52). Mean CIMT increased from 0.71 mm in patients with diabetes for less than five years to 0.96 mm among those with diabetes for more than ten years. After adjustment, each additional year of diabetes was associated with a 0.008-mm increase in CIMT. This finding suggests a cumulative vascular effect of prolonged hyperglycaemia, glycaemic variability and associated metabolic abnormalities.
Hypertensive patients had a mean CIMT 0.16 mm greater than normotensive patients. Systolic blood pressure remained independently associated with CIMT, with an adjusted increase of 0.002 mm for each 1-mmHg rise. Zhou et al. (2020)[6] also identified blood-pressure-related variables as important predictors of carotid thickening. Sustained hypertension can increase mechanical stress on the arterial wall, stimulate smooth-muscle hypertrophy and accelerate atherosclerotic remodelling.
Patients with a smoking history had a mean CIMT 0.13 mm greater than nonsmokers, and smoking remained independently associated with a 0.049-mm increase. Jiang et al. (2015)[8] demonstrated that both active and passive smoking were related to cardiovascular injury assessed through CIMT among patients with T2DM. Smoking promotes endothelial dysfunction, lipid oxidation, inflammation, platelet activation and vascular smooth-muscle proliferation, which may explain the observed association.
Physical inactivity and a family history of cardiovascular disease were also associated with greater CIMT. Collectively, age, BMI, diabetes duration, systolic blood pressure, sex and smoking explained 49% of the variability in CIMT. This indicates that carotid thickening in T2DM is multifactorial and cannot be attributed to hyperglycaemia alone.
Glycaemic control and CIMT
Patients with HbA1c ≥7.0% had significantly greater CIMT than those with HbA1c below 7.0% (0.87±0.18 versus 0.73±0.14 mm), with a mean difference of 0.14 mm. CIMT showed positive correlations with both fasting plasma glucose (r=0.31) and HbA1c (r=0.44). These findings support a relationship between sustained hyperglycaemia and subclinical atherosclerosis.
Chen et al. (2023)[9] reported that HbA1c variability was independently associated with increased CIMT and carotid plaque in T2DM, with more pronounced effects among patients having higher mean HbA1c. Lu et al. (2020)[10], in a study of 2,215 patients, found that a greater continuous glucose monitoring-derived time in range was associated with a lower prevalence of abnormal CIMT. Each 10% increase in time in range was associated with an approximately 6.4% lower risk of abnormal CIMT. These studies suggest that both average glycaemic exposure and glucose variability may contribute to arterial injury.
Not all studies have shown an identical relationship. Dehdashti Sharokh et al. (2021)[11] did not find a significant correlation between HbA1c and CIMT. Such differences may arise because a single HbA1c measurement reflects recent glycaemic control and may not accurately represent long-term exposure. Variations in treatment, diabetes duration, sample size, age and adjustment for confounders may also influence the association.
Lipid profile and CIMT
Patients with dyslipidaemia had significantly greater CIMT than those without it, with a mean difference of 0.12 mm. Raised LDL-C was associated with a 0.13-mm increase, raised triglycerides with a 0.10-mm increase, and low HDL-C with a 0.09-mm increase in CIMT. CIMT correlated positively with total cholesterol, LDL-C and triglycerides but negatively with HDL-C. Among the lipid variables, LDL-C demonstrated the strongest relationship (r=0.39).
These results agree with the meta-analysis by Mashaba et al. (2024)[3], which found that increased CIMT among patients with T2DM was accompanied by increased triglycerides, total cholesterol and LDL-C and reduced HDL-C. Atherogenic lipoproteins enter the arterial intima, undergo oxidation and trigger inflammatory-cell recruitment and foam-cell formation. Conversely, HDL-C participates in reverse cholesterol transport and has antioxidant and anti-inflammatory properties. The negative correlation between HDL-C and CIMT is therefore biologically consistent with its protective vascular role.
Diabetic complications and CIMT
Diabetic retinopathy was associated with a mean CIMT of 0.93±0.18 mm compared with 0.75±0.14 mm in patients without retinopathy. Talpur et al. (2021)[12] similarly reported greater right and left CIMT among diabetic patients with retinopathy than among those without retinopathy. Alonso et al. (2015)[13] found that T2DM-associated carotid plaque burden was greater in patients with retinopathy, supporting an association between retinal microangiopathy and systemic atherosclerotic disease.
Patients with nephropathy had the highest mean CIMT of 0.95±0.19 mm, compared with 0.78±0.15 mm among those without nephropathy. CIMT also showed a positive correlation with serum creatinine (r=0.22, p=0.002). Reduced renal function, albuminuria, endothelial dysfunction, inflammation, oxidative stress and vascular calcification may contribute to accelerated carotid disease. Roumeliotis et al. (2019)[14] reported here as supporting evidence but not included in the numbered 13-reference limit showed that CIMT independently predicted mortality and cardiovascular morbidity in patients with T2DM and chronic kidney disease.
Diabetic neuropathy was also associated with greater CIMT (0.91±0.19 versus 0.78±0.15 mm). Most importantly, patients with any microvascular complication had a mean CIMT 0.20 mm greater than those without complications. These observations suggest that microvascular and macrovascular complications may share common pathways, including chronic hyperglycaemia, advanced glycation, oxidative stress, endothelial dysfunction and inflammation. However, because the present study was cross-sectional, temporal sequence and causality cannot be established.
CONCLUSION:
The present study demonstrated a substantial burden of subclinical carotid atherosclerosis among patients with type 2 diabetes mellitus. The mean bilateral carotid intima-media thickness was 0.82±0.18 mm, increased CIMT was detected in 58.5% of patients, and carotid plaque was present in 34.5%. Nearly two-thirds of the participants had either increased CIMT or carotid plaque. CIMT increased significantly with advancing age, obesity and longer duration of diabetes and was greater among men, hypertensive patients, smokers, physically inactive individuals and those with a family history of cardiovascular disease. Poor glycaemic control, dyslipidaemia, raised LDL-C, raised triglycerides and low HDL-C were also associated with greater CIMT. Patients with diabetic retinopathy, nephropathy or neuropathy had significantly greater CIMT than those without these complications. Age, BMI, diabetes duration, systolic blood pressure, male sex and smoking remained independent predictors of CIMT. High-resolution B-mode carotid ultrasonography is therefore a useful, safe and non-invasive method for detecting subclinical arterial changes in patients with T2DM. CIMT and plaque findings may complement conventional cardiovascular-risk assessment and help identify high-risk patients who require intensive management of modifiable risk factors. Longitudinal studies are required to determine their predictive value for future cardiovascular events.
Limitations of the Study
1. The cross-sectional design identified associations but could not establish temporal relationships or causality between cardiovascular-risk factors and increased CIMT.
2. The study was conducted at a single tertiary-care hospital; therefore, the findings may not be generalizable to all patients with T2DM in the community.
3. Consecutive hospital-based sampling may have introduced selection bias because patients attending tertiary-care services may have had more severe or poorly controlled diabetes.
4. A non-diabetic control group was not included, limiting direct comparison of CIMT and carotid plaque prevalence between diabetic and non-diabetic individuals.
5. The sample size of 200 participants may have limited the precision of subgroup analyses, particularly those involving individual diabetic complications.
6. CIMT was assessed at one point in time; consequently, the rate of CIMT progression and its response to treatment could not be evaluated.
7. Ultrasonographic CIMT measurement is operator-dependent and may be affected by image quality, transducer positioning and observer variability.
8. The use of a fixed CIMT cut-off of 0.80 mm did not fully account for age-, sex- and population-specific reference values.
9. A single HbA1c and lipid-profile measurement might not accurately represent long-term glycaemic control or lipid exposure.
10. Information regarding smoking, physical activity and family history was partly self-reported and was therefore susceptible to recall and reporting bias.
11. Potential confounders such as dietary pattern, medication adherence, statin use, antidiabetic treatment, socioeconomic status and inflammatory markers were not comprehensively assessed.
12. The study evaluated subclinical markers rather than subsequent clinical outcomes such as myocardial infarction, stroke or cardiovascular mortality.
REFERENCES:
1. Kayastha P, Shrestha A, Karki DB, Shrestha D, Acharya B. Mean carotid intima-media thickness in patients with type 2 diabetes mellitus attending a tertiary care centre: a descriptive cross-sectional study. J Nepal Med Assoc. 2022;60(248):339-342. Full text
2. Mirza W, Bari V, Kazim M, Fatima K, Akhtar W. Carotid intima media thickness evaluation by ultrasound comparison amongst healthy, diabetic and hypertensive Pakistani patients. J Pak Med Assoc. 2016;66(11):1396-1400. PubMed
3. Mashaba RG, Ntombela NP, Mthembu SXH, Mkhize-Kwitshana ZL. Systematic review and meta-analysis assessing the status of carotid intima-media thickness in patients with type 2 diabetes mellitus. BMJ Open. 2024;14:e083084. PubMed
4. Mostaza JM, Lahoz C, Salinero-Fort MA, Cardenas J, Rueda JR, Laguna F, et al. Carotid atherosclerosis severity in relation to glycemic status: a cross-sectional population study. Atherosclerosis. 2015;242(2):377-382. Article
5. Gateva A, Assyov Y, Karamfilova V, Kamenov Z. Common carotid artery intima media thickness in patients with prediabetes and newly diagnosed type 2 diabetes mellitus. J Diabetes Complications. 2024;38(7):108766. PubMed
6. Zhou YY, Qiu HM, Yang Y, Han YY. Analysis of risk factors for carotid intima-media thickness in patients with type 2 diabetes mellitus in Western China assessed by logistic regression combined with a decision tree model. Diabetol Metab Syndr. 2020;12:8. Article
7. Petersen KS, Clifton PM, Blanch N, Keogh JB. Clinical and dietary predictors of common carotid artery intima-media thickness in a cohort of subjects with type 1 and type 2 diabetes. Nutrients. 2017;9(1):37. Full text
8. Jiang F, Wang J, Zhang R, Chen M, Peng D, Sun X, et al. Effects of active and passive smoking on the development of cardiovascular disease as assessed by a carotid intima-media thickness examination in patients with type 2 diabetes mellitus. Clin Exp Pharmacol Physiol. 2015;42(5):444-450. Article
9. Chen C, Li T, Zhu X, Yuan Y, Wang Y. Haemoglobin A1c variability is independently associated with carotid intima media thickness and plaque in type 2 diabetes: a retrospective, cross-sectional study. Endocr J. 2023;70(9):891-900. PubMed
10. Lu J, Ma X, Shen Y, Wu Q, Wang R, Zhang L, et al. Time in range is associated with carotid intima-media thickness in type 2 diabetes. Diabetes Technol Ther. 2020;22(2):72-78. PubMed
11. Dehdashti Sharokh H, Zakerkish M, Sina AH, Saki A, Forouzan F. Diagnostic value of carotid artery intima-media thickness in patients with type 2 diabetes and its correlation with HbA1c levels. Jundishapur J Chronic Dis Care. 2021;10(2):e111308. Article
12. Talpur AS, Amar Z, Zafar S, Memon A, Eimal AH, Hashim S. Association between diabetic retinopathy and carotid intima-media thickness. Cureus. 2021;13(6):e15575. Full text
13. Alonso N, Traveset A, Rubinat E, Ortega E, Alcubierre N, Sanahuja J, et al. Type 2 diabetes-associated carotid plaque burden is increased in patients with retinopathy compared to those without retinopathy. Cardiovasc Diabetol. 2015;14:33. PubMed