Morphological and Hematological Spectrum of Megaloblastic Anemia: Correlation with Cytopenia and Vitamin Deficiency Patterns.
- Ritu , Associate professor, Department of Pathology IQ city medical College Durgapur.
Article Information:
Abstract:
Background: Megaloblastic anemia is a hematological disorder characterized by ineffective hematopoiesis and distinctive morphological abnormalities resulting primarily from impaired DNA synthesis. Although macrocytosis and hypersegmented neutrophils are considered classical findings, the disease may present with a wide range of peripheral blood and bone marrow changes, including multilineagecytopenia. The present study aimed to evaluate the morphological spectrum of megaloblastic anemia and its relationship with hematological and biochemical abnormalities. Materials and Methods: Bone marrow examination was available in 84 patients. Statistical analysis was performed to determine associations between morphological severity and cytopenia patterns, with P< 0.05 considered statistically significant. Results: The mean age of the patients was 37.6 ± 15.4 years, with a slight male predominance. The mean hemoglobin concentration was 7.6 ± 1.9 g/dL, and 42.7% of patients had severe anemia. Bicytopenia was present in 38.2%, isolated anemia in 35.5%, and pancytopenia in 26.4%. Macro-ovalocytes (95.5%), macrocytosis (92.7%), anisopoikilocytosis (90.9%), and hypersegmented neutrophils (88.2%) were the predominant peripheral smear abnormalities. Conclusion: Megaloblastic anemia exhibits a broad morphological spectrum involving multiple hematopoietic lineages. Peripheral smear examination remains highly valuable for diagnosis, while bone marrow morphology helps characterize disease severity in selected cases.
Keywords:
Article :
INTRODUCTION:
Megaloblastic anemia is a distinctive hematological disorder characterized by ineffective hematopoiesis resulting primarily from impaired deoxyribonucleic acid (DNA) synthesis. The abnormality particularly affects rapidly proliferating cells of the bone marrow and produces characteristic morphological alterations in erythroid, myeloid, and megakaryocytic precursors. Although vitamin B12 and folate deficiencies constitute the most frequent causes, megaloblastic hematopoiesis may also occur as a consequence of drugs interfering with DNA synthesis, congenital disorders of nucleotide metabolism, malabsorption syndromes, and other uncommon metabolic abnormalities [1]. The morphological expression of megaloblastic anemia is therefore broad and may vary considerably according to the severity and duration of deficiency, associated nutritional deficiencies, underlying disease, and prior treatment.
The fundamental morphological abnormality in megaloblastic anemia is nuclear-cytoplasmic asynchrony. Defective DNA synthesis delays nuclear maturation and cell division, while ribonucleic acid and cytoplasmic maturation proceed relatively normally. Consequently, hematopoietic precursor cells become unusually large, with immature nuclei relative to their cytoplasmic development [2]. In the erythroid series, the bone marrow characteristically demonstrates erythroid hyperplasia with megaloblasts showing large cell size, open or finely dispersed nuclear chromatin, and relatively mature hemoglobinized cytoplasm. These changes are especially prominent in intermediate and later erythroid precursors. Ineffective erythropoiesis is marked, with a substantial proportion of abnormal erythroid precursors undergoing intramedullary destruction before reaching the peripheral circulation [2].
Peripheral blood examination continues to provide important morphological clues to the diagnosis. The classical picture includes macrocytosis, macro-ovalocytes, anisocytosis, poikilocytosis, and hypersegmented neutrophils. Hypersegmentation is generally identified by the presence of neutrophils with excessive nuclear lobulation and may appear even before overt anemia or marked macrocytosis develops [3,4]. The mean corpuscular volume is commonly elevated; however, macrocytosis is not invariably present. Concurrent iron deficiency, thalassemia, chronic inflammatory disease, or other conditions producing microcytosis may reduce or completely mask the increase in mean corpuscular volume. Consequently, reliance on automated red-cell indices alone may result in missed cases, emphasizing the continuing diagnostic importance of morphological assessment of the peripheral smear [3].
The hematological spectrum of vitamin B12 and folate deficiency ranges from isolated macrocytosis or mild anemia to severe anemia, leukopenia, thrombocytopenia, bicytopenia, or pancytopenia [5]. In a study of patients with documented cobalamin deficiency, macrocytosis and hypersegmented neutrophils were frequent but not universal findings, while smaller proportions demonstrated leukopenia, thrombocytopenia, severe anemia, pancytopenia, hemolytic manifestations, or pseudo-thrombotic microangiopathy [6]. These findings illustrate that the morphological presentation of megaloblastic anemia can be heterogeneous and may extend beyond the conventional picture of uncomplicated macrocytic anemia.
Bone marrow morphology provides further evidence of ineffective hematopoiesis. The marrow is generally hypercellular because of erythroid hyperplasia, despite reduced numbers of mature erythrocytes in the circulation. Megaloblastic erythroid precursors coexist with abnormalities of granulopoiesis, including unusually large granulocytic precursors and giant metamyelocytes. Abnormal nuclear maturation may also occur in the megakaryocytic lineage, particularly in severe deficiency [1,2]. These multilineage abnormalities can occasionally resemble myelodysplastic syndromes, making correlation with clinical findings, vitamin assays, biochemical markers, and therapeutic response essential for avoiding diagnostic misclassification [7].
The morphological spectrum may become even more complex in severe disease. Marked anisopoikilocytosis, nucleated red blood cells, basophilic stippling, Howell-Jolly bodies, and fragmented erythrocytes may occasionally be encountered. Severe vitamin B12 deficiency can produce intramedullary hemolysis associated with markedly elevated lactate dehydrogenase concentrations, low haptoglobin levels, thrombocytopenia, and schistocytosis. Such cases may mimic thrombotic thrombocytopenic purpura or other forms of thrombotic microangiopathy, a presentation described as pseudo-thrombotic microangiopathy [8]. Recognition of accompanying macro-ovalocytes, hypersegmented neutrophils, inadequate reticulocytosis, and evidence of cobalamin deficiency is important because management differs fundamentally from that of true thrombotic microangiopathy.
Vitamin B12 and folate deficiencies remain important causes of megaloblastic hematopoiesis, particularly in populations where nutritional inadequacy, vegetarian dietary patterns, gastrointestinal malabsorption, and socioeconomic factors are prevalent. Indian studies have demonstrated that megaloblastic anemia continues to represent a clinically relevant nutritional hematological disorder and that vitamin B12 deficiency may occur alone or together with folate deficiency [9]. The clinical and hematological presentation, however, does not always correlate directly with serum vitamin concentrations. Mild biochemical deficiency may occur without classical morphological abnormalities, whereas established deficiency may produce extensive marrow changes and multiple cytopenias [10].
From a diagnostic perspective, recognition of the complete morphological spectrum is important because megaloblastic anemia may mimic several hematological disorders, including myelodysplastic syndromes, aplastic disorders, acute leukemia, hemolytic anemia, and thrombotic microangiopathy. Conversely, associated iron deficiency or hemoglobinopathy may obscure the classical macrocytic picture. A careful examination of peripheral blood and, where clinically indicated, bone marrow therefore remains valuable in establishing the diagnosis and determining the extent of hematopoietic involvement [11]. Understanding the morphological spectrum also assists in correlating cytological abnormalities with the severity of anemia and other cytopenias and in recognizing atypical presentations. Therefore, systematic evaluation of peripheral blood and bone marrow morphology in patients with megaloblastic anemia can provide important information regarding the diversity of hematological manifestations and facilitate timely diagnosis and appropriate treatment.
MATERIALS AND METHODS:
Study design and setting
This hospital-based observational cross-sectional study was conducted in the Department of Pathology. The study included patients evaluated for anemia and subsequently diagnosed with megaloblastic anemia on the basis of hematological, morphological, and biochemical findings. A total of 110 consecutive eligible patients were enrolled during the predefined study period. The study was designed to characterize the peripheral blood and bone marrow morphological spectrum of megaloblastic anemia and to assess its association with hematological parameters and underlying vitamin deficiency.
Study population
Patients of either sex presenting to the outpatient departments or admitted to various clinical departments of the hospital with clinical or laboratory evidence of anemia were screened for eligibility. Patients showing findings suggestive of megaloblastic hematopoiesis on peripheral blood examination and/or bone marrow evaluation were further investigated for vitamin B12 and folate deficiency. Only patients satisfying the predefined diagnostic criteria and having adequate clinical and laboratory records were included in the final analysis.
Sample size and sampling technique
A total of 110 patients fulfilling the eligibility criteria were included in the study. Consecutive sampling was employed, whereby all eligible patients diagnosed during the study period were recruited until the required sample size was achieved. This approach was adopted to minimize selection bias and to ensure representation of the morphological variability encountered in routine clinical practice.
Inclusion criteria
Patients were included if they fulfilled the following criteria:
1. Patients with anemia supported by complete blood count findings.
2. Patients showing peripheral blood morphology suggestive of megaloblastic anemia, including macro-ovalocytosis, anisopoikilocytosis, and/or hypersegmented neutrophils.
3. Patients demonstrating megaloblastic changes on bone marrow examination where bone marrow aspiration was clinically indicated and performed.
4. Patients with available serum vitamin B12 and/or folate estimation supporting a nutritional or biochemical basis for megaloblastic hematopoiesis.
5. Patients of either sex and all eligible age groups with complete clinical and laboratory data.
Exclusion criteria
Patients were excluded in the presence of:
1. Recent blood transfusion before hematological evaluation, where transfusion was considered likely to significantly alter peripheral blood morphology.
2. Previously diagnosed megaloblastic anemia already receiving vitamin B12 or folate supplementation for a sufficient duration to modify hematological findings.
3. Macrocytosis attributable primarily to chronic liver disease, alcohol-related disorders, hypothyroidism, or other established non-megaloblastic causes in the absence of morphological evidence of megaloblastic hematopoiesis.
4. Confirmed primary bone marrow disorders such as myelodysplastic syndrome, acute leukemia, aplastic anemia, or marrow infiltration.
5. Inadequate peripheral smear or bone marrow material for morphological assessment.
6. Incomplete clinical or essential laboratory data.
Clinical evaluation
A detailed clinical history was obtained for each patient using a structured data-collection format. Information regarding age, sex, presenting complaints, duration of symptoms, dietary pattern, nutritional status, gastrointestinal symptoms, previous gastrointestinal surgery, chronic illness, drug intake, alcohol consumption, history of recurrent infections, bleeding manifestations, neurological symptoms, and previous treatment with hematinic agents was recorded.
Clinical examination included assessment for pallor, icterus, glossitis, angular cheilitis, pigmentation, hepatomegaly, splenomegaly, lymphadenopathy, neurological abnormalities, and other relevant systemic findings.
Hematological investigations
Venous blood was collected under aseptic precautions into ethylenediaminetetraacetic acid-containing tubes for hematological investigations. Complete blood counts were performed using an automated hematology analyzer following the manufacturer's quality-control procedures. The following parameters were recorded:
• Hemoglobin concentration
• Total leukocyte count
• Platelet count
• Red blood cell count
• Hematocrit
• Mean corpuscular volume
• Mean corpuscular hemoglobin
• Mean corpuscular hemoglobin concentration
• Red cell distribution width
Based on leukocyte and platelet counts, patients were categorized according to the hematological pattern as isolated anemia, bicytopenia, or pancytopenia.
Peripheral blood smear examination
Peripheral blood smears were prepared immediately after sample collection and stained using Leishman, Wright-Giemsa, or the routinely standardized Romanowsky stain used in the study laboratory. Smears were independently examined for red-cell, white-cell, and platelet morphology.
Red-cell assessment included the presence and degree of macrocytosis, macro-ovalocytes, anisocytosis, poikilocytosis, polychromasia, nucleated red blood cells, basophilic stippling, Howell-Jolly bodies, and fragmented erythrocytes, wherever present. Particular attention was given to the identification of macro-ovalocytes characteristic of megaloblastic erythropoiesis.
Neutrophils were evaluated for nuclear hypersegmentation. Hypersegmented neutrophils were recorded when neutrophils demonstrated excessive nuclear lobulation consistent with megaloblastic change. The presence of leukopenia, abnormal granulocyte morphology, and platelet reduction or morphological abnormalities was also documented.
Peripheral smear findings were categorized according to the predominant morphological pattern to determine the frequency and variability of classical and atypical manifestations of megaloblastic anemia.
Reticulocyte assessment
Reticulocyte counts were obtained wherever available or clinically indicated. Reticulocyte response was interpreted in conjunction with the degree of anemia. A relatively low or inadequate reticulocyte response despite significant anemia was considered supportive of ineffective erythropoiesis.
Bone marrow examination
Bone marrow aspiration was performed only when clinically indicated as part of the diagnostic evaluation and was not undertaken solely for research purposes. The posterior superior iliac spine was used as the preferred aspiration site in adults, while an appropriate age-specific site was selected in pediatric patients according to institutional practice.
Bone marrow aspirate smears were prepared immediately, air-dried, and stained with an appropriate Romanowsky stain. The smears were evaluated systematically for overall cellularity, myeloid-to-erythroid ratio, erythroid maturation, granulocytic maturation, megakaryocytic morphology, iron status where staining was available, and the presence of abnormal or infiltrative cells.
Assessment of megaloblastic morphology
The principal morphological feature evaluated in the erythroid lineage was nuclear-cytoplasmic asynchrony, characterized by delayed nuclear maturation with relatively advanced cytoplasmic maturation. Megaloblasts were identified on the basis of increased cell size, open or immature nuclear chromatin, and comparatively mature hemoglobinized cytoplasm.
The following marrow findings were specifically documented:
• Erythroid hyperplasia
• Megaloblastic erythropoiesis
• Nuclear-cytoplasmic asynchrony
• Abnormal nuclear chromatin pattern
• Binucleation or multinucleation of erythroid precursors
• Nuclear budding or irregularity
• Giant metamyelocytes
• Giant band forms
• Abnormal granulocytic maturation
• Megakaryocytic abnormalities
• Evidence of ineffective hematopoiesis
The degree of megaloblastic change was categorized as mild, moderate, or marked according to the extent of morphological involvement and the proportion of affected hematopoietic precursors, using consistent predefined morphological criteria throughout the study.
Biochemical evaluation
Serum vitamin B12 and folate levels were estimated using the routinely validated assay platform available in the institutional laboratory. Deficiency was defined according to the reference interval and validated cut-off values provided by the laboratory and assay manufacturer.
Based on biochemical findings, patients were classified into the following etiological groups:
1. Predominant vitamin B12 deficiency
2. Predominant folate deficiency
3. Combined vitamin B12 and folate deficiency
4. Morphologically confirmed megaloblastic anemia without definitive biochemical categorization, where applicable
Additional biochemical investigations, including serum bilirubin, lactate dehydrogenase, liver function tests, renal function tests, thyroid profile, iron profile, and other relevant investigations, were recorded where clinically available. Increased lactate dehydrogenase and indirect bilirubin concentrations were interpreted as supportive evidence of ineffective erythropoiesis and intramedullary cell destruction.
Morphological classification and study variables
For analysis, the morphological spectrum was evaluated at two levels. Peripheral blood findings were classified according to the presence of macrocytosis, macro-ovalocytosis, hypersegmented neutrophils, anisopoikilocytosis, nucleated red blood cells, cytopenias, and other atypical features. Bone marrow findings were categorized according to cellularity, erythroid hyperplasia, severity of megaloblastic change, nuclear-cytoplasmic asynchrony, giant granulocytic precursors, and megakaryocytic alterations.
The primary outcome measure was the frequency and distribution of various peripheral blood and bone marrow morphological patterns among patients with megaloblastic anemia. Secondary outcomes included the relationship of morphological abnormalities with hemoglobin level, mean corpuscular volume, leukocyte count, platelet count, pattern of cytopenia, and vitamin B12/folate status.
Quality assurance and bias control
All blood and marrow samples were processed according to standardized departmental protocols. Internal quality-control procedures were followed for automated hematology and biochemical investigations. Morphological evaluation was performed using predefined diagnostic criteria to reduce observer-related variability. Ambiguous or atypical smears were reviewed by an experienced pathologist/hematologist, and consensus diagnosis was used where required.
Consecutive recruitment was employed to reduce selection bias. Clinical and laboratory findings were recorded using a uniform case-record form, and data were checked for completeness before statistical analysis. Morphological interpretation was correlated with biochemical and clinical findings to reduce diagnostic misclassification, particularly in cases potentially resembling myelodysplastic or other marrow disorders.
Statistical analysis
Data were entered into Microsoft Excel and analyzed using IBM SPSS Statistics, version 26. equivalent validated statistical software. Continuous variables were assessed for distribution and expressed as mean ± standard deviation for normally distributed data or median with interquartile range for non-normally distributed data. Categorical variables were expressed as frequencies and percentages.
RESULTS:
A total of 110 patients with megaloblastic anemia fulfilling the predefined inclusion criteria were evaluated. The study population demonstrated considerable variation in clinical presentation, hematological abnormalities, peripheral blood morphology, bone marrow findings, and biochemical deficiency patterns. The overall findings indicated that megaloblastic anemia frequently involved more than one hematopoietic cell lineage, with morphological abnormalities extending beyond isolated macrocytic anemia.
The mean age of the study population was 37.6 ± 15.4 years, with patients ranging from 12 to 72 years of age. The largest proportion of patients belonged to the 21–40-year age group (41.8%), followed by the 41–60-year age group (30.9%). There was a slight male predominance, with 58 (52.7%) males and 52 (47.3%) females.
Pallor was the most frequent clinical finding, observed in 100 (90.9%) patients, followed by fatigue/generalized weakness in 88 (80.0%) and exertional dyspnea in 47 (42.7%). Glossitis was documented in 32 (29.1%), while icterus was observed in 27 (24.5%). Neurological manifestations, including paresthesia, numbness, gait disturbances, or impaired vibration sensation, were present in 24 (21.8%) patients. A predominantly vegetarian dietary pattern was reported in 62 (56.4%) patients.
Table 1. Demographic and clinical characteristics of patients with megaloblastic anemia (n = 110)
|
Characteristic |
Number (n) |
Percentage (%) |
|
Age group |
||
|
≤20 years |
16 |
14.5 |
|
21–40 years |
46 |
41.8 |
|
41–60 years |
34 |
30.9 |
|
>60 years |
14 |
12.7 |
|
Sex |
||
|
Male |
58 |
52.7 |
|
Female |
52 |
47.3 |
|
Clinical features* |
||
|
Pallor |
100 |
90.9 |
|
Fatigue/generalized weakness |
88 |
80.0 |
|
Exertional dyspnea |
47 |
42.7 |
|
Glossitis |
32 |
29.1 |
|
Icterus |
27 |
24.5 |
|
Neurological manifestations |
24 |
21.8 |
|
Splenomegaly |
17 |
15.5 |
|
Hepatomegaly |
13 |
11.8 |
|
Predominantly vegetarian diet |
62 |
56.4 |
The mean hemoglobin concentration was 7.6 ± 1.9 g/dL, indicating substantial anemia in the study population. The mean red blood cell count was 2.42 ± 0.61 ×10⁶/µL, while the mean hematocrit was 23.6 ± 5.8%. Macrocytosis was reflected by an elevated mean corpuscular volume of 108.7 ± 13.6 fL. The mean red cell distribution width was also increased at 20.4 ± 4.2%, indicating significant heterogeneity in erythrocyte size.
The mean total leukocyte count was 4.15 ± 1.65 ×10³/µL, while the mean platelet count was 126.4 ± 67.2 ×10³/µL. These findings demonstrated frequent involvement of the leukocytic and megakaryocytic lineages in addition to erythroid abnormalities.
Table 2. Hematological parameters among patients with megaloblastic anemia
|
Parameter |
Mean ± SD |
Range |
|
Hemoglobin (g/dL) |
7.6 ± 1.9 |
3.4–11.6 |
|
RBC count (×10⁶/µL) |
2.42 ± 0.61 |
1.18–3.82 |
|
Hematocrit (%) |
23.6 ± 5.8 |
11.2–35.8 |
|
Mean corpuscular volume (fL) |
108.7 ± 13.6 |
78.4–139.2 |
|
Mean corpuscular hemoglobin (pg) |
34.7 ± 4.8 |
25.8–44.6 |
|
Mean corpuscular hemoglobin concentration (g/dL) |
31.8 ± 2.1 |
27.5–36.1 |
|
Red cell distribution width (%) |
20.4 ± 4.2 |
14.2–31.5 |
|
Total leukocyte count (×10³/µL) |
4.15 ± 1.65 |
1.5–9.2 |
|
Platelet count (×10³/µL) |
126.4 ± 67.2 |
28–308 |
|
Reticulocyte count (%)† |
1.2 ± 0.6 |
0.3–3.1 |
Severe anemia, defined as hemoglobin <7.0 g/dL, was identified in 47 (42.7%) patients, whereas 48 (43.6%) had moderate anemia and 15 (13.6%) had mild anemia.
With respect to hematopoietic lineage involvement, isolated anemia was present in 39 (35.5%) patients. Bicytopenia was observed in 42 (38.2%), making it the most common cytopenic pattern, whereas pancytopenia occurred in 29 (26.4%) patients. Thus, 71 of 110 patients (64.5%) demonstrated involvement of at least two peripheral blood cell lineages.
Table 3. Severity of anemia and pattern of peripheral blood cytopenia (n = 110)
|
Hematological category |
Number (n) |
Percentage (%) |
|
Severity of anemia |
||
|
Mild anemia (Hb ≥10.0 g/dL) |
15 |
13.6 |
|
Moderate anemia (Hb 7.0–9.9 g/dL) |
48 |
43.6 |
|
Severe anemia (Hb <7.0 g/dL) |
47 |
42.7 |
|
Pattern of cytopenia |
||
|
Isolated anemia |
39 |
35.5 |
|
Bicytopenia |
42 |
38.2 |
|
Pancytopenia |
29 |
26.4 |
Peripheral blood smear examination showed characteristic but heterogeneous morphological abnormalities. Macro-ovalocytes represented the most frequent morphological finding and were observed in 105 (95.5%) patients. Macrocytosis was identified in 102 (92.7%), while anisopoikilocytosis was observed in 100 (90.9%). Hypersegmented neutrophils, one of the major morphological indicators of megaloblastic hematopoiesis, were identified in 97 (88.2%) patients.
Less frequent findings included polychromasia in 30 (27.3%), circulating nucleated red blood cells in 24 (21.8%), Howell-Jolly bodies in 11 (10.0%), basophilic stippling in 9 (8.2%), and erythrocyte fragmentation/schistocytes in 7 (6.4%). A dimorphic red-cell population was detected in 15 (13.6%) patients. Importantly, several patients with dimorphic morphology did not demonstrate marked macrocytosis on automated indices, suggesting possible coexisting iron deficiency or other microcytic influences.
Table 4. Peripheral blood morphological findings in patients with megaloblastic anemia (n = 110)
|
Peripheral smear finding |
Number (n) |
Percentage (%) |
|
Macro-ovalocytes |
105 |
95.5 |
|
Macrocytosis |
102 |
92.7 |
|
Anisopoikilocytosis |
100 |
90.9 |
|
Hypersegmented neutrophils |
97 |
88.2 |
|
Polychromasia |
30 |
27.3 |
|
Nucleated red blood cells |
24 |
21.8 |
|
Dimorphic red-cell population |
15 |
13.6 |
|
Howell-Jolly bodies |
11 |
10.0 |
|
Basophilic stippling |
9 |
8.2 |
|
Schistocytes/red-cell fragmentation |
7 |
6.4 |
Bone marrow aspiration was clinically indicated and available for 84 of the 110 patients (76.4%). All 84 marrow specimens demonstrated morphological evidence of megaloblastic erythropoiesis and nuclear-cytoplasmic asynchrony.
Erythroid hyperplasia was identified in 81 (96.4%) patients, while 79 (94.0%) showed hypercellular marrow. A reduced myeloid-to-erythroid ratio secondary to erythroid expansion was found in 68 (81.0%). Giant metamyelocytes were observed in 72 (85.7%) and giant band forms in 61 (72.6%), confirming that morphological abnormalities were not restricted to the erythroid lineage.
Nuclear budding or irregular nuclear forms among erythroid precursors occurred in 40 (47.6%), whereas binucleation/multinucleation was detected in 34 (40.5%). Megakaryocytic morphological abnormalities were observed in 24 (28.6%) cases.
Regarding the overall degree of megaloblastic change, 18 (21.4%) demonstrated mild changes, 36 (42.9%) moderate changes, and 30 (35.7%) marked megaloblastic changes.
Table 5. Bone marrow morphological spectrum among patients undergoing marrow examination (n = 84)
|
Bone marrow finding |
Number (n) |
Percentage (%) |
|
Megaloblastic erythropoiesis |
84 |
100.0 |
|
Nuclear-cytoplasmic asynchrony |
84 |
100.0 |
|
Erythroid hyperplasia |
81 |
96.4 |
|
Hypercellular marrow |
79 |
94.0 |
|
Giant metamyelocytes |
72 |
85.7 |
|
Reduced myeloid-to-erythroid ratio |
68 |
81.0 |
|
Giant band forms |
61 |
72.6 |
|
Nuclear budding/irregularity |
40 |
47.6 |
|
Binucleation/multinucleation |
34 |
40.5 |
|
Megakaryocytic abnormalities |
24 |
28.6 |
|
Severity of megaloblastic change |
|
|
|
Mild |
18 |
21.4 |
|
Moderate |
36 |
42.9 |
|
Marked |
30 |
35.7 |
Biochemical evaluation demonstrated isolated vitamin B12 deficiency in 69 (62.7%) patients, making it the predominant deficiency pattern. Isolated folate deficiency was identified in 13 (11.8%), whereas combined vitamin B12 and folate deficiency was present in 24 (21.8%). Four patients (3.6%) exhibited convincing morphological evidence of megaloblastic hematopoiesis but did not demonstrate a definitive isolated vitamin deficiency according to the laboratory reference cut-offs.
Thus, vitamin B12 deficiency, either occurring alone or in combination with folate deficiency, was documented in 93 of 110 patients (84.5%).
Table 6. Biochemical deficiency pattern and relationship between marrow severity and cytopenia
A. Biochemical deficiency pattern (n = 110)
|
Biochemical category |
Number (n) |
Percentage (%) |
|
Isolated vitamin B12 deficiency |
69 |
62.7 |
|
Isolated folate deficiency |
13 |
11.8 |
|
Combined vitamin B12 and folate deficiency |
24 |
21.8 |
|
No definitive biochemical categorization |
4 |
3.6 |
B. Association between severity of marrow megaloblastic change and cytopenia pattern (n = 84)
|
Marrow severity |
Isolated anemia n (%) |
Bicytopenia n (%) |
Pancytopenia n (%) |
Total |
|
Mild |
10 (55.6) |
6 (33.3) |
2 (11.1) |
18 |
|
Moderate |
10 (27.8) |
17 (47.2) |
9 (25.0) |
36 |
|
Marked |
3 (10.0) |
10 (33.3) |
17 (56.7) |
30 |
|
Total |
23 |
33 |
28 |
84 |
χ² = 17.86; P = 0.001.
A significant association was observed between the severity of marrow megaloblastic change and the extent of peripheral blood cytopenia (P = 0.001). Pancytopenia occurred in only 11.1% of patients with mild marrow changes but increased to 56.7% among those with marked megaloblastic morphology. Conversely, isolated anemia decreased from 55.6% in the mild group to 10.0% in patients demonstrating marked marrow changes. These findings suggest a progressive involvement of multiple hematopoietic lineages with increasing morphological severity.
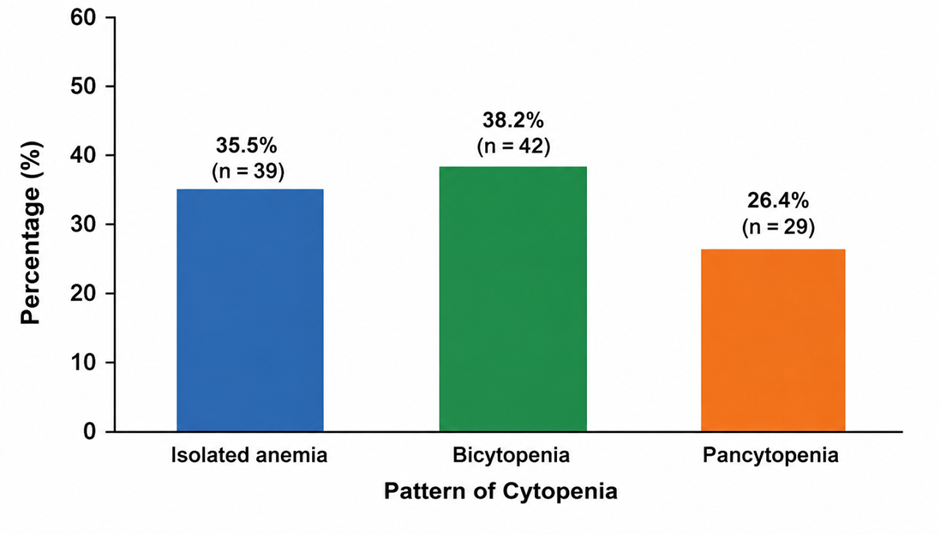
Figure 1. Distribution of hematological cytopenia patterns in patients with megaloblastic anemia
Figure 1 showing bicytopenia as the most frequent hematological pattern (38.2%), followed by isolated anemia (35.5%) and pancytopenia (26.4%).
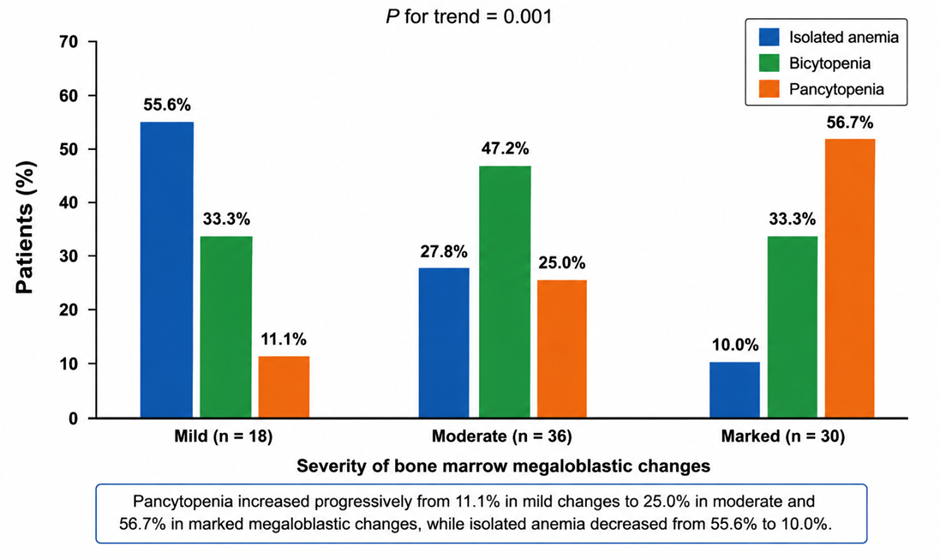
Figure 2. Relationship between severity of bone marrow megaloblastic changes and pattern of cytopenia
Figure 2 demonstrating a progressive increase in pancytopenia with increasing severity of megaloblastic change, with pancytopenia occurring in 11.1%, 25.0%, and 56.7% of patients with mild, moderate, and marked marrow abnormalities, respectively (P = 0.001).
DISCUSSION:
Megaloblastic anemia represents a morphologically distinctive but clinically heterogeneous disorder of ineffective hematopoiesis, most often resulting from vitamin B12 or folate deficiency. The present study evaluated the clinical, hematological, peripheral blood, bone marrow, and biochemical spectrum of megaloblastic anemia in 110 patients. The major observations were the predominance of disease among young and middle-aged adults, frequent severe anemia, involvement of multiple hematopoietic lineages, a characteristic peripheral smear pattern dominated by macro-ovalocytosis and hypersegmented neutrophils, prominent megaloblastic alterations in the bone marrow, and vitamin B12 deficiency as the principal biochemical abnormality. Importantly, increasing severity of bone marrow megaloblastosis was associated with progressively greater multilineage cytopenia, emphasizing that megaloblastic anemia should be regarded as a disorder of ineffective hematopoiesis rather than simply a macrocytic red-cell abnormality.
The mean age of patients in the present study was 37.6 ± 15.4 years, with the largest proportion (41.8%) belonging to the 21–40-year age group. A slight male predominance was observed. This relatively young age distribution resembles observations from India. Sarode et al. studied 139 patients with nutritional megaloblastic anemia in north-west India and reported that 61% belonged to the second and third decades of life [12]. In contrast, studies from regions where pernicious anemia and malabsorptive disorders constitute more important etiologies have reported presentation at a relatively higher age. This difference underscores the influence of dietary habits, socioeconomic conditions, underlying gastrointestinal disorders, and population characteristics on the epidemiology of megaloblastic anemia.
Pallor was the most frequent clinical finding in the present series, occurring in 90.9% of patients, followed by fatigue or generalized weakness in 80.0% and exertional dyspnea in 42.7%. Glossitis and mild icterus were present in 29.1% and 24.5%, respectively. These findings are clinically compatible with the combination of anemia, ineffective erythropoiesis, and intramedullary destruction that characterizes established megaloblastic disease. Neurological manifestations were identified in 21.8% of the present patients. The neurological manifestations of vitamin B12 deficiency are particularly important because they may occur independently of the severity of anemia. In a prospective evaluation of cobalamin deficiency, Stabler et al. demonstrated that neuropsychiatric abnormalities may occur even when classical hematological abnormalities such as anemia or macrocytosis are absent [19]. Thus, the absence of severe anemia should not exclude clinically important vitamin B12 deficiency.
A predominantly vegetarian dietary pattern was reported in 56.4% of the study population. This observation may have particular relevance in populations where consumption of animal-derived foods is limited. Sarode et al. similarly noted that many patients with nutritional megaloblastic anemia in north-west India were strict vegetarians [12]. Since naturally occurring vitamin B12 is derived predominantly from animal-source foods, prolonged dietary restriction may contribute substantially to cobalamin deficiency, although malabsorption, pernicious anemia, medication use, and gastrointestinal disorders should also be considered when establishing etiology.
The hematological profile demonstrated substantial anemia, with a mean hemoglobin concentration of 7.6 ± 1.9 g/dL. Severe anemia was present in 42.7% of patients, while a further 43.6% had moderate anemia. The mean MCV was elevated at 108.7 ± 13.6 fL, and the mean RDW of 20.4 ± 4.2% reflected considerable variation in erythrocyte size. Although macrocytosis is classically associated with megaloblastic anemia, it should not be regarded as an obligatory diagnostic feature. Bhatia et al., in an Indian series of 117 patients with low vitamin B12 concentrations, found that only 26 had an elevated MCV, whereas 50 had values within the reference range and 28 had low MCV values [13]. Concomitant iron deficiency was detected in a subset of their patients and represented an important explanation for the absence of classical macrocytosis. These observations are relevant to the 13.6% of patients in the present study who demonstrated a dimorphic red-cell population and emphasize that mixed nutritional deficiency may obscure the expected automated red-cell indices.
The involvement of multiple hematopoietic cell lines was an important finding. Isolated anemia was present in 35.5% of patients, while 38.2% had bicytopenia and 26.4% had pancytopenia. Overall, 64.5% therefore demonstrated involvement of at least two peripheral blood cell lineages. Such multilineage involvement reflects ineffective DNA synthesis across rapidly proliferating hematopoietic precursors. Sarode et al. reported thrombocytopenia in 80.5% of patients with nutritional megaloblastic anemia and concurrent neutropenia and thrombocytopenia in 43.8% [12]. They proposed that progression of megaloblastosis may initially produce anemia, followed by thrombocytopenia and subsequently neutropenia. The lower frequency of pancytopenia in the present cohort compared with some earlier hospital-based series may reflect differences in disease severity at diagnosis, referral patterns, nutritional background, or thresholds used to define cytopenia.
Peripheral blood morphology was highly informative. Macro-ovalocytes were present in 95.5% of patients, macrocytosis in 92.7%, anisopoikilocytosis in 90.9%, and hypersegmented neutrophils in 88.2%. These findings constitute the classical morphological signature of megaloblastic hematopoiesis and reinforce the continuing value of careful peripheral smear examination despite widespread availability of automated hematology analyzers. Thompson et al. demonstrated that neutrophil hypersegmentation had a sensitivity of 91% for detecting vitamin B12 deficiency, compared with 62% for an elevated MCV and 54% for increased RDW [14]. Consequently, the peripheral smear may reveal diagnostically important megaloblastic changes even when automated indices are equivocal.
The presence of macro-ovalocytes and hypersegmented neutrophils is also valuable in distinguishing megaloblastic anemia from other disorders presenting with macrocytosis or pancytopenia. Gupta et al. emphasized that megaloblastic anemia and aplastic anemia are both important causes of pancytopenia and that distinction based solely on macrocytosis may be problematic when characteristic macro-ovalocytes and hypersegmented neutrophils are absent [15]. Integration of automated blood counts with smear morphology, biochemical vitamin assessment, and, when required, bone marrow findings therefore provides a more reliable diagnostic approach than any isolated hematological index.
Less frequent peripheral smear abnormalities in the present study included circulating nucleated erythrocytes, Howell-Jolly bodies, basophilic stippling, polychromasia, and red-cell fragmentation. Schistocytes or fragmented erythrocytes were observed in 6.4% of patients. Although uncommon, this finding is clinically important because profound vitamin B12 deficiency may occasionally produce pseudo-thrombotic microangiopathy characterized by anemia, thrombocytopenia, biochemical evidence of hemolysis, and erythrocyte fragmentation. A recent systematic review by Ganipisetti et al. highlighted that severe cobalamin deficiency can mimic thrombotic thrombocytopenic purpura and may lead to inappropriate plasma-exchange therapy if the underlying vitamin deficiency is overlooked [20]. Recognition of macro-ovalocytes, hypersegmented neutrophils, ineffective reticulocyte response, severe cobalamin deficiency, and markedly increased markers of intramedullary hemolysis may help distinguish these entities.
Bone marrow examination was available in 84 patients and demonstrated a striking spectrum of megaloblastic changes. Megaloblastic erythropoiesis and nuclear-cytoplasmic asynchrony were identified in all examined specimens, while erythroid hyperplasia was present in 96.4% and marrow hypercellularity in 94.0%. Giant metamyelocytes occurred in 85.7%, and giant band forms were present in 72.6%. These observations reflect the fundamental defect in DNA synthesis, in which nuclear maturation and cellular division are delayed while cytoplasmic maturation continues. Consequently, abnormalities are not restricted to erythroid precursors but involve granulocytic and, in severe cases, megakaryocytic lineages. The accepted diagnostic morphology of megaloblastic anemia includes erythroid megaloblastosis, nuclear-cytoplasmic maturation asynchrony, abnormal granulocytic precursors, and ineffective marrow hematopoiesis [16].
A particularly relevant observation was the significant association between marrow morphological severity and the extent of peripheral cytopenia. Pancytopenia increased from 11.1% among patients with mild marrow changes to 25.0% in those with moderate changes and 56.7% among patients with marked megaloblastosis, whereas isolated anemia progressively decreased. This association was statistically significant (P = 0.001). The finding is biologically plausible because increasing disruption of DNA synthesis results in progressively greater ineffective production and intramedullary destruction across multiple hematopoietic lineages. It also supports the earlier clinical observation that thrombocytopenia and neutropenia become more prominent as megaloblastic disease becomes more advanced [12]. Thus, the presence of pancytopenia in megaloblastic anemia may be interpreted as a marker of more extensive hematopoietic dysfunction rather than evidence of an irreversible marrow-failure syndrome.
Biochemical analysis further demonstrated that vitamin B12 deficiency was the predominant underlying abnormality. Isolated vitamin B12 deficiency occurred in 62.7%, while another 21.8% had combined vitamin B12 and folate deficiency. Therefore, 84.5% of patients had evidence of vitamin B12 deficiency either alone or in combination with folate deficiency. Only 11.8% had isolated folate deficiency. A similar predominance of cobalamin deficiency has been reported in several geographical settings. Sarode et al. found vitamin B12 deficiency in 76% of evaluable patients, isolated folate deficiency in 6.8%, and combined deficiency in 8.8% [12]. Savage et al., in a study of 144 patients with megaloblastic hematopoiesis in Zimbabwe, reported vitamin B12 deficiency in 86.1% and isolated folate deficiency in only 5.5% [17]. Similarly, Maktouf et al. prospectively evaluated 478 patients with megaloblastic anemia in Tunisia and identified vitamin B12 deficiency in 98% [18]. Collectively, these observations support the dominant role of cobalamin deficiency in clinically established megaloblastic anemia, although the specific cause of deficiency differs substantially among populations.
Four patients in the present study demonstrated convincing morphological megaloblastic changes without definitive biochemical categorization. This finding illustrates an important diagnostic limitation of relying exclusively on serum vitamin concentrations. Serum vitamin B12 measurements do not invariably correspond to functional intracellular cobalamin status, while previous supplementation or other biological factors may alter circulating concentrations. Stabler et al. showed that methylmalonic acid and homocysteine measurements can provide important additional evidence in suspected cobalamin deficiency, particularly in patients with atypical hematological findings [19]. Where diagnostic uncertainty persists, functional biomarkers together with clinical findings, peripheral smear morphology, and response to replacement therapy can strengthen diagnostic classification.
The present findings have several practical implications. First, peripheral blood smear examination remains indispensable in suspected megaloblastic anemia. An elevated MCV alone is insufficient because concomitant iron deficiency or another microcytic disorder may mask macrocytosis [13]. Second, hypersegmented neutrophils and macro-ovalocytes provide important morphological evidence of impaired DNA synthesis and may direct timely vitamin assessment [14]. Third, pancytopenia should not immediately lead to a diagnosis of primary marrow failure or hematological malignancy because severe megaloblastic anemia is an important and potentially reversible cause of multilineage cytopenia [12,15]. Finally, bone marrow examination is particularly valuable when peripheral findings are atypical, cytopenias are profound, or competing diagnoses such as myelodysplastic syndrome, aplastic anemia, or hematological malignancy require exclusion.
Several limitations should be considered while interpreting the findings. The hospital-based cross-sectional design may preferentially include symptomatic or more severely affected patients and therefore may not reflect the full community spectrum of vitamin deficiency. Bone marrow examination was available in 84 of 110 patients and was undertaken according to clinical indication, which introduces the possibility of selection toward patients with more pronounced hematological abnormalities. Uniform iron studies, methylmalonic acid, homocysteine, anti-intrinsic-factor antibodies, and other investigations for the precise etiology of cobalamin deficiency were not available for every patient. Furthermore, the cross-sectional nature of the study did not permit evaluation of morphological recovery following vitamin replacement. Future prospective studies incorporating nutritional assessment, functional vitamin biomarkers, comprehensive etiological work-up, and serial hematological evaluation would provide a more complete understanding of the relationship between deficiency severity and morphological expression.
In summary, the present study demonstrates that megaloblastic anemia encompasses a broad morphological and hematological spectrum ranging from isolated anemia to severe multilineage cytopenia. Macro-ovalocytes, anisopoikilocytosis, macrocytosis, and hypersegmented neutrophils represented the dominant peripheral blood abnormalities, while bone marrow examination showed erythroid hyperplasia, nuclear-cytoplasmic asynchrony, megaloblastic erythropoiesis, and characteristic granulocytic abnormalities. The significant relationship between increasing marrow megaloblastic severity and pancytopenia further demonstrates the progressive impact of defective DNA synthesis on multiple hematopoietic lineages. Vitamin B12 deficiency emerged as the predominant biochemical abnormality. Collectively, these findings reinforce the diagnostic value of integrating peripheral smear morphology, complete blood counts, biochemical testing, and selective bone marrow evaluation for accurate recognition of megaloblastic anemia and its atypical presentations..
CONCLUSION:
Megaloblastic anemia demonstrates a broad morphological and hematological spectrum extending beyond isolated macrocytic anemia. In the present study, macro-ovalocytosis, macrocytosis, anisopoikilocytosis, and hypersegmented neutrophils were the predominant peripheral blood findings, while bone marrow examination commonly revealed megaloblastic erythropoiesis, nuclear-cytoplasmic asynchrony, erythroid hyperplasia, and giant granulocytic precursors. Multilineage involvement was frequent, with bicytopenia and pancytopenia accounting for a substantial proportion of cases. Vitamin B12 deficiency emerged as the predominant biochemical abnormality, either alone or in combination with folate deficiency. A significant association was observed between increasing severity of bone marrow megaloblastic changes and the extent of peripheral cytopenia, with pancytopenia becoming progressively more frequent in patients with marked marrow abnormalities. These findings emphasize that severe megaloblastic anemia can closely mimic primary marrow failure and other hematological disorders.
REFERENCES:
1. Wickramasinghe SN. The wide spectrum and unresolved issues of megaloblastic anemia. Semin Hematol. 1999;36(1):3-18.
2. Wickramasinghe SN. Morphology, biology and biochemistry of cobalamin- and folate-deficient bone marrow cells. Baillieres Clin Haematol. 1995;8(3):441-59. doi:10.1016/S0950-3536(05)80215-X.
3. Nagao T, Hirokawa M. Diagnosis and treatment of macrocytic anemias in adults. J Gen Fam Med. 2017;18(5):200-204. doi:10.1002/jgf2.31.
4. Chanarin I. Megaloblastic anaemia, cobalamin, and folate. J Clin Pathol. 1987;40(9):978-84. doi:10.1136/jcp.40.9.978.
5. Stabler SP. Clinical practice. Vitamin B12 deficiency. N Engl J Med. 2013;368(2):149-60. doi:10.1056/NEJMcp1113996.
6. Andrès E, Affenberger S, Zimmer J, Vinzio S, Grosu D, Pistol G, et al. Current hematological findings in cobalamin deficiency: a study of 201 consecutive patients with documented cobalamin deficiency. Clin Lab Haematol. 2006;28(1):50-6. doi:10.1111/j.1365-2257.2006.00755.x.
7. Lefèvre C, Bondu S, Le Goff S, Kosmider O, Fontenay M. Dyserythropoiesis of myelodysplastic syndromes. Curr Opin Hematol. 2017;24(3):191-197. doi:10.1097/MOH.0000000000000325.
8. Fahmawi Y, Campos Y, Khushman M, Alkharabsheh O, Manne A, Zubair H, et al. Vitamin B12 deficiency presenting as pseudo-thrombotic microangiopathy: a case report and literature review. Clin Pharmacol. 2019;11:127-131. doi:10.2147/CPAA.S207258.
9. Khanduri U, Sharma A. Megaloblastic anaemia: prevalence and causative factors. Natl Med J India. 2007;20(4):172-5.
10. Zittoun J, Zittoun R. Modern clinical testing strategies in cobalamin and folate deficiency. Semin Hematol. 1999;36(1):35-46.
11. Beck WS. Diagnosis of megaloblastic anemia. Annu Rev Med. 1991;42:311-22. doi:10.1146/annurev.me.42.020191.001523.
12. Sarode R, Garewal G, Marwaha N, Marwaha RK, Varma S, Ghosh K, et al. Pancytopenia in nutritional megaloblastic anaemia. A study from north-west India. Trop Geogr Med. 1989;41(4):331-336.
13. Bhatia P, Kulkarni JD, Pai SA. Vitamin B12 deficiency in India: mean corpuscular volume is an unreliable screening parameter. Natl Med J India. 2012;25(6):336-338.
14. Thompson WG, Cassino C, Babitz L, Meola T, Berman R, Lipkin M Jr, et al. Hypersegmented neutrophils and vitamin B12 deficiency. Hypersegmentation in B12 deficiency. Acta Haematol. 1989;81(4):186-191. doi:10.1159/000205559.
15. Gupta PK, Saxena R, Karan AS, Choudhry VP. Red cell indices for distinguishing macrocytosis of aplastic anaemia and megaloblastic anaemia. Indian J Pathol Microbiol. 2003;46(3):375-377.
16. Wickramasinghe SN. Diagnosis of megaloblastic anaemias. Blood Rev. 2006;20(6):299-318. doi:10.1016/j.blre.2006.02.002.
17. Savage D, Gangaidzo I, Lindenbaum J, Kiire C, Mukiibi JM, Moyo A, et al. Vitamin B12 deficiency is the primary cause of megaloblastic anaemia in Zimbabwe. Br J Haematol. 1994;86(4):844-850. doi:10.1111/j.1365-2141.1994.tb04840.x.
18. Maktouf C, Bchir A, Louzir H, Mdhaffer M, Elloumi M, Ben Abid H, et al. Megaloblastic anemia in North Africa. Haematologica. 2006;91(7):990-991.
19. Stabler SP, Allen RH, Savage DG, Lindenbaum J. Clinical spectrum and diagnosis of cobalamin deficiency. Blood. 1990;76(5):871-881.
20. Ganipisetti VM, Maringanti BS, Lingas EC, Naha K. Adult vitamin B12 deficiency-associated pseudo-thrombotic microangiopathy: a systematic review of case reports. Cureus. 2024;16(3). doi:10.7759/cureus.55784.