Diagnostic Implications of Platelet Indices in Thrombocytopenia
- Lekha M.B ,
- Neetha R , Assistant professor, Department of Pathology, Dr. B.R. Ambedkar Medical College, Bangalore, Karnataka, India.
- Sujatha R , Professor &HOD, Department of Pathology, Dr. B.R. Ambedkar Medical College, Bangalore, Karnataka, India.
- Shambhavi Sona , Postgraduate, Department of Pathology, Dr. B.R. Ambedkar Medical College, Bangalore, Karnataka, India.
Article Information:
Abstract:
Background: Thrombocytopenia is defined as platelet count below 150,000/cumm after excluding pre-analytical and post-analytical errors, which can be due to hypoproliferation or hyperdestruction of platelets. Thrombocytopenia is most commonly seen in our day to day practice. This study helps to analyze the role of platelet indices which include mean platelet volume (MPV), platelet distribution width (PDW), plateletcrit (PCT) and platelet large cell ratio (P-LCR) as a safe, quick and cost-effective method for prognostic implication and differential diagnosis of thrombocytopenia. Methodology: This study is a retrospective observational descriptive study of 300 cases conducted in Dr. B. R. Ambedkar medical college and hospital, Bangalore from November 2024 to October 2025. After obtaining institutional ethical clearance, data on complete blood count of individuals including platelet counts, platelet indices, clinical data, lab investigations, and other relevant details were retrieved from the laboratory database and medical records department of our institution. Results: Out of 300 cases of thrombocytopenia, 208 (69.3%) were classified as hyperdestructive and 92 (30.7%) as hypoproductive thrombocytopenia. The hyperdestructive group showed a mean platelet count of 85.32 ± 38.8 × 10⁹/L, with mean platelet indices of MPV 13.41 ± 0.85 fL, PDW 17.53 ± 1.42 fL, PCT 0.12 ± 0.05%, and P-LCR 37.88 ± 4.7%. The hypoproductive group demonstrated a mean platelet count of 83.94 ± 41.27 × 10⁹/L, with MPV 5.94 ± 0.56 fL, PDW 12.48 ± 1.48 fL, PCT 0.05 ± 0.02%, and P-LCR 17.56 ± 4.27%. Among hypoproductive cases, megaloblastic anemia (n = 57) showed a mean platelet count of 89.0 ± 38.89 ×10⁹/L, MPV 6.0 ± 0.56 fL, PDW 12.4 ± 1.58 fL, PCT 0.05 ± 0.02%, and P-LCR 18.04 ± 4.11%, while non-megaloblastic hypoproductive cases (n = 35) demonstrated comparatively lower MPV and PDW values. Platelet count alone did not differ significantly between the two major groups (p = 0.0786). However, MPV, PDW, P-LCR, and PCT were significantly higher in hyperdestructive thrombocytopenia (p < 0.001). PDW was significantly higher in megaloblastic anemia compared to non-megaloblastic hypoproductive thrombocytopenia, indicating its utility in differentiating these subtypes. Statistically significant correlations were observed for all platelet indices analyzed. Conclusion: Platelet indices which are easily obtained and are reliable parameters which can be used as screening tests for differentiating hypoproductive from hyperdestructive thrombocytopenia. These platelet parameters give a clue in diagnosing and help in initial management, preventing undesirable transfusions of platelets among hyperdestructive thrombocytopenia patients and can avoid painful, invasive investigations.
Keywords:
Article :
Introduction:
Thrombocytopenia is defined as platelet count below 150,000/cumm after excluding pre-analytical and post-analytical errors, which may be due to hypoproliferation or hyperdestruction of platelets. This study helps to analyze the role of platelet indices which include mean platelet volume (MPV), platelet distribution width (PDW), plateletcrit (PCT) and platelet large cell ratio (P-LCR) as a safe, quick and cost- effective method for prognostic implication and differential diagnosis of thrombocytopenia.
Accelerated destruction of platelets may be due to immunologic and non-immunologic etiology. Immunologic causes include autoimmune, idiopathic, secondary infections, pregnancy, and collagen vascular disorders. Non-immunologic processes include thrombotic microangiopathies, disseminated intravascular coagulation (DIC), thrombotic thrombocytopenic purpura, and hemolytic-uremic syndrome. A low platelet production may be caused by hypoplasia of megakaryocytes, ineffective thrombopoiesis, or hereditary conditions such as megaloblastic anemia, aplastic anemia, myelofibrosis, myelodysplastic syndrome, metastasis, leukemia, lymphoma, multiple myeloma, alcoholic liver disease, and infections. [1]
The circulatory lifespan of a platelet is approximately 10 days in humans with normal platelet counts, but somewhat shorter in patients with moderate (7 days) to severe (5 days) thrombocytopenia. [2] An abnormally low platelet count should always hint to check a peripheral smear examination to rule out pseudothrombocytopenia. [3] Examination of the blood film can also reveal the presence of giant platelets, as in some inherited thrombocytopenias; giant platelets and Döhle bodies in leukocytes, as in May-Hegglin and other MYH9 platelet syndromes; moderately enlarged platelets, as in immune thrombocytopenia or other conditions associated with shortened platelet survival; small platelets, as in Wiskott-Aldrich syndrome; schistocytes and burr cells, as in the hemolytic uremic syndrome and thrombotic thrombocytopenic purpura, and occasionally in DIC; rouleaux formation, as in monoclonal gammopathies; macrocytosis and/or hypersegmentation, as in Vitamin B12 or folic acid deficiency; and abnormal white blood cells, as in leukemias and myeloproliferative disorders.[4] With advances in laboratory medicine zooming at high speed platelet parameters by current automated analyzers are superior and excludes observer bias.[5] Hence our study aims to analyse various platelet indices and their implication in determining the etiology of thrombocytopenias.
Materials and Methods:
Study Design
This study was conducted as a retrospective observational descriptive study aimed at evaluating the diagnostic significance of various platelet indices in patients presenting with thrombocytopenia.
Source of Data
All data were obtained from the hematology laboratory, Dr. B. R. Ambedkar Central Laboratory LIS and record books maintained for slide review, associated with Dr. B. R. Ambedkar Medical College and Hospital, Bangalore.
Study Period One year.
Place of Study
The study was carried out at Dr. B. R. Ambedkar Medical College and Hospital, Bangalore, in collaboration with the central hematology laboratory.
Sample Size
A total of 300 cases meeting the inclusion criteria were included in the study.
Data Collection Procedure
● Laboratory records of all CBC reports meeting the inclusion criteria were retrieved from the hematology laboratory database.
● Platelet indices including Mean Platelet Volume (MPV), Platelet Distribution Width (PDW), Platelet-Large Cell Ratio (P-LCR), and Plateletcrit (PCT) were recorded.
● Clinical details, provisional diagnosis, and relevant history were collected from hospital records.
● All data were anonymized and coded before analysis to ensure confidentiality.
Inclusion Criteria
All cases of thrombocytopenia diagnosed in the hematology laboratory.
Exclusion Criteria
1. Patients below the age of 18 years.
2. Cases of pseudothrombocytopenia patients
Ethical Considerations
Approval for retrospective data collection was obtained from the Institutional Ethics Committee. Patient identifiers were removed to maintain confidentiality in accordance with ethical guidelines.
Statistical Analysis
● Data were compiled and entered using Microsoft Word and Microsoft Excel.
● Tables, graphs, and charts were generated using MS Excel.
● The coded data were exported to the Statistical Package for the Social Sciences (SPSS) for statistical analysis.
● Descriptive statistics such as mean, standard deviation, frequencies, and percentages were calculated.
● Comparative analysis was performed to correlate platelet indices with etiological categories of thrombocytopenia.
● A p-value < 0.05 was considered statistically significant.
Results:
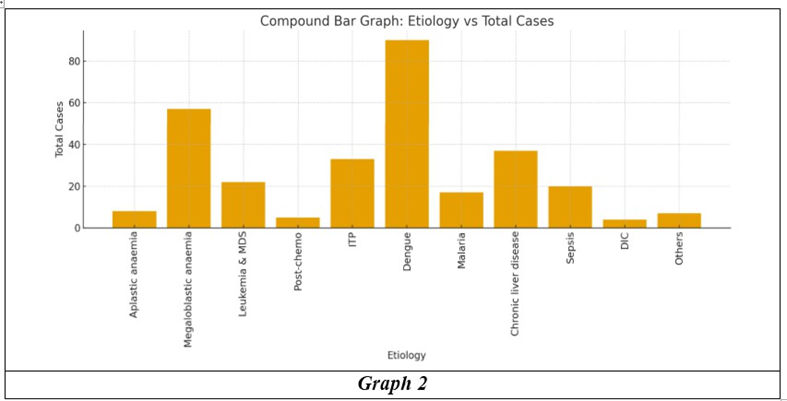
Of the 300 patients included in the study, 170 were males and 130 were females, giving a male -to-female ratio of 1.3:1. The major age group was 30-50 years. A majority of the cases (n = 208) were classified as hyperdestructive thrombocytopenia, whereas 92 cases fell into the hypoproductive category (Table 1).
|
Etiology |
Total cases |
% of cases |
|
|
Hypoproductive |
Aplastic anaemia |
8 |
2.67% |
|
Megaloblastic anaemia |
57 |
19% |
|
|
Leukemia & MDS |
22 |
7.3% |
|
|
Others (Post chemo) |
5 |
1.67% |
|
|
Hyperdestructive |
ITP |
33 |
11% |
|
Dengue |
90 |
30% |
|
|
Malaria |
17 |
5.67% |
|
|
Chronic liver disease |
37 |
12.33% |
|
|
Sepsis |
20 |
6.67% |
|
|
DIC |
4 |
1.33% |
|
|
Others (post viral- HIV, EBV) |
7 |
2.33% |
|
|
Total |
300 |
100 |
|
|
Table 1: Etiological Distribution of Thrombocytopenia Among Study Cases |
|||
In the present study comprising 300 cases, mild thrombocytopenia constituted the largest group 147 cases (49 %), whereas moderate and severe thrombocytopenia accounted for 75 cases (25 %) and 78 cases (26 %), respectively (Table 2). Most patients demonstrated platelet counts within the 75,001–100,000/µL interval, with the 50,001–75,000/µL range forming the next most common category. Hyperdestructive thrombocytopenia accounted for 69.3% of all cases (95% CI: 63.6%–74.6%), while hypoproductive thrombocytopenia comprised 30.7% (95%
CI: 25.4%–36.4%).
|
Severity of Thrombocytopenia |
No. of Cases (% of cases) |
|
Mild |
147 (49%) |
|
Moderate |
75 (25%) |
|
Severe |
78 (26%) |
|
Table 2: Distribution of Cases based on Severity of Thrombocytopenia |
|
|
Platelet indices |
Hypoproductive |
Hyperdestructive |
p Value |
|
Platelet count {mean ±SD < x 109 / L} |
83.94 ± 41.27 |
85.32 ± 38.8 |
0.07860053 |
|
MPV{mean ± SD (fL)} |
5.94 ± 0.56 |
13.41 ± 0.85 |
0.00** |
|
PDW {mean ± SD (fL)} |
12.48 ± 1.48 |
17.53 ± 1.42 |
0.00** |
|
PCT {mean ± SD (%)} |
0.05 ± 0.02 |
0.12 ± 0.05 |
0.00** |
|
P-LCR {mean ± SD (%)} |
17.56 ± 4.27 |
37.88 ± 4.7 |
0.00** |
|
Table 3: Mean Values of Different Platelet Indices and P Value in Hypoproductive & Hyperdestructive Thrombocytopenia |
|||
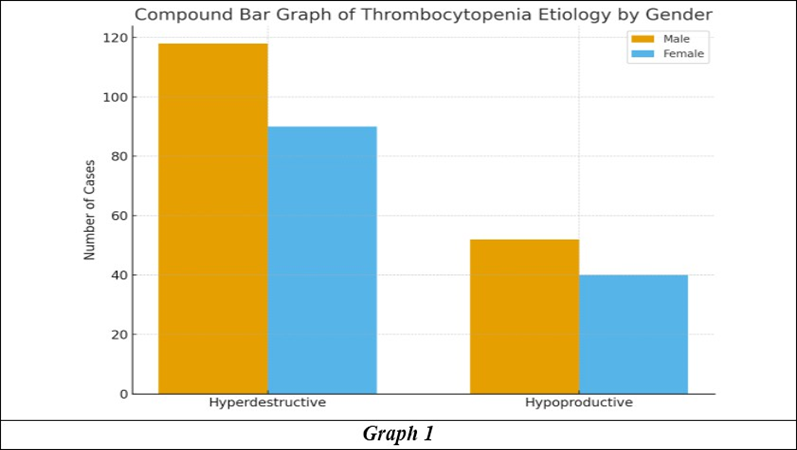
Within the hyperdestructive group, 118 patients were male and 90 were female. Dengue fever was the predominant clinical diagnosis, followed by chronic liver disease, immune thrombocytopenia, sepsis, and malaria (Table 1).
Conversely, the hypoproductive group included 52 males and 40 females, with megaloblastic anemia being the most frequent etiology, followed by leukemia/MDS, aplastic anemia, and post-chemotherapy marrow suppression.
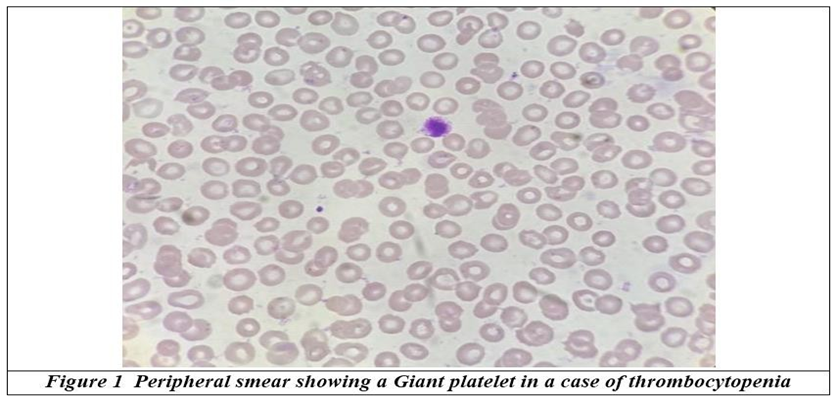
A considerable proportion of hyperdestructive cases exhibited elevated MPV values, with a mean MPV of 13.41 ± 0.85 fL, which corresponded with the presence of large and giant platelets on peripheral smears. In comparison, hypoproductive thrombocytopenia demonstrated significantly lower MPV values, with a mean of 5.94 ± 0.56 fL.
In total, 218 of 300 patients had MPV values above the normal upper limit, while 82 patients showed MPV values in the normal or low range.
|
Clinical diagnosis |
No of cases |
Mean Platelet count {mean ±SD < x 109 / L} |
Mean MPV + SD {mean ± SD (fL)} |
PDW {mean ± SD (fL)} |
P-LCR {mean ± SD (%)} |
Pct {mean ± SD (%)} |
|
Aplastic anaemia |
8 |
102.67 ± 21.11 |
5.65 ± 0.7 |
11.83 ± 0.93 |
15.26 ± 2.24 |
0.06 ± 0.01 |
|
Megaloblastic anaemia |
57 |
89 ± 38.89 |
6 ± 0.56 |
12.4 ± 1.58 |
18.04 ± 4.11 |
0.05 ± 0.02 |
|
Leukemia & MDS |
22 |
65.29 ± 42.99 |
5.93 ± 0.58 |
13.08 ± 1.31 |
16.62 ± 4.58 |
0.04 ± 0.03 |
|
Others (Post chemo) |
5 |
73 ± 49.3 |
5.96 ± 0.5 |
12.16 ± 0.37 |
19.55 ± 5.52 |
0.04 ± 0.03 |
|
ITP |
33 |
99.36 ± 39.01 |
13.49 ± 3.5 |
17.94 ± 2.71 |
37.68 ± 0.05 |
0.13 ± 0.04 |
|
Dengue |
90 |
85.27 ± 37.36 |
13.35 ± 0.73 |
17.15 ± 1.4 |
38.66 ± 4.76 |
0.11 ± 0.05 |
|
Malaria |
17 |
104.83 ± 37.89 |
13.67 ± 0.74 |
17.21 ± 1.41 |
36.46 ± 0.05 |
0.14 ± 0.04 |
|
Chronic liver disease |
37 |
98.81 ± 39.32 |
13.51 ± 3.51 |
17.83 ± 2.71 |
37.67 ± 0.05 |
0.13 ± 0.04 |
|
Sepsis |
20 |
95.19 ± 39.23 |
13.59 ± 3.51 |
17.78 ± 2.7 |
37.68 ± 0.05 |
0.13 ± 0.04 |
|
DIC |
4 |
91.13 ± 39.03 |
13.58 ± 3.51 |
17.82 ± 2.7 |
37.83 ± 0.05 |
0.12 ± 0.04 |
|
Others (post viral- HIV, EBV) |
7 |
92.97 ± 39.1 |
13.54 ± 3.5 |
17.85 ± 2.7 |
38.08 ± 0.05 |
0.12 ± 0.04 |
|
Total |
300 |
92.45 ± 39.11 |
13.49 ± 3.5 |
17.8 ± 2.69 |
38.22 ± 0.05 |
0.12 ± 0.04 |
|
Table 4: Distribution of the study population according to clinical diagnosis along with their mean platelet counts and mean platelet volume ± standard deviation |
||||||
Other platelet indices showed a similar trend. The mean PDW was significantly higher in hyperdestructive thrombocytopenia (17.53 ± 1.42 fL) than in the hypoproductive group (12.48 ± 1.48 fL). The P-LCR was also substantially increased in the hyperdestructive group (37.88 ± 4.7%) compared with the hypoproductive group (17.56 ± 4.27%). Likewise, the mean PCT was slightly higher in hyperdestructive thrombocytopenia (0.12 ± 0.05) versus hypoproductive thrombocytopenia (0.05 ± 0.02) (Table 6).
While platelet count by itself did not significantly differentiate between the two groups (p = 0.0786), all platelet indices—including MPV, PDW, P-LCR, and PCT-showed highly significant differences between hyperdestructive and hypoproductive thrombocytopenia (p < 0.001**).
Discussion:
Thrombocytopenia is a common condition that we encounter in our day to day practice which has a varied spectrum of etiology. A review of the peripheral smear reports helped in excluding the pseudothrombocytopenia cases from the study. Bone marrow aspiration and biopsy are the gold standard in differentiating the types of thrombocytopenia.
In our study, we have attempted to classify thrombocytopenia into hypoproductive and hyperdestructive categories based on the variou s platelet indices available in the automated hematology analyzer Mindray BC-6200 present in our central laboratory. The various causes of hypoproductive thrombocytopenia we found in our study was aplastic anemia (8, 2.67%), megaloblastic anemia (57, 19%), leukemia/ MDS (22, 7.33%) and others (5, 1.67%) which included post chemotherapy cases. The causes of hyperdestructive included dengue (90, 30%),
chronic liver disease (37, 12.3%), ITP (33, 11%), malaria (17, 5.67%), sepsis (20, 6.67%), DIC (4, 1.33%) and others (7, 2.33%) including viral etiology and HIV. The platelet indices like Platelet count , Mean platelet volume (MPV), Platelet distribution width(PDW), Plateletcrit (PCT) and Platelet large cell ratio (P-LCR) were studied in all the 300 cases in correlation with the platelet histogram. (Table comparing the distribution of cases with two other studies)
In the present study thrombocytopenia was divided into 3 categories mild, moderate and severe based on the platelet counts, the percentage of these being 49%, 25% and 26% respectively.
The mean platelet count and SD for hypoproductive cases was 83.94 ± 41.27 x 10⁹ / L and 85.32 ± 38.8 x 10⁹ / L for hyperdestructive cases with a p value of 0.07 as both the groups showed varied categories of thrombocytopenia. The hyperdestructive cases of thrombocytopenia were more in our study similar to studies conducted by Shah et al.
The volume of platelets in the bloodstream is heterogeneous, and their structures and metabolic functions differ, average mean cell volume being 7.2-11.7fL [6]. Mean platelet volume The mean MPV of hypoproductive cases was 5.94 ± 0.56 fL (lower) and that of hyperdestructive cases was found to be 13.41 ± 0.85 fL (higher), it is statistically significant with a p value of 0.00****. The mean MPV of dengue cases in our study was 13.35 ± 0.73 fL and is in concordance with studies conducted by Reddy RS et al and Khanna R[7,8] The high MPV in platelet destruction is due to increased circulating new younger and larger platelets showing that bone marrow is active .[8,9,10]
In our study, the mean MPV of ten sepsis patients was 11.83 ± 2.34 fL. Van der Lelie et al. found 13 of 25 patients in sepsis with low mean platelet counts and high MPV which was not related to any particular microorganism.[10]
The PDW directly measures the variability in platelet size, changes with platelet activation and reflects the heterogeneity in platelet morphology[11]. Increased PDW is an indication of anisocytosis of platelets.[7] High PDW has been associated with hyper destructive thrombocytopenia because of the release of heterogeneous population of platelets which vary in their size (anisocytosis).[12,13]
Our study had similar finding as Farias MG et al, Sewakdas K P et al and various other studies with Mean PDW in hypoproductiv e and hyperdestructive groups being 12.48 ± 1.48 and 17.53 ± 1.42 respectively with a significant p value. Older automated analysers could not differentiate platelets from other similarly sized particles such as fragmented red or white blood cells, cell debris and imm une complexes.[14]
PCT represents volume percent of platelets. PCT value is not altered much by severity of thrombocytopenia of either hypo productive or hyperdestructive aetiology because in healthy subjects platelet mass is closely regulated to keep it constant in our study.[15]
The mean PCT in our study was 0.05 ± 0.02 in hypoproductive group and 0.12 ± 0.05 in hyperdestructive group with significant p value. A comparative table has been prepared to contrast the findings of the present study with those of Pujari et al. and Baig et al., enabling a clearer evaluation of platelet indices across studies. (Table 5)
|
Study |
Hypoproductive (n) |
Hyperdestructive (n) |
MPV (Hypo/Hyper) |
PDW (Hypo/Hyper) |
P-LCR (Hypo/Hyper) |
|
Present study |
92 |
208 |
5.94 ± 0.56 / 13.41 ± 0.85 |
12.48 ± 1.48 / 17.53 ± 1.42 |
17.56 ± 4.27 / 37.88 ± 4.70 |
|
Pujari et al. (2022) |
58 |
142 |
9.22 / 10.70 |
11.21 / 16.13 |
22.83 / 39.48 |
|
Baig et al. (2015) |
58 |
142 |
8.5 ± 1.27 / 11.6 ± 2.25 |
14.10 ± 1.15 / 15.16 ± 1.36 |
31.90 ± 3.46 / 34.30 ± 2.20 |
|
Table 5: Comparative Analysis of MPV, PDW, and P-LCR in Hypoproductive and Hyperdestructive Thrombocytopenia |
|||||
P-LCR is increased in destructive thrombocytopenia compared with hypoproliferative thrombocytopenia and serves as a useful marker in aiding the differential diagnosis of conditions associated with abnormal platelet counts. [16]
Mean P-LCR in our study were 17.56 ± 4.27 and 37.88 ± 4.7 in hypoproductive and hyperdestructive cases which was similar to studies conducted by Negash et al and Narasimhulu et al.[17,18]
Bone marrow aspiration was done in a limited number of cases of megaloblastic anemia and leukemia cases and diagnosis was con firmed. Three cases of aplastic anemia were already diagnosed and receiving treatment.
Thus, platelet indices emerge as powerful, inexpensive tools that can guide early clinical decisions in patients with thrombocytopenia. The ability to differentiate between hyperdestructive and hypoproductive etiologies at presentation can influence investigations, triage urgency, and management strategies-particularly in settings with high dengue burden or limited access to bone marrow studies. Incorporating these indices into routine laboratory reporting may reduce unnecessary invasive procedures and improve diagnostic turnaround time. Standardizing cut-off values across platforms such as Mindray, Sysmex, and Beckman Coulter analyzers would further strengthen their integration in daily practice.
Conclusion:
In the era of automation and Artificial Intelligence present, upcoming analyzers are having new platelet parameters which aid in evaluation of causes of thrombocytopenia and better patient management. In our study MPV, PDW, PCT and P -LCR were useful in differentiation of hypoproductive causes of thrombocytopenia from hyperdestructive cases.
References:
1. Greer JP, Arber DA, Glader B, et al. Thrombocytopenia: pathophysiology and classification. In: Rodgers GM, ed. Wintrobe’s Clinical Hematology. 13th edn. Philadelphia: Lippincott Williams & Wilkins 2012:2465-66.
2. Hanson SR, Slichter SJ. Platelet kinetics in patients with bone marrow hypoplasia: evidence for a fixed platelet requirement. Blood 1985;66:1105.
3. Payne BA, Pierre RV. Pseudothrombocytopenia: a laboratory artifact with potentially serious consequences. Mayo Clin Proc 1984;59:123.
4. Kaushansky K, Lichtman MA, Prchal JT, Levi MM, Press OW, Burns LJ, et al. Williams Hematology. 9th ed. New York: McGraw -Hill Education; 2016.
5. Vidhyadhar S. Diagnostic implication and utility of platelet indices in differentiating hypoproductive and hyperdestructive thrombocytopenia. IOSR JDMS 2019;18:7–11.
6. Demirin H, Ozhan H, Ucgun T, Celer A, Bulur S, Cil H, et al. Normal range of mean platelet volume in healthy subjects: insight from a large epidemiologic study. Thromb Res. 2011 Oct;128(4):358–360.
7. Khairkar SP, More S, Pandey A, et al. Role of mean platelet volume in diagnosing categories of thrombocytopenia. Indian J Pat hol Oncol 2016;3(4):606-10.
8. Reddy RS, Phansalkar MD, Ramalakshmi PV. Mean platelet volume in thrombocytopenia. J Contemp Med Dent 2014;2:45-50.
9. Khanna R, Nayak DM, Manohar C, et al. A retrospective evaluation of mean platelet volume as a discriminating factor in thrombocytopenia of hypoproductive and hyperdestructive aetiologies. J Evol Med Dent Sci 2013;2:9059 -65.
10. Van der Lelie J, Von dem Borne AK. Increased mean platelet volume in septicaemia. J Clin Pathol 1983;36:693-6.
11. Wiwanitkit V. Plateletcrit, mean platelet volume, platelet distribution width: expected values and correlation with parallel red blood cell parameters. Clin Appl Thromb Hemost 2004;10:175-8.
12. Farias MG, Schunck EG, de Castro SM. Definition of reference ranges for the platelet distribution width (PDW): a local need. Clin Chem Lab Med 2010;48:255-7.
13. Sewakdas KP, Ashish P, Sarika M, et al. Platelet distribution width - a rarely studied platelet indice for determining causes of thrombocytopenia. Ann Int Med Dent Res 2016;2:193-7.
14. Peddaverannagari T, Chakkirala N, Prabhala S, et al. Utility of platelet count and platelet indices in evaluation of thrombocytopenia. J Evid Based Med Healthc 2020;7(49):2974-80.
15. Brummitt DR, Barker HF. Determination of a reference range for new platelet parameters produced by the Bayer ADVIA 120 full blood count analyser. Clin Lab Haematol 2000;22:103-7.
16. Elsewefy DA, Farweez BA, Ibrahim RR. Platelet indices: considerations in thrombocytopenia. Egypt J Haematol 2014;39:134-8.
17. Negash M, Tsegaye A, Medhin AG. Diagnostic predictive value of platelet indices for discriminating hypoproductive and immune thrombocytopenia purpura in patients attending a tertiary care teaching hospital in Ethiopia. BMC Hematol. 2016;16:18.
18. Narasimhulu G, Kumar KP, Reddy BP, et al. Diagnostic relevance of platelet indices in thrombocytopenia. IOSR J Dent Med Sci. 2019;18(1):22–26.