Diagnostic Utility Of Mean Corpuscular Volume (Mcv) In Predicting Red Cell Morphological Abnormalities On Peripheral Blood Smear In Adult Patients With Anemia.
- Shivnarayan Dilaware , Post Graduate Resident, Department of Pathology, Gandhi Medical College, Bhopal, Madhya Pradesh, India
- Archana Shrivastava , Associate Professor, Department of Pathology, Gandhi Medical College, Bhopal, Madhya Pradesh, India
- Ashish Koshti , Professor, Department of Pathology, Gandhi Medical College, Bhopal, Madhya Pradesh, India
- Maneesh Sulya , Professor & Head, Department of Pathology, Gandhi Medical College, Bhopal, Madhya Pradesh, India
Article Information:
Abstract:
Background: Mean corpuscular volume (MCV) is a routinely reported red cell index that provides a rapid and objective assessment of erythrocyte size and is widely used for the initial morphological classification of anemia. Peripheral blood smear (PBS) examination remains important for direct assessment of red cell morphology and confirmation of morphological abnormalities. Objective: To evaluate the diagnostic utility of MCV in predicting red cell morphological patterns on peripheral blood smear among adult patients with anemia. Materials and Methods: A prospective observational study was conducted at Gandhi Medical College and Hamidia Hospital, Bhopal, from May 2024 to October 2025. A total of 346 adult patients with anemia were evaluated. Automated red cell parameters were compared with PBS findings, using PBS as the reference standard. Sensitivity, specificity, positive predictive value (PPV), negative predictive value (NPV), and ROC-AUC were assessed. Results: On PBS, microcytic anemia was the most common pattern (36.71%), followed by normocytic (33.24%) and dimorphic anemia (20.81%). Automated MCV showed 96.1% sensitivity, 73.9% specificity, 68.2% PPV, and 97.0% NPV for detecting microcytic anemia. ROC analysis showed excellent discrimination for microcytic (AUC 0.91), normocytic (0.94), and macrocytic anemia (0.95). Conclusion: Automated MCV demonstrated excellent diagnostic performance and can serve as a useful screening parameter, while PBS remains important for confirmation of complex morphological patterns.
Keywords:
Article :
INTRODUCTION:
Anemia is a common hematological disorder in which reduced hemoglobin concentration compromises the oxygen-carrying capacity of blood. Morphological classification remains important because red cell size, hemoglobinization, and variation in cell population provide useful diagnostic clues. Automated hematology analyzers generate quantitative parameters such as mean corpuscular volume (MCV), mean corpuscular hemoglobin (MCH), mean corpuscular hemoglobin concentration (MCHC), and red cell distribution width (RDW), allowing rapid and reproducible assessment of red cell characteristics [1,2].
Peripheral blood smear (PBS) examination complements these numerical measurements by providing direct visualization of red cell size, shape, color, and mixed cell populations. Despite advances in automated hematology, microscopic examination continues to provide important morphological information that may not be adequately represented by automated parameters [2,3].
Several comparative studies have demonstrated useful agreement between automated red cell indices and PBS findings, particularly for common microcytic and macrocytic patterns. However, discrepancies may occur in normocytic and mixed morphological conditions, emphasizing the complementary role of microscopic examination [4,5].
The present study was undertaken to evaluate the diagnostic utility of MCV in predicting red cell morphological patterns on peripheral blood smear among adult patients with anemia.
MATERIALS AND METHODS:
This prospective observational study was conducted in the Department of Pathology and Central Clinical Laboratory, Gandhi Medical College and Hamidia Hospital, Bhopal, Madhya Pradesh, over an 18-month period from May 2024 to October 2025. Adult patients attending outpatient departments or admitted to associated hospital wards who fulfilled the study criteria were evaluated. The calculated sample size was 346 cases.
Inclusion Criteria
● Adult patients aged >18 years.
● Hemoglobin <13 g/dL in males.
● Hemoglobin <12 g/dL in females.
Exclusion Criteria
● Pregnant women.
● Patients undergoing chemotherapy or radiotherapy.
● Patients with a history of blood transfusion within the preceding 3 months.
● Patients currently receiving iron or vitamin B12 therapy.
Automated Hematology Analysis
Blood samples were analyzed using a three-part automated hematology analyzer. RBC count, hemoglobin, hematocrit, MCV, and RBC histogram patterns were recorded. Daily quality-control procedures were performed according to the manufacturer's recommendations.
Peripheral Blood Smear Examination
Peripheral blood smears were prepared from capillary blood obtained by finger prick method. Another smear also prepared from 2ml EDTA-anticoagulated venous blood within 2 hours of collection and stained with Leishman's stain. Smears were examined microscopically for red cell size, shape, chromasia, polychromasia and inclusions. Based on morphology, anemia was classified as microcytic, normocytic, macrocytic or dimorphic. Examiners were blinded to automated analyzer results, and discrepant cases were reviewed for consensus.
Statistical Analysis
Data were analyzed using SPSS version 20.0 or higher. Continuous variables were expressed as mean ± standard deviation and categorical variables as frequencies and percentages. Diagnostic accuracy measures including sensitivity, specificity, PPV and NPV were used. ROC analysis with AUC was performed to assess the diagnostic performance of automated parameters, using PBS as the reference standard.
Ethical Approval
The study received Institutional Ethics Committee approval from Gandhi Medical College, Bhopal (IEC letter no. 16311/MC/IEC/2024, dated 06 May 2024) before commencement.
RESULTS:
A total of 346 adult patients with anemia were analyzed. Peripheral blood smear examination showed microcytic anemia as the most frequent morphological pattern, followed by normocytic and dimorphic anemia.
Table 1: Frequency Distribution of Anemia Types Based on Peripheral Blood Smear Classification
|
Type of anemia |
Frequency |
Percentage (%) |
|
Microcytic |
127 |
36.71% |
|
Normocytic |
115 |
33.24% |
|
Dimorphic |
72 |
20.81% |
|
Macrocytic |
24 |
6.94% |
|
Other |
8 |
2.31% |
|
Total |
346 |
100% |
Microcytic anemia was the predominant morphological pattern on PBS, accounting for 36.71% of cases, followed by normocytic anemia (33.24%) and dimorphic anemia (20.81%). Macrocytic and other morphological patterns constituted smaller proportions.
Table 2: Cross-tabulation of Peripheral Blood Smear and Automated MCV Classification of Anemia
|
PBS classification |
Automated Microcytic |
Automated Normocytic |
Automated Macrocytic |
Total |
|
Microcytic |
122 |
4 |
0 |
126 |
|
Normocytic |
9 |
98 |
7 |
114 |
|
Macrocytic |
1 |
6 |
17 |
24 |
|
Total |
132 |
108 |
24 |
264 |
Among the 264 cases included in the cross-tabulation, automated MCV showed substantial agreement with PBS morphology. Concordant classification was observed in 122 of 126 microcytic, 98 of 114 normocytic, and 17 of 24 macrocytic cases. Some misclassification was observed, particularly among normocytic and macrocytic categories.
Table 3: Diagnostic Performance of Automated MCV for Detection of Microcytic Anemia
|
Diagnostic parameter |
Value |
|
Sensitivity |
96.1% |
|
Specificity |
73.9% |
|
Positive predictive value (PPV) |
68.2% |
|
Negative predictive value (NPV) |
97.0% |
Automated MCV demonstrated high sensitivity (96.1%) and NPV (97.0%) for identifying microcytic anemia. Specificity was 73.9%, while PPV was 68.2%. The findings indicate that MCV performed particularly well as a screening parameter for excluding microcytic morphology when the automated result was negative.
Table 4: Receiver Operating Characteristic Analysis of Automated MCV for Anemia Classification
|
Anemia type |
AUC |
Interpretation |
|
Microcytic |
0.91 |
Excellent discrimination |
|
Normocytic |
0.94 |
Excellent discrimination |
|
Macrocytic |
0.95 |
Excellent discrimination |
ROC analysis demonstrated excellent discriminatory performance of MCV for all three major morphological categories. The highest AUC was observed for macrocytic anemia (0.95), followed by normocytic anemia (0.94) and microcytic anemia (0.91).
Figure 1: Representative Peripheral Blood Smear Morphology in Different Types of Anemia
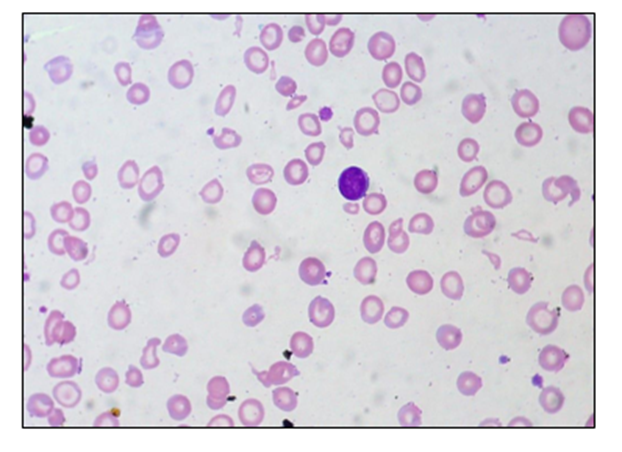
Figure 1(a) Microcytic anemia (Leishman stain)
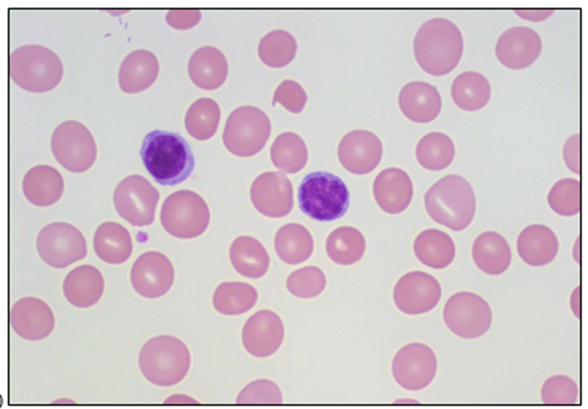
Figure 1(b) Macrocytic anemia (Leishman stain)
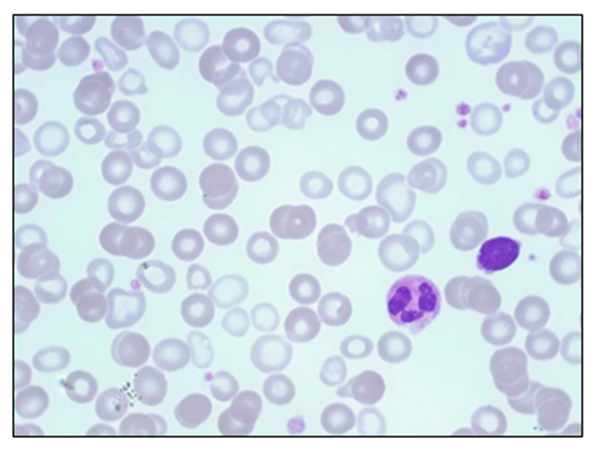
Figure 1(c) dimorphic anemia (Leishman stain)
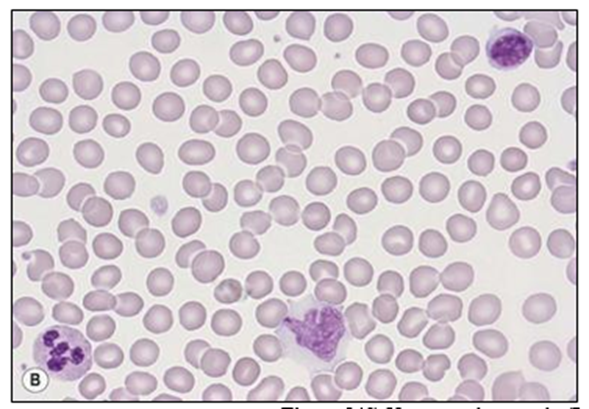
Figure 1(d) Normocytic anemia (Leishman stain)
DISCUSSION:
The present study evaluated the diagnostic utility of mean corpuscular volume (MCV) in predicting red cell morphological patterns on peripheral blood smear (PBS) among adult patients with anemia. MCV is an objective and routinely available red cell index that reflects the average erythrocyte volume and provides a convenient basis for the initial classification of anemia into microcytic, normocytic, and macrocytic patterns.
In the present study, microcytic anemia was the most frequent morphological pattern on PBS, accounting for 36.71% of cases, followed by normocytic anemia (33.24%) and macrocytic anemia (6.94%). Comparison of MCV-based classification with PBS demonstrated substantial concordance. Among the cases included in the cross-tabulation, MCV correctly classified 122 of 126 microcytic cases, 98 of 114 normocytic cases, and 17 of 24 macrocytic cases. These findings indicate that MCV provides a reliable preliminary assessment of red cell size and can effectively predict the major morphological patterns of anemia. Similar agreement between automated red cell indices and peripheral smear morphology has been reported in previous studies [6,7].
The diagnostic performance of MCV was particularly strong for microcytic anemia. MCV demonstrated a sensitivity of 96.1% and a negative predictive value of 97.0%, indicating that it is highly sensitive for identifying patients with microcytic morphology. The specificity of 73.9% and positive predictive value of 68.2%, however, indicate that an MCV-based microcytic classification may not correspond to microcytosis on PBS in every case. Thus, MCV appears particularly valuable as a screening parameter, while morphological confirmation remains useful when the automated classification and clinical findings are discordant.
ROC analysis further demonstrated the diagnostic utility of MCV. The area under the ROC curve was 0.91 for microcytic anemia, 0.94 for normocytic anemia, and 0.95 for macrocytic anemia, representing excellent discriminatory performance across all three major morphological categories. The highest AUC for macrocytic anemia suggests that increasing MCV provides particularly strong discrimination for macrocytic morphology, although the relatively small number of macrocytic cases should be considered while interpreting this finding [8, 9].
Despite its strong diagnostic performance, MCV represents the average volume of the circulating red cell population and therefore has an inherent limitation when erythrocytes of markedly different sizes coexist. In dimorphic anemia, microcytic and macrocytic populations may produce an apparently normal average MCV, thereby masking the underlying morphological heterogeneity. Consequently, MCV alone cannot completely characterize mixed red cell populations, and PBS remains important in such cases.
Overall, the findings demonstrate that MCV is a simple, rapid, objective, and diagnostically useful parameter for predicting major red cell morphological patterns in adult patients with anemia. Its high sensitivity for microcytic anemia and excellent ROC-AUC values support its use as a first-line screening parameter. Nevertheless, MCV should be interpreted as a measure of average red cell size rather than a substitute for direct morphological assessment, particularly in patients with suspected dimorphic or otherwise heterogeneous red cell populations.
CONCLUSION:
Mean corpuscular volume (MCV) demonstrated good diagnostic utility in predicting the major red cell morphological patterns of anemia and showed particularly high sensitivity for detecting microcytic anemia. Its excellent discriminatory performance supports its use as a rapid and objective initial screening parameter. However, because MCV represents the average red cell volume, it may not adequately identify mixed red cell populations, particularly in dimorphic anemia. Therefore, peripheral blood smear examination remains important for morphological confirmation, especially when mixed morphology is suspected or when MCV findings are discordant with the clinical picture.
REFERENCES:
1. Singh M, Kafle SU, Shaukin S, Pokhrel S. Study of peripheral blood smear findings in patients of anemia and to compare it with automated hematology analyzer generated red cell parameters. Birat J Health Sci. 2020;5(3):1231-1235. doi:10.3126/bjhs.v5i3.33704.
2. Navya KT, Prasad K, Singh BMK. Analysis of red blood cells from peripheral blood smear images for anemia detection: a methodological review. Med Biol Eng Comput. 2022 Sep;60(9):2445-2462. doi: 10.1007/s11517-022-02614-z. Epub 2022 Jul 15.
3. Goti R, Shah PH, Raval J. Comparison between automated hematology analyzer and peripheral blood smear examination for assessment of morphological types of anemia. GAIMS J Med Sci. 2024;4(1):188-191. doi: 10.5281/zenodo.10775031.
4. Meena H, Pruthviraj CS, Gupta R, Guru A, Sutrakar SK. Correlation of automated cell counter RBC histograms and peripheral smear in anemia typing. Asian J Med Sci. 2023;14(2):127-131. doi:10.3126/ajms.v14i2.49128.
5. Shashidhar MR, Purushotham R, Nagesha KR. Correlation of automated cell counter RBC histograms and peripheral smear in anemias. Trop J Pathol Microbiol. 2021;7(5):261-265. doi:10.17511/jopm.2021.i05.08.
6. Patel KD, Bhalodia MJ, Chauhan S, Jasani J, Mavadiya S. Correlation between morphological typing of anemia based on RBC indices and RDW obtained from Sysmex KX-21, an automated hematological analyser with peripheral blood smear examination. Int J Med Pharm Res. 2023;4(4):291-297. doi:10.5281/zenodo.8286084.
7. Venukumar M, Suma MT. Comparison between morphological typing of anemia based on RBC indices obtained from an automated haematology analyzer with peripheral blood smear examination. Saudi J Pathol Microbiol. 2019;4(3):226-232. doi:10.21276/sjpm.2019.4.3.16.
8. Gil T, Moon CI, Lee S, Lee O. Automatic analysis system for abnormal red blood cells in peripheral blood smears. Microsc Res Tech. 2022 Nov;85(11):3623-3632. doi: 10.1002/jemt.24215.
9. Acharya V, Kumar P. Identification and red blood cell automated counting from blood smear images using computer-aided system. Med Biol Eng Comput. 2018 Mar;56(3):483-489. doi: 10.1007/s11517-017-1708-9.