Association of Erythrocyte Membrane Total Carbohydrate with Glycated Hemoglobin Across Glycemic States: A Prospective Comparative Observational Study.
- Doddappa M. B , Assistant Professor, Department of Biochemistry, MVJ Medical College and Research Hospital, Bangalore, Karnataka, India.
- Kumudhakshi D , II-MBBS student, MVJ Medical College and Research Hospital, Bangalore, Karnataka, India.
Article Information:
Abstract:
Background: Persistent hyperglycemia exposes erythrocytes to non-enzymatic glycation and oxidative stress throughout their circulating life. Although changes in erythrocyte membrane proteins, lipids, deformability and selected glycocalyx residues have been described in diabetes, the behaviour of total membrane carbohydrate across different glycemic states is less well characterized. The study is designed to compare erythrocyte membrane total carbohydrate among originally assigned control, prediabetic and diabetic groups and to examine its association with glycated hemoglobin (HbA1c). Methods: This prospective comparative observational study included 90 adults, with 30 participants in each study group. EDTA-anticoagulated blood was used for HbA1c, hemoglobin and hematocrit measurements and for preparation of erythrocyte membranes. Packed cells were washed with saline and Tris-HCl buffer, subjected to hypotonic lysis at 4°C, and repeatedly centrifuged until the membrane preparation was visually free of hemoglobin. Total membrane carbohydrate was estimated by the phenol-sulfuric acid method and read at 510 nm. Between-group comparisons used Welch one-way analysis of variance; categorical variables were compared by chi-square testing. Pearson and Spearman correlations and simple linear regression were used to assess the relationship between membrane carbohydrate and HbA1c. Results: The groups were comparable in age (p=0.509) and sex distribution (p=0.326). Mean HbA1c was 6.58±1.40% in the control group, 6.36±0.67% in the prediabetic group and 9.45±1.67% in the diabetic group (Welch F=44.07, p<0.001). Erythrocyte membrane total carbohydrate increased across the three groups, from 0.123±0.040 in controls to 0.141±0.031 in prediabetes and 0.162±0.029 in diabetes (Welch F=9.54, p=0.0003). In the completed 90-participant analysis, membrane carbohydrate was positively associated with HbA1c (Pearson r=0.318, p=0.002; Spearman ρ=0.332, p=0.001). Linear regression yielded a slope of 0.0061 assay-derived units per 1% HbA1c and R²=0.101. Conclusion: Erythrocyte membrane total carbohydrate showed a graded increase across the originally assigned glycemic groups and a modest positive association with HbA1c. The findings support the concept that chronic glycemic exposure is accompanied by measurable erythrocyte membrane biochemical changes, but the non-specific nature of the phenol-sulfuric acid assay and limitations in membrane normalization require cautious interpretation.
Keywords:
Article :
INTRODUCTION:
Diabetes mellitus is characterized by sustained disturbances in glucose metabolism that expose circulating cells to a biochemical environment rich in glucose, reactive oxygen species and glycation intermediates. HbA1c is widely used to estimate longer-term glycemic exposure and is incorporated into current diagnostic and monitoring frameworks [1-4]. Its clinical value depends on standardized measurement, but it remains a product of glucose exposure within the erythrocyte rather than a direct measurement of plasma glucose [5-8].
The interpretation of HbA1c is therefore inseparable from erythrocyte biology. Differences in red-cell lifespan can alter the time available for hemoglobin glycation, and conditions that change erythropoiesis or red-cell survival may shift HbA1c independently of ambient glycemia [6-12]. Iron deficiency, hemolysis, recent blood loss, transfusion, renal disease and hemoglobin variants are among the recognized sources of discordance. For studies linking HbA1c to erythrocyte membrane chemistry, this hematological context is particularly important.
The erythrocyte membrane is a composite structure containing phospholipids, cholesterol, integral membrane proteins, cytoskeletal proteins, glycoproteins and glycolipids. Carbohydrate-rich structures are concentrated on the external membrane surface, where they contribute to the glycocalyx, surface charge, cell-cell interactions and rheological behaviour. The classic erythrocyte-ghost preparation described by Dodge and colleagues remains a foundation for biochemical studies of the red-cell membrane, while the phenol-sulfuric acid reaction provides a broad colorimetric measure of total carbohydrate [13,14].
Long before HbA1c became a routine clinical test, investigators showed that non-enzymatic glycation extends beyond hemoglobin to proteins of the erythrocyte membrane [15,16]. Experimental and clinical studies subsequently linked membrane protein glycation to lower membrane fluidity, altered protein conformation, oxidative injury and impaired deformability [17-22]. Changes in glycophorin-associated sialic acid and other surface properties have also been reported in diabetes [23,24]. More recent work using membrane biochemistry, proteomics and biophysical approaches has reinforced the view that the erythrocyte records aspects of the metabolic environment to which it has been exposed [25-30].
Despite this body of evidence, most studies have focused on individual membrane proteins, lipids, sialic acid, advanced glycation products or mechanical behaviour. Total membrane carbohydrate has received less attention, particularly across a spectrum that includes an intermediate prediabetic group. A broad carbohydrate assay cannot identify which glycan residues or glycoconjugates are changing, but it can provide an exploratory measure of whether the overall carbohydrate signal differs with glycemic status. The present study was therefore undertaken to compare erythrocyte membrane total carbohydrate among originally assigned control, prediabetic and diabetic groups and to determine whether this measure is associated with HbA1c.
MATERIALS AND METHODS:
Study design and setting
A prospective comparative observational study with one-time clinical and laboratory measurements was conducted through the Department of Biochemistry, MVJ Medical College and Research Hospital, Bengaluru, during the 2024-2025 undergraduate research cycle. The study was organized around three originally assigned groups: control, prediabetic and diabetic, with 30 participants in each group.
Ethical approval
The protocol was approved by the Institutional Ethics Committee of MVJ Medical College and Research Hospital (IEC-87/2024). Participant recruitment, venous blood collection and handling of clinical information were undertaken after written informed consent. Study records were handled without including personal identifiers in the analytical dataset.
Study population and sample size
Adults aged 18-75 years were eligible when adequate clinical and laboratory information was available for assignment to one of the study groups and when a suitable venous blood sample had been obtained. The planned sample comprised 90 participants. Under a one-way ANOVA framework with three equal groups, two-sided alpha of 0.05, 80% power and a standardized omnibus effect size (Cohen f) of 0.333, approximately 90 participants were required.
Eligibility criteria
Participants were excluded when conditions or treatments were present that could materially alter erythrocyte turnover or interfere with HbA1c interpretation. The project protocol listed pregnancy, recent blood transfusion, known hemoglobin disorders, active hemolysis, recent major blood loss, severe nutritional anemia, advanced chronic kidney disease, significant liver disease, erythropoietin therapy and other recognized causes of altered red-cell survival. Hormone replacement therapy was also an exclusion criterion in the original protocol.
Glycemic group allocation and data handling
The original project record states that group allocation was based on blood glucose and HbA1c information. The underlying fasting-glucose, oral glucose tolerance and diagnostic-history records used for the initial allocation were not retained in the analytical record available for manuscript preparation. For that reason, the present paper preserves the original study-group labels rather than retrospectively reclassifying participants from HbA1c alone. The completed 90-participant analysis reported in the project record was used for the primary carbohydrate analysis. This distinction is relevant because the group labels should be interpreted as the original study assignments, not as a new classification performed during manuscript preparation.
Blood collection and routine laboratory measurements
Venous blood was collected under aseptic conditions into EDTA-containing tubes. HbA1c, hemoglobin and hematocrit were measured from the collected samples using the laboratory procedures employed during the project. These variables were included both to describe the study groups and to provide hematological context for interpreting HbA1c, since red-cell turnover can influence glycated hemoglobin independently of glucose exposure [2,6-12].
Preparation of erythrocyte membranes
After centrifugation, plasma was removed and packed erythrocytes were washed with 500 µL normal saline and centrifuged at 5,000 × g for 10 minutes. The supernatant was discarded and the saline wash was repeated. The washed cells were then treated with isotonic Tris-HCl buffer (pH 7.4); approximately 0.1 mL packed cells was mixed with buffer and centrifuged at 1,000 rpm for 5 minutes, with the wash repeated three times. The cells were suspended in hypotonic buffer and held at 4°C for 4 hours to promote hemolysis. Further washing with hypotonic buffer was followed by centrifugation at 15,000 × g for 30 minutes and then 10,000 × g for 20 minutes. Washing was continued until the supernatant became clear and the membrane preparation appeared visually colorless. The general approach follows the principle of erythrocyte-ghost preparation [14].
Estimation of erythrocyte membrane total carbohydrate
Total membrane carbohydrate was estimated by the phenol-sulfuric acid colorimetric method [13]. A 250 µL aliquot of membrane suspension was mixed with 500 µL distilled water. One hundred microlitres of 5% phenol was added, followed carefully by 500 µL of 96% sulfuric acid. The reaction mixture was kept at room temperature for 10 minutes, incubated for 20 minutes at 30°C, cooled for approximately 5 minutes and read at 510 nm. A glucose standard curve was used to relate absorbance to the assay response. The retained project record did not provide a validated mass-per-membrane-protein unit for the final values, and membrane protein concentration was not consistently documented. Accordingly, the present manuscript reports total carbohydrate on the assay-derived numerical scale used in the completed project analysis rather than assigning an unsupported concentration unit.
Assay calibration and quality considerations
The calibration series showed increasing absorbance with increasing glucose standard concentration. The retained calibration plot had a linear regression equation of y=3.071x+0.151 with R²=0.9747 (Figure 1). A reagent blank and multiple standards were included in the calibration sequence. Because residual hemoglobin and membrane recovery can affect fixed-volume membrane assays, visual clearing of the membrane fraction was used during preparation, but no objective residual-hemoglobin index was available in the archived record.
Statistical analysis
Continuous variables were summarized as mean±standard deviation and, where available, range. Categorical variables were reported as counts and percentages. Sex distribution was compared by Pearson chi-square testing. Age, HbA1c, hemoglobin, hematocrit and erythrocyte membrane total carbohydrate were compared across groups using Welch one-way analysis of variance when variance equality could not be assumed. The association between HbA1c and membrane total carbohydrate in the completed dataset was assessed with Pearson and Spearman correlation. Simple linear regression was used to estimate the change in membrane carbohydrate per 1% increase in HbA1c and the proportion of explained variation. Tests were two-sided, and p<0.05 was considered statistically significant.
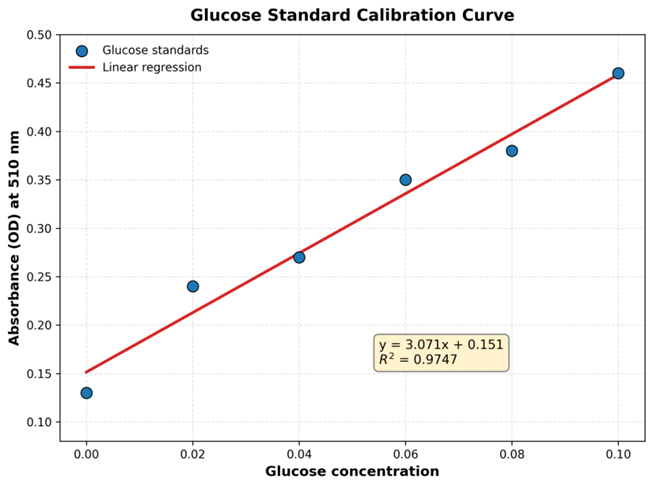
Figure 1: Glucose standard calibration curve used for the phenol-sulfuric acid assay. The retained project calibration plot showed y=3.071x+0.151 and R²=0.9747.
RESULTS:
Participant characteristics
Ninety adults were included in the completed analysis, with 30 participants in each of the three originally assigned study groups. The control group comprised 13 men and 17 women, while the prediabetic and diabetic groups each included 18 men and 12 women. Sex distribution did not differ significantly across groups (Pearson χ²=2.24, p=0.326). Mean age was also comparable, ranging from 47.4±21.8 years in controls to 52.2±12.2 years in diabetes (Welch F=0.68, p=0.509) (Table 1).
Table 1. Demographic and laboratory characteristics of the study groups
|
Characteristic |
Control (n=30) |
Prediabetic (n=30) |
Diabetic (n=30) |
Welch F / χ² |
p value |
|
Sex, male/female |
13/17 |
18/12 |
18/12 |
χ²=2.24 |
0.326 |
|
Age (years) |
47.4 ± 21.8 |
49.2 ± 15.7 |
52.2 ± 12.2 |
0.68 |
0.509 |
|
HbA1c (%) |
6.58 ± 1.40 |
6.36 ± 0.67 |
9.45 ± 1.67 |
44.07 |
<0.001 |
|
Hemoglobin (g/dL) |
12.47 ± 2.77 |
13.62 ± 1.28 |
12.08 ± 2.12 |
5.60 |
0.006 |
|
Hematocrit (%) |
36.89 ± 7.38 |
41.36 ± 4.21 |
37.41 ± 6.63 |
2.41 |
0.112 |
Values are mean ± SD unless otherwise stated. Welch one-way ANOVA was used for continuous variables; Pearson chi-square was used for sex distribution.
HbA1c and hematological profile
HbA1c differed markedly among the groups (Welch F=44.07, p<0.001). The diabetic group had the highest mean HbA1c (9.45±1.67%), whereas the control and prediabetic group means were 6.58±1.40% and 6.36±0.67%, respectively (Table 1; Figure 3). In the project analysis, the diabetic group remained significantly higher than the other two groups after Holm adjustment, while the control and prediabetic groups were not significantly different. Mean hemoglobin also differed across groups (F=5.60, p=0.006), with the lowest mean in the diabetic group and the highest in the prediabetic group. Hematocrit did not show a statistically significant group difference (F=2.41, p=0.112).
Erythrocyte membrane total carbohydrate
A graded increase in erythrocyte membrane total carbohydrate was observed across the three groups. Controls had the lowest mean value (0.123±0.040), the prediabetic group had an intermediate value (0.141±0.031), and the diabetic group had the highest value (0.162±0.029). The respective ranges were 0.05-0.26, 0.08-0.21 and 0.11-0.23. Welch ANOVA showed a significant overall group difference (F=9.54, p=0.0003) (Table 2; Figure 2). The overlapping ranges indicate that the measure is not a simple discriminator at the individual level, despite the clear difference in group means.
Table 2. Erythrocyte membrane total carbohydrate across the study groups
|
Group |
n |
Mean ± SD |
Range |
|
Control |
30 |
0.123 ± 0.040 |
0.05-0.26 |
|
Prediabetic |
30 |
0.141 ± 0.031 |
0.08-0.21 |
|
Diabetic |
30 |
0.162 ± 0.029 |
0.11-0.23 |
Overall comparison: Welch F=9.54, p=0.0003. Values are reported on the assay-derived numerical scale retained in the project record because a validated mass-per-membrane-protein unit was not documented.
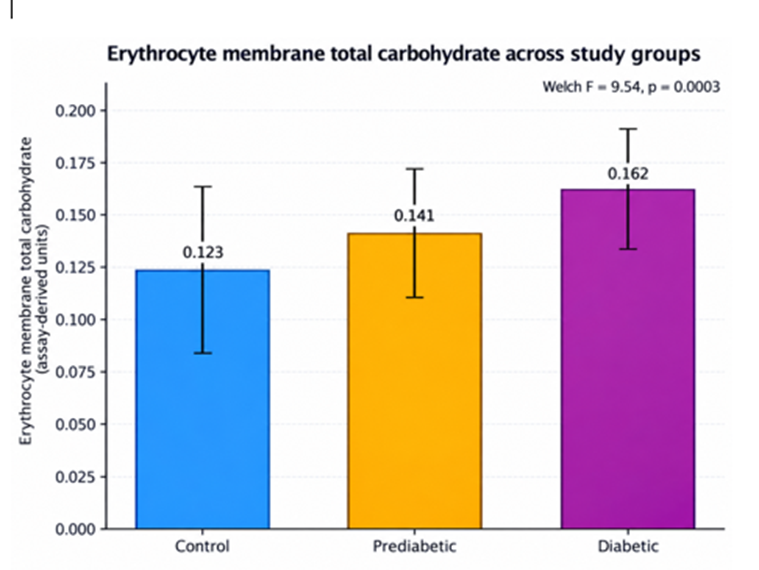
Figure 2. Mean erythrocyte membrane total carbohydrate across the control, prediabetic and diabetic groups. Bars show group means and error bars show standard deviations. The overall Welch ANOVA was significant (F=9.54, p=0.0003)
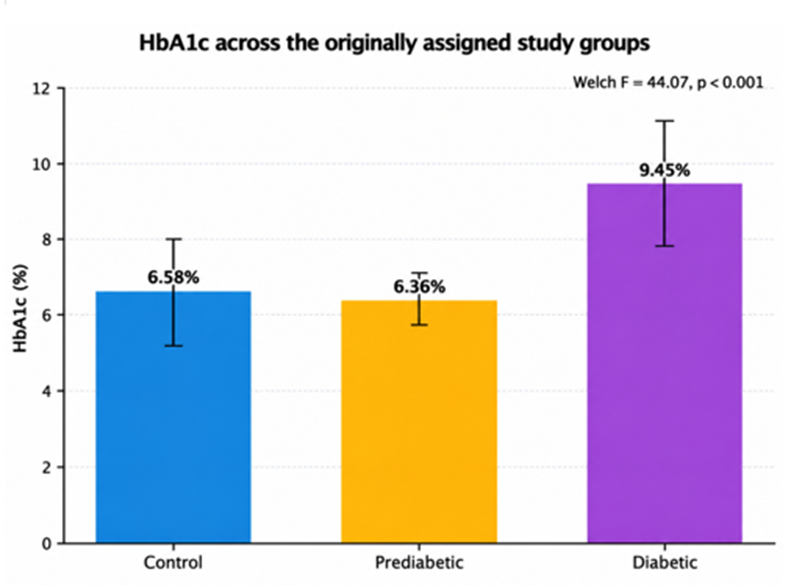
Figure 3. Mean HbA1c across the originally assigned study groups. Bars show means and error bars show standard deviations. The overall Welch ANOVA was significant (F=44.07, p<0.001).
Association between membrane carbohydrate and HbA1c
In the completed 90-participant analysis, higher HbA1c was associated with higher erythrocyte membrane total carbohydrate. The Pearson correlation coefficient was r=0.318 (p=0.002), and Spearman analysis produced a similar estimate (ρ=0.332, p=0.001). Simple linear regression indicated an increase of approximately 0.0061 assay-derived units in membrane carbohydrate for each 1% increase in HbA1c. The model explained 10.1% of the observed variation (R²=0.101), indicating a statistically detectable but modest relationship (Table 3).
Table 3. Association of HbA1c with erythrocyte membrane total carbohydrate in the completed dataset
|
Analysis |
Estimate |
95% CI / model metric |
p value |
|
Pearson correlation |
r = 0.318 |
95% CI 0.119 to 0.493 |
0.002 |
|
Spearman correlation |
ρ = 0.332 |
Not reported |
0.001 |
|
Simple linear regression |
Slope = 0.0061 per 1% HbA1c |
95% CI 0.0023 to 0.0100; R²=0.101 |
0.002 |
DISCUSSION:
The principal finding of this study was a progressive rise in erythrocyte membrane total carbohydrate across the originally assigned control, prediabetic and diabetic groups. The mean increased from 0.123 in controls to 0.141 in prediabetes and 0.162 in diabetes, with a significant overall group difference. The same membrane measure showed a modest positive association with HbA1c. Taken together, these observations are consistent with the idea that the erythrocyte membrane records biochemical consequences of sustained glycemic exposure, although they do not establish a causal pathway.
There is a strong biological basis for expecting erythrocyte membrane chemistry to change in diabetes. Mature erythrocytes remain in the circulation for weeks and lack the machinery for new protein synthesis, so membrane proteins and lipids are repeatedly exposed to glucose and oxidants. Early studies demonstrated non-enzymatic glycation of erythrocyte membrane proteins and showed that membrane glycation rises with diabetic glycemia [15,16]. Subsequent work linked glycation to reduced membrane fluidity, altered protein conformation and impaired deformability [17-22]. The present study differs from those mechanistic approaches because it measured the total carbohydrate signal rather than a single membrane protein or glycation product.
The intermediate value observed in the prediabetic group is of particular interest. It suggests that membrane biochemical changes may be detectable before the metabolic state represented by the diabetic group is established. This interpretation is compatible with proteomic work showing glycated erythrocyte membrane proteins not only in type 2 diabetes but also in impaired glucose tolerance [26]. However, the finding should not be interpreted as evidence that total membrane carbohydrate can diagnose prediabetes. The group ranges overlapped substantially, and the assay does not distinguish the molecular source of the measured carbohydrate.
The direction of change also requires careful interpretation. Rogers and colleagues reported reduced sialic acid in glycophorin from diabetic erythrocytes, and Mazzanti et al. similarly described changes in erythrocyte membrane sialic acid in diabetes [23,24]. A lower concentration of a specific terminal sugar does not necessarily conflict with an increase in the broad phenol-sulfuric acid signal. The assay used here responds to carbohydrate-containing material collectively. A reduction in one surface residue may coexist with increased glycation, altered glycoprotein composition, changes in glycolipids or redistribution of other carbohydrate-containing structures. The present result should therefore be described as an increase in total assay-reactive membrane carbohydrate, not as an increase in every glycocalyx component.
Oxidative stress provides a second plausible link between glycemic exposure and the observed membrane change. Diabetic erythrocytes have been shown to exhibit increased membrane lipid peroxidation, oxidative damage to spectrin and altered membrane mechanics [20,22]. Modern reviews and biophysical studies continue to emphasize the interaction among glycation, lipid composition, oxidative stress and erythrocyte deformability [27-30]. These processes can alter membrane organization and the exposure or recovery of glycoconjugates during membrane preparation. The observed carbohydrate difference may therefore reflect a composite effect of glycation and membrane remodeling rather than glucose incorporation alone.
The correlation with HbA1c was statistically significant but modest. Pearson r=0.318 corresponds to an R² of only about 0.10 in the simple regression model. Thus, HbA1c accounted for roughly one tenth of the variation in membrane carbohydrate. This is biologically plausible because the membrane phenotype is influenced by multiple factors, including erythrocyte age, oxidative state, lipid composition, nutritional status, inflammatory activity and membrane recovery during laboratory preparation. A small-to-moderate correlation may therefore be more realistic than a near-linear relationship between two biologically complex measures.
The hematological findings also deserve attention. Hemoglobin differed across the groups while hematocrit did not. HbA1c depends on both glycemic exposure and the time available for hemoglobin glycation, which is why red-cell lifespan and disorders of erythropoiesis can alter the result [6-12]. The study attempted to reduce this problem through exclusion criteria, but detailed iron studies, reticulocyte counts, vitamin B12, folate, markers of hemolysis and hemoglobin-variant testing were not available. Consequently, hematological influences cannot be completely separated from glycemic influences in the present association.
The phenol-sulfuric acid method was suitable for an exploratory project because it is simple, sensitive and broadly responsive to carbohydrates [13]. Its breadth is also its main limitation. The reaction does not identify whether the signal arises from sialylated glycoproteins, neutral sugars, glycolipids, adsorbed carbohydrate-containing material or other glycoconjugates. Future work should combine a total-carbohydrate assay with membrane protein quantification and targeted techniques such as lectin binding, chromatography, mass spectrometry or glycoproteomic analysis. The proteomic identification of glycated erythrocyte membrane proteins in different glycemic states demonstrates the value of moving from bulk measurement toward molecular resolution [26].
Several limitations should be considered. First, the study was observational and based on a single time point, so causality and temporal change cannot be inferred. Second, the sample size was adequate for the planned three-group comparison but remains small for multivariable modeling or subgroup analysis. Third, the original glycemic group allocation relied on blood glucose and HbA1c information, but the fasting-glucose, oral glucose tolerance and diagnostic-history records used for that allocation were not available for independent reconstruction during manuscript preparation. The group labels should therefore be understood as the original project assignments. Fourth, the archived project documentation contained inconsistent annotations concerning the number of hemoglobin and hematocrit observations in different summary sections; these variables were therefore used descriptively and not as covariates in an adjusted model. Fifth, membrane protein concentration, membrane yield and an objective measure of residual hemoglobin were not consistently documented, so the carbohydrate values cannot be presented as a rigorously normalized mass-per-protein measure. Finally, potentially important covariates such as body mass index, fasting glucose, duration of diabetes, treatment, lipid profile and oxidative stress markers were not included in the final association analysis.
Within these constraints, the study has useful strengths. It examined three glycemic groups with equal planned sample sizes, applied the same membrane preparation and carbohydrate assay across groups, and evaluated the membrane measure against HbA1c using both parametric and rank-based correlation. The graded pattern across groups, together with the concordant Pearson and Spearman results, provides a coherent exploratory signal that warrants confirmation using better-normalized and more chemically specific membrane measurements.
CONCLUSION:
Erythrocyte membrane total carbohydrate increased progressively across the originally assigned control, prediabetic and diabetic groups and showed a modest positive association with HbA1c. The findings support the broader concept that the erythrocyte membrane is biochemically responsive to chronic glycemic exposure. Because the phenol-sulfuric acid assay measures total carbohydrate rather than individual glycans and because membrane normalization was not fully documented, the result should be viewed as exploratory rather than diagnostic. Larger longitudinal studies incorporating membrane protein normalization, residual-hemoglobin quality control and targeted glycan or glycoproteomic analysis are needed to determine which erythrocyte surface components account for the observed signal and whether they have clinical relevance.
REFERENCES:
1. American Diabetes Association Professional Practice Committee. 2. Diagnosis and Classification of Diabetes: Standards of Care in Diabetes-2024. Diabetes Care. 2024;47(Suppl 1):S20-S42. doi:10.2337/dc24-S002.
2. Sacks DB, Arnold M, Bakris GL, Bruns DE, Horvath AR, Lernmark A, Metzger BE, Nathan DM, Kirkman MS. Guidelines and Recommendations for Laboratory Analysis in the Diagnosis and Management of Diabetes Mellitus. Clin Chem. 2023;69(8):808-868. doi:10.1093/clinchem/hvad080.
3. International Expert Committee. International Expert Committee report on the role of the A1C assay in the diagnosis of diabetes. Diabetes Care. 2009;32(7):1327-1334. doi:10.2337/dc09-9033.
4. Nathan DM, Kuenen J, Borg R, Zheng H, Schoenfeld D, Heine RJ; A1c-Derived Average Glucose Study Group. Translating the A1C assay into estimated average glucose values. Diabetes Care. 2008;31(8):1473-1478. doi:10.2337/dc08-0545.
5. Little RR, Rohlfing C, Sacks DB. The National Glycohemoglobin Standardization Program: over 20 years of improving hemoglobin A1c measurement. Clin Chem. 2019;65(7):839-848. doi:10.1373/clinchem.2018.296962.
6. Cohen RM, Franco RS, Khera PK, Smith EP, Lindsell CJ, Ciraolo PJ, Palascak MB, Joiner CH. Red cell life span heterogeneity in hematologically normal people is sufficient to alter HbA1c. Blood. 2008;112(10):4284-4291. doi:10.1182/blood-2008-04-154112.
7. Radin MS. Pitfalls in hemoglobin A1c measurement: when results may be misleading. J Gen Intern Med. 2014;29(2):388-394. doi:10.1007/s11606-013-2595-x.
8. Weykamp C. HbA1c: a review of analytical and clinical aspects. Ann Lab Med. 2013;33(6):393-400. doi:10.3343/alm.2013.33.6.393.
9. Ahmad J, Rafat D. HbA1c and iron deficiency: a review. Diabetes Metab Syndr. 2013;7(2):118-122. doi:10.1016/j.dsx.2013.02.004.
10. Kim C, Bullard KM, Herman WH, Beckles GL. Association between iron deficiency and A1C levels among adults without diabetes in the National Health and Nutrition Examination Survey, 1999-2006. Diabetes Care. 2010;33(4):780-785. doi:10.2337/dc09-0836.
11. Sinha N, Mishra TK, Sinha T, Gupta N. Effect of iron deficiency anemia on hemoglobin A1c levels. Ann Lab Med. 2012;32(1):17-22. doi:10.3343/alm.2012.32.1.17.
12. Christy AL, Manjrekar PA, Babu RP, Hegde A, Rukmini MS. Influence of iron deficiency anemia on hemoglobin A1c levels in diabetic individuals with controlled plasma glucose levels. Iran Biomed J. 2014;18(2):88-93. doi:10.6091/ibj.1257.2014.
13. DuBois M, Gilles KA, Hamilton JK, Rebers PA, Smith F. Colorimetric method for determination of sugars and related substances. Anal Chem. 1956;28(3):350-356. doi:10.1021/ac60111a017.
14. Dodge JT, Mitchell C, Hanahan DJ. The preparation and chemical characteristics of hemoglobin-free ghosts of human erythrocytes. Arch Biochem Biophys. 1963;100:119-130. doi:10.1016/0003-9861(63)90042-0.
15. Miller JA, Gravallese E, Bunn HF. Nonenzymatic glycosylation of erythrocyte membrane proteins. Relevance to diabetes. J Clin Invest. 1980;65(4):896-901. doi:10.1172/JCI109743.
16. Bunn HF. Nonenzymatic glycosylation of protein: relevance to diabetes. Am J Med. 1981;70(2):325-330. doi:10.1016/0002-9343(81)90769-5.
17. Watala C, Zawodniak M, Bryszewska M, Nowak S. Nonenzymatic protein glycosylation. I. Lowered erythrocyte membrane fluidity in juvenile diabetes. Ann Clin Res. 1985;17(6):327-330.
18. Bryszewska M, Szosland K. Association between the glycation of erythrocyte membrane proteins and membrane fluidity. Clin Biochem. 1988;21(1):49-51. doi:10.1016/S0009-9120(88)80111-5.
19. Watala C. In vitro glycation of red blood cell proteins: high levels of glucose lower lipid fluidity of erythrocyte membranes. Exp Pathol. 1988;33(4):233-238. doi:10.1016/S0232-1513(88)80077-X.
20. Jain SK, McVie R, Duett J, Herbst JJ. Erythrocyte membrane lipid peroxidation and glycosylated hemoglobin in diabetes. Diabetes. 1989;38(12):1539-1543. doi:10.2337/diab.38.12.1539.
21. Yue DK, Capogreco C, McLennan SV, Turtle JR. The effect of improved control on blood filtration properties and non-enzymatic glycosylation of erythrocyte proteins in type 2 diabetes. Diabet Med. 1989;6(6):486-489. doi:10.1111/j.1464-5491.1989.tb01214.x.
22. Schwartz RS, Madsen JW, Rybicki AC, Nagel RL. Oxidation of spectrin and deformability defects in diabetic erythrocytes. Diabetes. 1991;40(6):701-708. doi:10.2337/diab.40.6.701.
23. Rogers ME, Williams DT, Niththyananthan R, Rampling MW, Heslop KE, Johnston DG. Decrease in erythrocyte glycophorin sialic acid content is associated with increased erythrocyte aggregation in human diabetes. Clin Sci (Lond). 1992;82(3):309-313. doi:10.1042/cs0820309.
24. Mazzanti L, Rabini RA, Salvolini E, Tesei M, Martarelli D, Venerando B, Curatola G. Sialic acid, diabetes, and aging: a study on the erythrocyte membrane. Metabolism. 1997;46(1):59-61. doi:10.1016/S0026-0495(97)90168-2.
25. Reshamwala SMS, Patil ND. Biochemical changes in erythrocyte membrane in uncontrolled type 2 diabetes mellitus. Indian J Biochem Biophys. 2005;42(4):250-253.
26. Zhang Q, Tang N, Schepmoes AA, Phillips LS, Smith RD, Metz TO. Proteomic profiling of nonenzymatically glycated proteins in human plasma and erythrocyte membranes. J Proteome Res. 2008;7(5):2025-2032. doi:10.1021/pr700763r.
27. Gabreanu GR, Angelescu S. Erythrocyte membrane in type 2 diabetes mellitus. Discoveries (Craiova). 2016;4(2):e60. doi:10.15190/d.2016.7.
28. Arita T, Maruyama T, Yokoyama T, Hieda M, Fukata M, Fujino T, Mawatari S, Akashi K. Impaired deformability and association with density distribution of erythrocytes in patients with type 2 diabetes mellitus under treatment. Clin Hemorheol Microcirc. 2020;76(1):73-83. doi:10.3233/CH-200873.
29. Wang Y, Yang P, Yan Z, Liu Z, Ma Q, Zhang Z, Wang Y, Su Y. The relationship between erythrocytes and diabetes mellitus. J Diabetes Res. 2021;2021:6656062. doi:10.1155/2021/6656062.
Bianchetti G, Cefalo CMA, Ferreri C, Sansone A, Vitale M, Serantoni C, et al. Erythrocyte membrane fluidity: a novel biomarker of residual cardiovascular risk in type 2 diabetes. Eur J Clin Invest. 2024;54(3):e14121. doi:10.1111/eci.14121.