Prevalence of Refractive Errors and Colour Vision Deficiency Among Industrial Workers in Raichur: A Cross-Sectional Study.
- Bylappanavara Girish , Fellow, Cornea and Refractive Surgery Department of Cornea and Refractive Surgery Minto Regional Institute of Ophthalmology, Bengaluru, Karnataka, India-
- Shruthi , Assistant Professor Department of Pathology Navodaya Medical College Hospital and Research Centre, Raichur, Karnataka, India
- Ramanna , Assistant Professor Department of Ophthalmology Raichur Institute of Medical Sciences, Raichur, Karnataka, India
Article Information:
Abstract:
Background: Refractive errors and colour vision deficiency (CVD) are important visual disorders that may adversely affect occupational performance and safety, particularly among industrial workers exposed to demanding visual tasks and workplace hazards. This study aimed to determine the prevalence and pattern of refractive errors and CVD among industrial workers in Raichur. Methods: This cross-sectional study included 580 industrial workers aged 18–40 years attending the Ophthalmology OPD of Raichur Institute of Medical Sciences, Raichur. Demographic characteristics, occupational profile, ocular symptoms, working hours, and workplace exposures were recorded. Visual acuity was assessed using a Snellen chart, refractive status was evaluated by retinoscopy followed by subjective correction, and colour vision was assessed using the 38-plate Ishihara chart. Data were analyzed using SPSS version 27.0. Results: Of 580 participants, 77.06% were male and 68.28% were from urban areas. The overall prevalence of refractive errors was 16.38%, with myopia being the most common (12.24%), followed by astigmatism (3.10%) and hypermetropia (1.03%). CVD was detected in 3.79% of participants. Eye strain (58.28%), headache (55.17%), excessive eye rubbing (40.86%), and watering (35.52%) were common ocular complaints. Dust exposure was reported by 70.86% of workers. Uncorrected 6/6 visual acuity was observed in 83.10% of right eyes and 84.31% of left eyes; after correction, this increased to 97.76% and 97.24%, respectively. Conclusion: Refractive errors and CVD represent relevant occupational health concerns among industrial workers. Periodic vision screening, timely refractive correction, colour vision assessment, and appropriate workplace eye-protection measures should be incorporated into occupational health programs.
Keywords:
Article :
INTRODUCTION:
Vision is one of the most important sensory functions and plays a fundamental role in an individual’s ability to perform occupational activities safely, efficiently, and accurately. Visual impairment can adversely affect work performance, productivity, and quality of life[1]. According to the World Health Organization (WHO), approximately 1.04 billion people worldwide require vision correction, of whom nearly 49% either lack appropriate correction or receive inadequate correction [2,3]. In a rapidly developing economy such as India, with a large industrial workforce, maintaining optimal visual health is particularly important. Visual disorders can contribute to absenteeism, reduced work efficiency, occupational errors, and decreased productivity, making workplace eye health an important public health concern [4].Regular ophthalmic assessment is essential for identifying visual abnormalities that may otherwise remain undetected. Adequate visual acuity and colour discrimination are particularly important in industrial occupations involving machinery operation, electrical work, identification of colour-coded signals, quality control, and other precision-based tasks [1,2].
Among the various ocular conditions affecting working populations, refractive errors and colour vision deficiency (CVD) are important because they may interfere with occupational performance and, in certain settings, compromise workplace safety [3–5].Refractive errors are among the most common causes of visual impairment worldwide and constitute a major cause of avoidable or treatable visual disability [6]. Uncorrected refractive errors are estimated to account for approximately 20% of blindness and nearly 50% of visual impairment globally [7,8]. In addition to impaired vision, uncorrected refractive errors may result in difficulty performing vision-dependent activities, reduced quality of life, and considerable socioeconomic burden [9,10]. The reported prevalence of refractive errors varies considerably across populations, ranging from approximately 6% to 45% [11]. Myopia alone affects more than 22% of the global population, with particularly high prevalence reported in East Asian populations (70–80%) compared with Western populations (25–40%).Colour vision deficiency is characterized by a reduced ability to distinguish certain colours or colour combinations [18]. It may be congenital or acquired, with congenital CVD occurring predominantly among males because of its commonly X-linked inheritance [12]. Although CVD may have limited impact on routine daily activities, it can have substantial occupational implications in jobs requiring accurate colour recognition. Many affected individuals remain unaware of their deficiency until detected during occupational or routine vision screening [13,14].
Despite the occupational relevance of these visual disorders, information regarding their burden among industrial workers in this region remains limited. Therefore, the present study was undertaken to determine the prevalence of refractive errors and colour vision deficiency among industrial workers in Raichur and to provide evidence that may support appropriate workplace vision screening and timely corrective interventions.
MATERIALS AND METHODS:
Study Design and Setting
A cross-sectional observational study was conducted among industrial workers attending the Ophthalmology Outpatient Department (OPD) of Raichur Institute of Medical Sciences (RIMS), Raichur. The study was designed to determine the prevalence of refractive errors and colour vision deficiency among industrial workers in Raichur.
Study Population
The study population comprised industrial workers aged 18–40 years from different industrial sectors in and around Raichur, including thermal power plants, chemical industries, rice mills, and rubber industries, who attended the Ophthalmology OPD of RIMS, Raichur during the study period.
Sampling Technique
A stratified random sampling method was employed to ensure adequate representation of workers from different industrial sectors. Eligible participants were recruited according to the predefined inclusion and exclusion criteria.
Sample Size
The sample size was calculated based on the previously reported prevalence of refractive errors of 15% among industrial workers . The sample size was calculated using the formula:
n = 4pq/e²
where:
n = required sample size
p = expected prevalence = 15% (0.15)
q = 1 − p = 85% (0.85)
e = allowable error/absolute precision = 3% (0.03)
Accordingly:
n = [4 × 0.15 × 0.85] / (0.03)² = 566.67
The minimum required sample size was therefore approximately 567 participants. To account for practical considerations and ensure an adequate sample, the final sample size was rounded to 580 participants.The prevalence used for sample size estimation was obtained from the study by Ahadi et al. [20], which evaluated refractive errors and colour vision deficiency among industrial workers in Abhar, Iran.
Inclusion Criteria
Participants were included if they:
· were industrial workers aged 18–40 years;
· were employed in one of the selected industrial sectors in and around Raichur; and
· attended the Ophthalmology OPD of RIMS, Raichur during the study period.
Exclusion Criteria
Participants were excluded if they:
· had a previous history of ocular surgery;
· had congenital anterior segment abnormalities; or
· were unwilling to participate in the study.
Data Collection
Data were collected using a structured proforma. Information regarding demographic characteristics, occupational profile, workplace environment, duration of employment, exposure to potentially hazardous materials, and history of visual problems was recorded for each participant.
All eligible participants subsequently underwent a comprehensive ophthalmological assessment with particular emphasis on visual acuity, refractive status, and colour vision.
Visual Acuity Assessment
Visual acuity was assessed using a standard Snellen visual acuity chart under appropriate illumination. Visual acuity was recorded separately for each eye according to the standard testing procedure.
Assessment of Refractive Error
Objective refraction was performed using a streak retinoscope following cycloplegia. The refractive status of each participant was determined based on the retinoscopic findings. Subjective refraction and appropriate refractive correction were performed after two days.Participants identified as having refractive errors were classified according to the type of refractive error, as applicable, including myopia, hypermetropia, and astigmatism.
Colour Vision Assessment
Colour vision was assessed using the 38-plate Ishihara colour vision test. Testing was performed under appropriate illumination according to the recommended testing procedure. Participants were instructed to identify the numbers or patterns displayed on the pseudoisochromatic plates. Their responses were recorded and interpreted according to the standard instructions provided with the Ishihara test. Participants with abnormal responses were categorized as having colour vision deficiency according to the test findings.
Outcome Measures
The primary outcome measures were the prevalence of refractive errors and the prevalence of colour vision deficiency among the study participants. The distribution of different types of refractive errors was also evaluated. Associations of refractive errors and colour vision deficiency with relevant demographic and occupational characteristics were assessed.
Data Processing and Statistical Analysis
The collected data were checked for completeness, consistency, and accuracy before analysis. Data were coded and entered into a computerized database and analyzed using IBM SPSS Statistics version 27.0.Continuous variables were summarized using mean and standard deviation or median and interquartile range, as appropriate. Categorical variables were expressed as frequencies and percentages. The prevalence of refractive errors and colour vision deficiency was calculated as the proportion of affected participants among the total study population.The chi-square test or Fisher’s exact test, wherever appropriate, was used to assess associations between categorical variables, including refractive errors and colour vision deficiency, and demographic or occupational characteristics. A p-value <0.05 was considered statistically significant.
Ethical Considerations
The study was conducted in accordance with accepted ethical principles and after obtaining approval from the Institutional Ethics Committee of Raichur Institute of Medical Sciences (RIMS), Raichur. Written informed consent was obtained from all participants before enrolment in the study.Confidentiality and anonymity of the participants were maintained throughout the study. Each participant was assigned a unique identification code, and all study-related information was stored securely and used exclusively for research purposes.
RESULTS:
A total of 580 industrial workers were included in the study. The baseline demographic and occupational characteristics of the study participants are presented in Table 1. Of the total participants, 447 (77.06%) were male and 133 (22.94%) were female. Most participants were from urban areas (68.28%), while 31.72% were from rural areas. Laborers constituted the largest occupational group (43.62%), followed by mechanics (10.35%), civil engineers (9.48%), electricians (9.48%), typists (7.42%), and contractors (5.69%).
The distribution of ocular symptoms is shown in Table 2 and Figure 1. Eye strain was the most common ocular complaint, reported by 338 (58.28%) participants, followed by headache in 320 (55.17%) and excessive eye rubbing in 237 (40.86%). Watering was reported by 206 (35.52%) participants, while 180 (31.03%) reported near-work activity. Blurring of vision was present in 117 (20.18%) participants. Itching and eye discharge were comparatively less common, being reported by 16.03% and 13.10% of participants, respectively.
Occupational characteristics and workplace exposures are summarized in Table 3. The largest proportion of participants, 223 (38.45%), worked for up to 12 hours per day, while 161 (27.76%) worked for up to 10 hours. Dust exposure was the most frequently reported workplace exposure, affecting 411 (70.86%) participants, followed by exposure to vibrating objects in 219 (37.76%) and heat in 156 (26.90%). Radiation and toxic chemical exposure were reported by 12.24% and 11.21% of participants, respectively. Workplace illumination was rated as good by 445 (76.72%) participants. A previous history of ocular trauma was uncommon, with 571 (98.45%) participants reporting no previous ocular trauma.
The distribution of uncorrected visual acuity in both eyes is presented in Table 4 and Figure 2. In the right eye, 482 (83.10%) participants had uncorrected visual acuity of 6/6, while 489 (84.31%) had 6/6 visual acuity in the left eye. Reduced visual acuity of varying severity was observed in the remaining participants. Counting-finger vision at 1–6 m was observed in 4 (0.69%) right eyes and 5 (0.86%) left eyes.
Best-corrected visual acuity and colour vision status are shown in Table 5. Following refractive correction, 567 (97.76%) participants achieved 6/6 visual acuity in the right eye and 564 (97.24%) in the left eye. Only a small proportion continued to have visual acuity below 6/6 after correction. Colour vision was normal in 558 (96.21%) participants, whereas colour vision deficiency was detected in 22 participants, corresponding to a prevalence of 3.79%.
The prevalence and pattern of refractive errors are presented in Table 6 and Figure 3. Of the 580 participants, 485 (83.62%) were emmetropic, while 95 (16.38%) had some form of refractive error. Myopia was the most common refractive error, affecting 71 (12.24%) participants. Among participants with myopia, 60 (10.34% of the total study population) had myopia between 0 and −2.00 D, 10 (1.72%) had myopia greater than −2.00 to −5.00 D, and 1 (0.17%) had myopia greater than −5.00 D. Hypermetropia was present in 6 (1.03%) participants, while astigmatism was detected in 18 (3.10%). Myopic astigmatism was the most common type of astigmatism, observed in 15 (2.59%) participants, followed by mixed astigmatism in 2 (0.34%) and hypermetropic astigmatism in 1 (0.17%). Overall, the prevalence of refractive errors was 16.38%, while the prevalence of colour vision deficiency was 3.79%.
Table 1. Baseline demographic and occupational characteristics of study participants (N=580)
|
Characteristic |
Frequency (n) |
Percentage (%) |
|
Sex |
||
|
Male |
447 |
77.06 |
|
Female |
133 |
22.94 |
|
Residence |
||
|
Rural |
184 |
31.72 |
|
Urban |
396 |
68.28 |
|
Major occupational categories |
||
|
Laborer |
253 |
43.62 |
|
Mechanic |
60 |
10.35 |
|
Civil engineer |
55 |
9.48 |
|
Electrician |
55 |
9.48 |
|
Typist |
43 |
7.42 |
|
Contractor |
33 |
5.69 |
|
Graphic designer |
19 |
3.28 |
|
Plumber |
17 |
2.93 |
|
Cleaner |
15 |
2.59 |
|
Engineer |
12 |
2.07 |
|
Computer engineer |
6 |
1.03 |
|
Other occupations* |
12 |
2.07 |
Table 2. Distribution of ocular symptoms among study participants (N=580)
|
Ocular symptom |
Present, n (%) |
Absent, n (%) |
|
Blurring of vision |
117 (20.18) |
463 (79.82) |
|
Excessive eye rubbing |
237 (40.86) |
343 (59.14) |
|
Headache |
320 (55.17) |
260 (44.83) |
|
Watering |
206 (35.52) |
374 (64.48) |
|
Eye strain |
338 (58.28) |
242 (41.72) |
|
Eye discharge |
76 (13.10) |
504 (86.90) |
|
Itching |
93 (16.03) |
487 (83.97) |
|
Near-work activity |
180 (31.03) |
400 (68.97) |
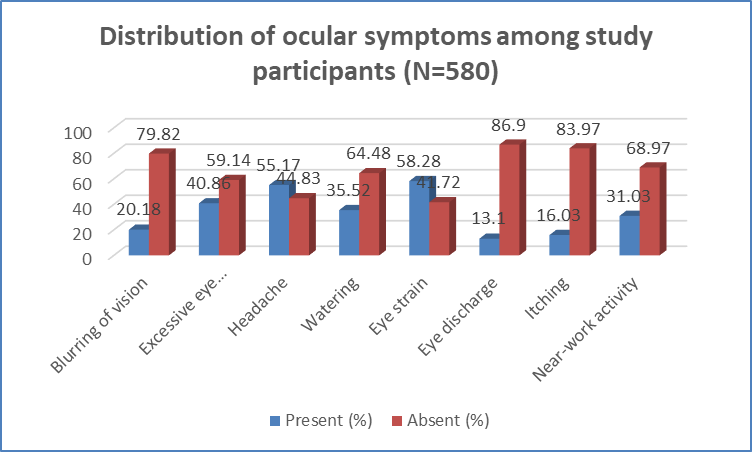
Figure 1 Distribution of ocular symptoms among study participants (N=580)
Table 3. Occupational characteristics and workplace exposures among study participants (N=580)
|
Variable |
Frequency (n) |
Percentage (%) |
|
Daily working hours |
||
|
Up to 6 hours |
39 |
6.72 |
|
Up to 8 hours |
116 |
20.00 |
|
Up to 10 hours |
161 |
27.76 |
|
Up to 12 hours |
223 |
38.45 |
|
Up to 14 hours |
41 |
7.07 |
|
Occupational exposure |
||
|
Heat |
156 |
26.90 |
|
Radiation |
71 |
12.24 |
|
Toxic chemicals |
65 |
11.21 |
|
Dust |
411 |
70.86 |
|
Vibrating objects |
219 |
37.76 |
|
Workplace illumination |
||
|
Best |
50 |
8.62 |
|
Good |
445 |
76.72 |
|
Average |
68 |
11.72 |
|
Poor |
15 |
2.59 |
|
Very poor |
2 |
0.34 |
|
Past ocular trauma |
||
|
No trauma |
571 |
98.45 |
|
Left-eye trauma |
7 |
1.21 |
|
Right-eye trauma |
2 |
0.34 |
Table 4. Uncorrected visual acuity in the right and left eyes (N=580)
|
Visual acuity |
Right eye, n (%) |
Left eye, n (%) |
|
6/6 |
482 (83.10) |
489 (84.31) |
|
6/9 |
20 (3.45) |
22 (3.79) |
|
6/12 |
31 (5.35) |
34 (5.86) |
|
6/18 |
17 (2.93) |
6 (1.03) |
|
6/24 |
8 (1.38) |
6 (1.03) |
|
6/36 |
14 (2.41) |
7 (1.21) |
|
6/60 |
4 (0.69) |
11 (1.90) |
|
Counting fingers, 1–6 m |
4 (0.69) |
5 (0.86) |
|
Total |
580 (100) |
580 (100) |
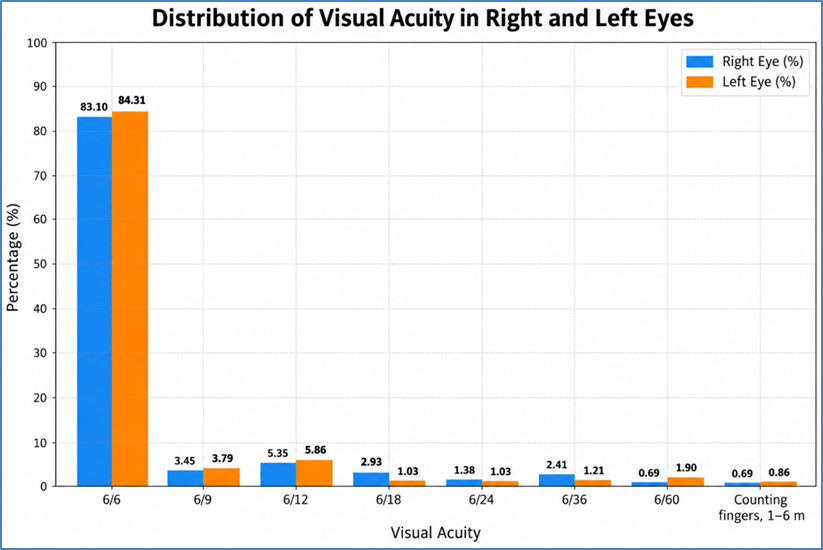
Figure 2 Uncorrected visual acuity in the right and left eyes (N=580)
Table 5. Best-corrected visual acuity and colour vision status among study participants (N=580)
|
Parameter |
Right eye, n (%) |
Left eye, n (%) |
|
Best-corrected visual acuity |
||
|
6/6 |
567 (97.76) |
564 (97.24) |
|
6/9 |
11 (1.90) |
10 (1.72) |
|
6/12 |
1 (0.17) |
5 (0.86) |
|
6/24 |
1 (0.17) |
1 (0.17) |
|
Colour vision status |
Frequency (n) |
Percentage (%) |
|
Normal colour vision |
558 |
96.21 |
|
Colour vision deficiency |
22 |
3.79 |
|
Total |
580 |
100 |
Table 6. Prevalence and pattern of refractive errors among study participants (N=580)
|
Refractive status |
Frequency (n) |
Percentage (%) |
|
Emmetropia |
485 |
83.62 |
|
Myopia |
71 |
12.24 |
|
Myopia 0 to −2.00 D |
60 |
10.34 |
|
Myopia >−2.00 to −5.00 D |
10 |
1.72 |
|
Myopia >−5.00 D |
1 |
0.17 |
|
Hypermetropia |
6 |
1.03 |
|
Astigmatism |
18 |
3.10 |
|
Myopic astigmatism |
15 |
2.59 |
|
Hypermetropic astigmatism |
1 |
0.17 |
|
Mixed astigmatism |
2 |
0.34 |
|
Any refractive error |
95 |
16.38 |
|
Total |
580 |
100 |
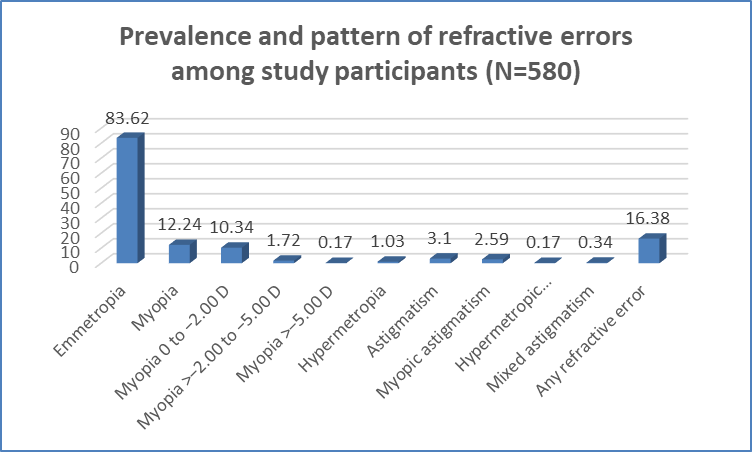
Figure 3 Prevalence and pattern of refractive errors among study participants (N=580)
DISCUSSION:
The present cross-sectional study evaluated refractive errors, colour vision deficiency (CVD), ocular symptoms, visual acuity, and occupational exposures among 580 industrial workers in Raichur. The study population was predominantly male (77.06%), and 68.28% were from urban areas. Laborers constituted the largest occupational group (43.62%), followed by mechanics (10.35%), civil engineers (9.48%), and electricians (9.48%). The overall prevalence of refractive errors was 16.38%, while CVD was detected in 3.79% of participants.Myopia was the most common refractive error in the present study, affecting 12.24% of participants, followed by astigmatism in 3.10% and hypermetropia in 1.03%. Among those with myopia, 10.34% of the total population had myopia between 0 and −2.00 D, 1.72% had myopia between >−2.00 and −5.00 D, and only 0.17% had myopia greater than −5.00 D. These findings indicate that low myopia constituted the major proportion of refractive error in the study population. Nangia et al.[15] reported a myopia prevalence of 10.8% among adults aged 30 years and above in Central India , which was comparable to the 12.24% observed in the present study. In contrast, Murthy et al.[16] reported a higher prevalence of myopia of 19.7% among urban school children in Delhi , while Dandona et al.[17] reported refractive errors in 45.8% of an urban population in Andhra Pradesh .
Differences in age distribution, occupational profile, study setting, and refractive error definitions may explain these variations. Studies from Iran have similarly demonstrated a substantial burden of refractive errors, with myopia being commonly reported among adults.Colour vision deficiency was present in 22 participants, giving a prevalence of 3.79%. This was within the global range of approximately 1.4%–13.93% reported in a systematic review and meta-analysis. Krishnamurthy et al.[18] reported a CVD prevalence of 2.76% among school-going boys in South India, which was slightly lower than that observed in the present study. Similarly, Kundu and Chakma reported an overall CVD prevalence of 2.98%, including 3.89% among males and 0.18% among females in an Indian pre-employment screening population. These findings are broadly comparable with our prevalence of 3.79%. International data have also demonstrated considerable variation in CVD prevalence; approximately 8% of males and 0.5% of females have been reported to have some form of CVD in the United States. Socioeconomic and population-related differences have also been observed, with Machluf et al.[19] reporting CVD prevalence rates of 5.10% and 6.73% in lower and higher socioeconomic groups, respectively.Ocular symptoms were common among the industrial workers. Eye strain was reported by 58.28% of participants, headache by 55.17%, excessive eye rubbing by 40.86%, watering by 35.52%, and blurring of vision by 20.18%. These findings suggest a considerable burden of ocular discomfort in this occupational population. Occupational studies have shown that industrial workers frequently experience visual strain and related ocular symptoms due to prolonged working hours and adverse environmental conditions.
Dust exposure was particularly common in the present study, affecting 70.86% of participants, while 37.76% reported exposure to vibrating objects, 26.90% to heat, 12.24% to radiation, and 11.21% to toxic chemicals. Similar studies have emphasized that exposure to dust, chemicals, inadequate workplace environments, and other industrial hazards can contribute to ocular irritation and visual discomfort [66–71]. Despite these exposures, 76.72% of participants rated workplace illumination as good.Uncorrected visual acuity of 6/6 was present in 83.10% of right eyes and 84.31% of left eyes. Following refractive correction, 97.76% of right eyes and 97.24% of left eyes achieved 6/6 vision, demonstrating that most visual impairment was correctable. These findings emphasize the importance of periodic workplace vision screening, timely refractive correction, and assessment of colour vision, particularly in occupations requiring accurate visual judgment and colour discrimination.
CONCLUSION:
The present study demonstrated a considerable burden of visual problems among industrial workers, with an overall prevalence of refractive errors of 16.38% and colour vision deficiency of 3.79%. Myopia was the most common refractive error (12.24%), while eye strain and headache were the predominant ocular symptoms. Most participants achieved 6/6 vision following refractive correction, indicating that a substantial proportion of visual impairment was correctable. High exposure to occupational hazards, particularly dust, further emphasizes the need for regular workplace eye screening, timely refractive correction, appropriate protective measures, and colour vision assessment to improve visual health and occupational safety.
LIMITATIONS
The cross-sectional design of the study limited the ability to establish causal relationships between occupational exposures and ocular abnormalities. As the study was conducted among industrial workers attending a single tertiary care centre, the findings may not be generalizable to all industrial workers. Some occupational exposures and ocular symptoms were self-reported, introducing the possibility of recall and reporting bias. Additionally, long-term follow-up to assess the progression of refractive errors and occupational visual problems was not performed.
REFERENCES:
1. World Health Organization. Global data on visual impairments 2010. Geneva: World Health Organization; 2012.
2. Holden BA, Fricke TR, Wilson DA, Jong M, Naidoo KS, Sankaridurg P, et al. Global prevalence of myopia and high myopia and temporal trends from 2000 through 2050. Ophthalmology. 2016;123(5):1036-1042.
3. Bourne RR, Stevens GA, White RA, Smith JL, Flaxman SR, Price H, et al. Causes of vision loss worldwide, 1990-2010: a systematic analysis. Lancet Glob Health. 2013;1(6):e339-e349.
4. Fong CSL, Shum JWH, Ng ALK, Kwok AKH. Prevalence of undiagnosed visual impairment and its impact on quality of life among elderly residents in elderly homes. J Curr Ophthalmol. 2016;28(1):23-29.
5. Vitale S, Cotch MF, Sperduto RD. Prevalence of visual impairment in the United States. JAMA. 2006;295(18):2158-2163.
6. Resnikoff S, Pascolini D, Mariotti SP, Pokharel GP. Global magnitude of visual impairment caused by uncorrected refractive errors in 2004. Bull World Health Organ. 2008;86(1):63-70.
7. Naidoo KS, Leasher J, Bourne RR, Flaxman SR, Jonas JB, Keeffe J, et al. Global vision impairment and blindness due to uncorrected refractive error, 1990-2010. Optom Vis Sci. 2016;93(3):227-234.
8. Varma R, Vajaranant TS, Burkemper B, Wu S, Torres M, Hsu C, et al. Visual impairment and blindness in adults in the United States: demographic and geographic variations from 2015 to 2050. JAMA Ophthalmol. 2016;134(7):802-809.
9. Williams KM, Bertelsen G, Cumberland P, Wolfram C, Verhoeven VJM, Anastasopoulos E, et al. Increasing prevalence of myopia in Europe and the impact of education. Ophthalmology. 2015;122(7):1489-1497.
10. Pan CW, Ramamurthy D, Saw SM. Worldwide prevalence and risk factors for myopia. Ophthalmic Physiol Opt. 2012;32(1):3-16.
11. Dandona R, Dandona L. Refractive error blindness. Bull World Health Organ. 2001;79(3):237-243.
12. Holden BA, Fricke TR, Ho SM, Wong R, Schlenther G, Cronjé S, et al. Global vision impairment due to uncorrected presbyopia. Arch Ophthalmol. 2008;126(12):1731-1739.
13. Wong TY, Ferreira A, Hughes R, Carter G, Mitchell P. Epidemiology and disease burden of pathologic myopia and myopic choroidal neovascularization: an evidence-based systematic review. Am J Ophthalmol. 2014;157(1):9-25.e12.
14. Ibironke JO, Friedman DS, Repka MX, Katz J, Giordano L, Ibironke J, et al. Prevalence of myopia and hyperopia among children aged 6 to 72 months. JAMA Ophthalmol. 2017;135(6):552-557.
15. Nangia V, Jonas JB, Sinha A, Matin A, Kulkarni M. Refractive error in central India: the Central India Eye and Medical Study. Ophthalmology. 2013;120(8):1512-1519.
16. Murthy GV, Gupta SK, Ellwein LB, Muñoz SR, Pokharel GP, Sanga L, et al. Refractive error in children in an urban population in New Delhi. Invest Ophthalmol Vis Sci. 2002;43(3):623-631.
17. Dandona R, Dandona L, Srinivas M, Sahare P, Narsaiah S, Muñoz SR, et al. Refractive error in children in a rural population in India. Invest Ophthalmol Vis Sci. 2002;43(3):615-622.
18. Krishnamurthy SS, Rangavittal S, Chandrasekar A, Narayanan A. Prevalence of color vision deficiency among school-going boys in South India. Indian J Ophthalmol. 2021;69(8):2021-2025.
19. Machluf Y, Allon G, Sebbag A, Chaiter Y, Mezer E. A large population study reveals a novel association between congenital color vision deficiency and environmental factors. Graefes Arch Clin Exp Ophthalmol. 2022;260(4):1289-1297.