Visual Evoked Potentials as a Neurophysiological Marker of Early Microvascular and Neurological Complications in Patients with Diabetes Mellitus.
- Debasish Hota , Consultant Interventional Neurologist, Department of Neurology, Hi-Tech Medical College & Hospital, Bhubaneswar, Odisha, India.
- Gurupada Das , Assistant Professor, Department of General Medicine, Hi-Tech Medical College, Bhubaneswar, Odisha, India.
- Ranjan Kumar Mohanty , Associate Professor, Department of Neurology, SUM Hospital, Bhubaneswar, Odisha, India.
Article Information:
Abstract:
Background: Diabetes mellitus (DM) is a systemic metabolic disorder in which sub-clinical damage to the visual pathway and other neural structures can precede overt microvascular complications. Pattern-reversal visual evoked potential (VEP) is a sensitive, non-invasive test of central visual conduction that may detect this damage at an early, potentially reversible stage. Objectives: To evaluate the association between VEP abnormalities and the profile of glycaemic control, diabetes duration, retinopathy, nephropathy and peripheral neuropathy in adult patients with type 2 DM. Methods: A hospital-based comparative cross-sectional study of 100 patients with type 2 DM was carried out. Based on P100 latency, patients were classified into Group P — those with abnormal VEP (P100 latency > 110 ms; n = 50) — and Group S — those with normal VEP (n = 50). All subjects underwent standardised pattern-reversal VEP, biochemical assessment (FBS, PPBS, HbA1c), fundus examination, urinary albumin excretion (UAE), serum creatinine, estimated glomerular filtration rate (eGFR) and clinical plus electrophysiological screening for diabetic peripheral neuropathy. Results: Group P had significantly longer duration of DM (14.5 ± 4.2 vs 6.4 ± 2.4 years, p < 0.001) and higher HbA1c (8.21 ± 1.54 % vs 7.33 ± 0.36 %, p < 0.001). Mean P100 latency was significantly prolonged in Group P for both eyes (left 116.5 ± 5.8 vs 104.5 ± 3.6 ms; right 114.8 ± 5.3 vs 102.6 ± 4.1 ms; both p < 0.001) and N75–P100 amplitudes were reduced. Diabetic retinopathy of any stage was seen in 90 % of Group P vs 48 % of Group S (p < 0.001); severe non-proliferative and proliferative retinopathy occurred only in Group P. Overt nephropathy and diabetic kidney failure were also confined to Group P. Peripheral neuropathy was present in 88 % of Group P vs 54 % of Group S (p < 0.001). In the pooled cohort P100 latency correlated positively with duration of DM (r = +0.61, p < 0.001), retinopathy stage (r = +0.43, p < 0.001) and neuropathy grade (r = +0.34, p < 0.001), while N75–P100 amplitude correlated inversely with HbA1c (r = −0.42, p < 0.001). Conclusion: Prolonged P100 latency and reduced N75–P100 amplitude in patients with type 2 DM identify a subgroup with poor glycaemic control, longer disease duration and a substantially greater burden of retinopathy, nephropathy and peripheral neuropathy. Pattern-reversal VEP is a simple, objective and inexpensive tool that can be incorporated into the routine screening of patients with diabetes to detect early neuro-microvascular injury.
Keywords:
Article :
INTRODUCTION:
Diabetes mellitus (DM) has emerged as one of the largest global non-communicable disease burdens of the twenty-first century, with an estimated 537 million adults affected worldwide in 2021 and a projected rise to 783 million by 2045.1 India alone accounts for over 101 million individuals with diabetes and more than 130 million with pre-diabetes according to the ICMR–INDIAB study, making the country an epicentre of the diabetes epidemic.2 The clinical burden of DM is driven less by hyperglycaemia itself than by its chronic micro- and macrovascular complications, which contribute to the majority of morbidity, mortality and healthcare expenditure attributable to the disease.3,4
Diabetic microangiopathy affects the retinal, glomerular and vasa-nervorum microcirculation in parallel, giving rise to the classical triad of retinopathy, nephropathy and peripheral neuropathy. However, damage to neural tissue in diabetes is not restricted to the peripheral nervous system. Structural and functional abnormalities of the central nervous system, including the optic pathway, have been demonstrated in patients with both type 1 and type 2 DM even before any clinically recognised complication is apparent.5,6 This early central involvement — sometimes referred to as diabetic encephalopathy or diabetic optic neuropathy — is thought to arise from a combination of chronic hyperglycaemia, oxidative stress, advanced glycation end-product formation, polyol pathway activation and microvascular endothelial dysfunction along the pre-geniculate and retro-geniculate visual pathway.7,8
Pattern-reversal visual evoked potential (VEP) is a well-established, non-invasive electrophysiological technique that assesses the integrity of the visual pathway from the retina to the primary visual cortex. Its major landmark, the P100 wave, has an inter-subject latency variability of only a few milliseconds and is reproducible across sessions, which makes it a robust marker for detecting demyelination and axonal loss along the anterior visual pathway.9,10 In diabetes, several investigators have shown that P100 latency is prolonged and the N75–P100 amplitude reduced even in patients without ophthalmoscopically detectable retinopathy, suggesting that VEP can detect sub-clinical central nervous injury before capillary-level structural damage becomes visible.11–14
Despite this potential, VEP has not yet been incorporated into routine screening protocols for patients with DM, and its correlation with the wider profile of microvascular complications — particularly nephropathy and peripheral neuropathy — remains inconsistently characterised in the Indian population. Understanding whether a prolonged P100 latency identifies the diabetic patient with a broader burden of end-organ damage would be clinically useful, because it could offer a single bedside test to flag patients who need aggressive glycaemic optimisation and more intensive complication screening.15
The present study was therefore undertaken to compare demographic, glycaemic, retinal, renal and neurological parameters between patients with type 2 DM who had abnormal VEP and those with normal VEP, and to explore the correlation between VEP parameters and the severity of microvascular and neurological complications.
MATERIALS AND METHODS:
Study design and setting
This hospital-based, comparative, cross-sectional analytical study was conducted in the Department of Physiology in collaboration with the Departments of Medicine, Ophthalmology and Nephrology of a tertiary-care teaching hospital. The study was carried out over a period of eighteen months. Ethical clearance was obtained from the Institutional Ethics Committee, and written informed consent was obtained from every participant prior to enrolment. All procedures conformed to the principles of the Declaration of Helsinki (2013 revision).16
Study population
One hundred adult patients (aged 30–70 years) with an established diagnosis of type 2 DM according to the American Diabetes Association 2020 criteria were enrolled by consecutive sampling from the diabetes outpatient clinic.17 Based on the result of pattern-reversal VEP, participants were prospectively classified into two groups:
· Group P (n = 50): Patients with abnormal VEP, defined as P100 latency > 110 ms in either eye.
· Group S (n = 50): Patients with normal VEP (P100 latency ≤ 110 ms in both eyes).
Patients with any of the following were excluded: ophthalmological conditions likely to influence the VEP independently of diabetes (glaucoma, cataract of grade > 2, uncorrected refractive error greater than ±6 D, previous ocular surgery, macular degeneration), pre-existing neurological disease (stroke, multiple sclerosis, optic neuritis, Parkinson's disease, epilepsy), thyroid dysfunction, vitamin B12 deficiency, chronic alcoholism, chronic kidney disease requiring dialysis, pregnancy and any current use of neurotropic medication.
Clinical and biochemical assessment
A detailed history was recorded, including duration of diabetes, current pharmacotherapy, sensory or motor symptoms and visual complaints. Anthropometry (height, weight, body mass index) and vital signs were measured. Fasting blood sugar (FBS), post-prandial blood sugar (PPBS) and glycated haemoglobin (HbA1c) were estimated by hexokinase and high-performance liquid chromatography, respectively. Glycaemic control was classified as good (HbA1c < 7 %), fair (7–8 %) or poor (> 8 %).17
Assessment of microvascular complications
Dilated fundoscopy was performed by an ophthalmologist and diabetic retinopathy was graded according to the International Clinical Diabetic Retinopathy Disease Severity Scale into: no apparent retinopathy, mild non-proliferative diabetic retinopathy (NPDR), moderate NPDR, severe NPDR and proliferative diabetic retinopathy (PDR).18 Diabetic nephropathy was assessed by measurement of the urinary albumin-to-creatinine ratio (UAE, mg/g), serum creatinine and the estimated glomerular filtration rate (eGFR, calculated by the CKD-EPI equation) and staged from prenephropathy (stage 1) to overt nephropathy or kidney failure (stages 3–4) using the classification of Haneda et al.19 Diabetic peripheral neuropathy was screened clinically (10 g monofilament, vibration perception, tendon reflexes and muscle power) and electrophysiologically by motor and sensory nerve conduction studies of the median, ulnar, common peroneal and sural nerves. Neuropathy was graded on a five-point scale (0 = no abnormality; 1 = electrophysiological abnormality alone; 2 = plus clinical sign without symptom; 3 = clinical sign with symptom; 4 = motor weakness of ankle dorsiflexion) modified from the Dyck staging system.20
Visual evoked potential recording
Pattern-reversal VEP was recorded in a quiet, dimly-lit, electrically-shielded room using a standard evoked-potential system in accordance with the International Society for Clinical Electrophysiology of Vision (ISCEV) recommendations.21 A black-and-white checkerboard pattern subtending a visual angle of 30 min of arc, with 98 % contrast and reversal frequency of 2 Hz, was displayed on a monitor placed one metre in front of the seated participant. Best-corrected refractive correction was worn where required. Silver–silver chloride disc electrodes were placed on the scalp with impedances kept below 5 kΩ. The active electrode was placed at Oz, the reference at Fz and the ground at Cz according to the international 10–20 system. Each eye was tested monocularly with the contralateral eye occluded; signals were amplified (band-pass 1–100 Hz) and averaged over at least 100 sweeps, with each recording repeated to confirm reproducibility. N75, P100 and N145 latencies (in milliseconds) and N75–P100 amplitude (in microvolts) were measured. A P100 latency exceeding 110 ms was considered abnormal, based on established local laboratory reference values consistent with published data.11,21
Statistical analysis
Data were entered in Microsoft Excel and analysed using SPSS software (version 26.0, IBM Corp., Armonk, NY, USA). Continuous variables are expressed as mean ± standard deviation and categorical variables as absolute numbers and percentages. Between-group comparisons of continuous variables were made using the independent samples Student t-test with Welch's correction, and categorical variables were compared using the Pearson chi-square test or Fisher's exact test as appropriate. Correlations between VEP parameters and clinical variables were quantified using the Pearson correlation coefficient. A two-tailed p value < 0.05 was considered statistically significant.
RESULTS:
Baseline demographic and clinical characteristics
The two groups were well-matched for age (54.9 ± 9.5 years in Group P vs 51.8 ± 9.8 years in Group S; p = 0.116), gender distribution (24 M / 26 F in both groups; p = 1.00) and body mass index (27.6 ± 3.1 vs 26.7 ± 3.4 kg/m2; p = 0.161). However, Group P had a significantly longer duration of diabetes (14.5 ± 4.2 vs 6.4 ± 2.4 years; p < 0.001) and significantly higher HbA1c (8.21 ± 1.54 % vs 7.33 ± 0.36 %; p < 0.001) and PPBS (253.3 ± 56.4 vs 223.6 ± 54.3 mg/dL; p = 0.009). Detailed comparisons are shown in Table 1.
Table 1. Baseline demographic, anthropometric and glycaemic parameters of the study groups.
|
Parameter |
Group P (abnormal VEP), n = 50 |
Group S (normal VEP), n = 50 |
p value |
|
Age (years) |
54.90 ± 9.48 |
51.84 ± 9.83 |
0.116 |
|
Sex (Male / Female) |
24 / 26 |
24 / 26 |
1.000 |
|
BMI (kg/m²) |
27.58 ± 3.08 |
26.66 ± 3.43 |
0.161 |
|
Duration of DM (years) |
14.46 ± 4.17 |
6.36 ± 2.38 |
< 0.001* |
|
FBS (mg/dL) |
167.64 ± 40.69 |
161.44 ± 55.85 |
0.527 |
|
PPBS (mg/dL) |
253.26 ± 56.38 |
223.56 ± 54.32 |
0.009* |
|
HbA1c (%) |
8.21 ± 1.54 |
7.33 ± 0.36 |
< 0.001* |
Values are mean ± standard deviation unless otherwise stated. *Statistically significant (p < 0.05); FBS = fasting blood sugar; PPBS = post-prandial blood sugar; HbA1c = glycated haemoglobin.
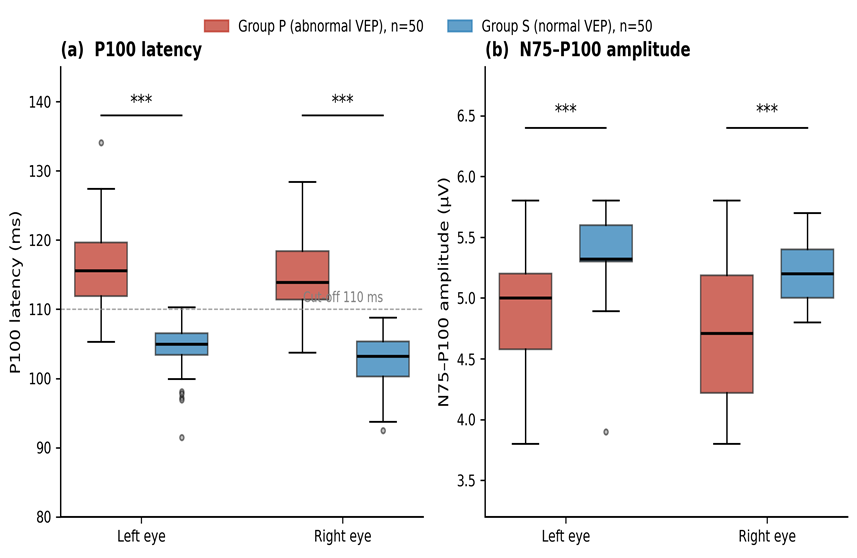
Figure 1. Distribution of (a) glycaemic control by HbA1c category and (b) duration of diabetes mellitus in the two study groups. Values on top of the bars represent the percentage of patients within each group.
Visual evoked potential parameters
By definition, mean P100 latency was longer in Group P than in Group S, but the magnitude of the difference — approximately 12 ms in both eyes — was substantially greater than the pre-defined 110 ms cut-off, indicating that Group P as a whole was well beyond the borderline of abnormality. Left eye P100 latency was 116.5 ± 5.8 ms in Group P versus 104.5 ± 3.6 ms in Group S, and right eye P100 latency was 114.8 ± 5.3 versus 102.6 ± 4.1 ms (both p < 0.001). Mean N75–P100 amplitude was significantly reduced in Group P (left eye 4.90 ± 0.47 µV vs 5.36 ± 0.31 µV, p < 0.001; right eye 4.71 ± 0.52 µV vs 5.22 ± 0.19 µV, p < 0.001). N75 latency did not differ significantly between groups (Table 2, Figure 2).
Table 2. Visual evoked potential parameters of the study groups.
|
VEP parameter |
Group P (n = 50) |
Group S (n = 50) |
p value |
|
Left N75 latency (ms) |
74.39 ± 7.86 |
71.89 ± 5.80 |
0.073 |
|
Left P100 latency (ms) |
116.46 ± 5.82 |
104.54 ± 3.58 |
< 0.001* |
|
Left N75–P100 amplitude (µV) |
4.90 ± 0.47 |
5.36 ± 0.31 |
< 0.001* |
|
Right N75 latency (ms) |
74.76 ± 9.06 |
72.29 ± 4.97 |
0.096 |
|
Right P100 latency (ms) |
114.82 ± 5.31 |
102.56 ± 4.08 |
< 0.001* |
|
Right N75–P100 amplitude (µV) |
4.71 ± 0.52 |
5.22 ± 0.19 |
< 0.001* |
Values are mean ± standard deviation. *Statistically significant (p < 0.05).
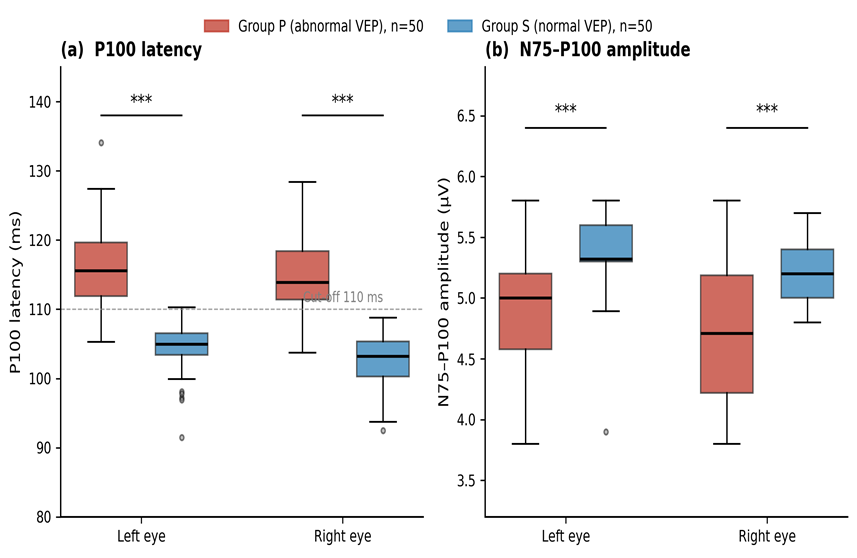
Figure 2. Box-and-whisker plots comparing (a) P100 latency and (b) N75–P100 amplitude between Group P (abnormal VEP) and Group S (normal VEP) for both eyes. The dashed horizontal line in panel (a) shows the 110 ms cut-off. Boxes represent the inter-quartile range with the median line; whiskers indicate 1.5 × IQR; *** p < 0.001.
Distribution of microvascular and neurological complications
Diabetic retinopathy of any severity was present in 45 (90 %) of patients in Group P as compared with 24 (48 %) in Group S (χ² = 18.70; p < 0.001). More importantly, the distribution of retinopathy shifted sharply toward the more severe end of the spectrum in Group P: severe NPDR (18 %) and PDR (8 %) occurred exclusively in Group P, whereas 52 % of Group S patients had no ophthalmoscopically detectable retinopathy at all.
Renal function was significantly poorer in Group P. Mean urinary albumin excretion was 245.2 ± 331.3 mg/g in Group P versus 135.4 ± 78.2 mg/g in Group S (p = 0.027), mean serum creatinine was 1.24 ± 0.34 vs 1.10 ± 0.21 mg/dL (p = 0.013), and mean eGFR was 63.3 ± 20.1 vs 71.0 ± 18.2 mL/min/1.73 m² (p = 0.046). Overt nephropathy (14 %) and diabetic kidney failure (2 %) were seen only in patients with abnormal VEP.
Peripheral neuropathy was found in 44 patients (88 %) in Group P and 27 (54 %) in Group S (χ² = 12.43; p < 0.001). Neurophysiologically confirmed abnormality on nerve conduction studies was present in 86 % of Group P compared with 54 % of Group S (p = 0.001). The proportion of patients with the more disabling grade 3 and grade 4 neuropathy was 64 % in Group P versus 22 % in Group S. Detailed distributions are summarised in Table 3 and shown graphically in Figure 3.
Table 3. Distribution of microvascular and neurological complications in the study groups.
|
Parameter |
Group P, n (%) |
Group S, n (%) |
p value |
|
Retinopathy — No DR |
5 (10) |
26 (52) |
|
|
Retinopathy — Mild NPDR |
14 (28) |
16 (32) |
|
|
Retinopathy — Moderate NPDR |
18 (36) |
8 (16) |
|
|
Retinopathy — Severe NPDR |
9 (18) |
0 (0) |
|
|
Retinopathy — PDR |
4 (8) |
0 (0) |
< 0.001* |
|
Nephropathy — Stage 1 (Pre) |
7 (14) |
2 (4) |
|
|
Nephropathy — Stage 2 (Incipient) |
35 (70) |
48 (96) |
|
|
Nephropathy — Stage 3 (Overt) |
7 (14) |
0 (0) |
|
|
Nephropathy — Stage 4 (Kidney failure) |
1 (2) |
0 (0) |
< 0.001* |
|
Neuropathy — Grade 0 (Normal) |
6 (12) |
22 (44) |
|
|
Neuropathy — Grade 1 |
5 (10) |
3 (6) |
|
|
Neuropathy — Grade 2 |
7 (14) |
13 (26) |
|
|
Neuropathy — Grade 3 |
28 (56) |
11 (22) |
|
|
Neuropathy — Grade 4 |
4 (8) |
0 (0) |
< 0.001* |
|
NCS abnormal |
43 (86) |
27 (54) |
0.001* |
p values obtained using chi-square test on the overall distribution for each complication. *Statistically significant. NPDR = non-proliferative diabetic retinopathy; PDR = proliferative diabetic retinopathy; NCS = nerve conduction study.
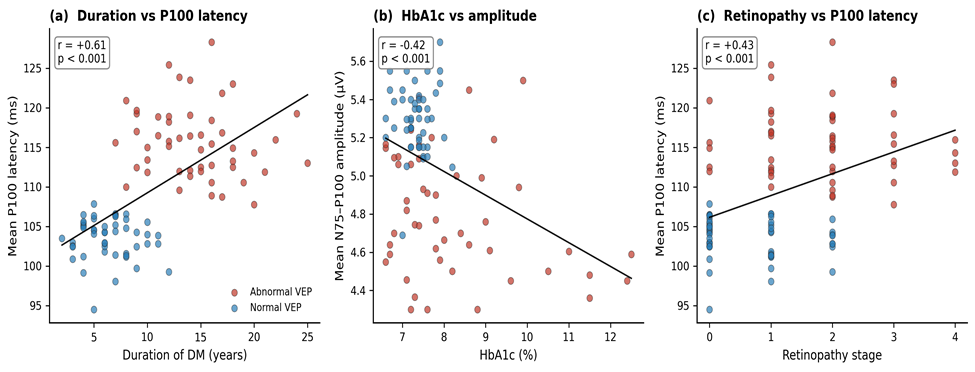
Figure 3. Distribution of microvascular and neurological complications between Group P (abnormal VEP) and Group S (normal VEP). (a) Diabetic retinopathy grade, (b) Diabetic nephropathy stage, and (c) Peripheral neuropathy grade. Numbers on the bars indicate percentages within each group. Advanced retinopathy (severe NPDR, PDR), overt/end-stage nephropathy, and grade 4 neuropathy were confined to Group P.
Correlation of VEP parameters with clinical variables
In the pooled cohort (n = 100) mean P100 latency correlated positively and strongly with duration of diabetes (r = +0.61, p < 0.001), and less strongly but significantly with HbA1c (r = +0.23, p = 0.023), post-prandial glucose (r = +0.28, p = 0.006), retinopathy stage (r = +0.43, p < 0.001) and neuropathy grade (r = +0.34, p < 0.001). Mean N75–P100 amplitude correlated inversely with duration of DM (r = −0.60, p < 0.001), HbA1c (r = −0.42, p < 0.001), retinopathy stage (r = −0.48, p < 0.001) and neuropathy grade (r = −0.39, p < 0.001). Selected relationships are illustrated in Figure 4.
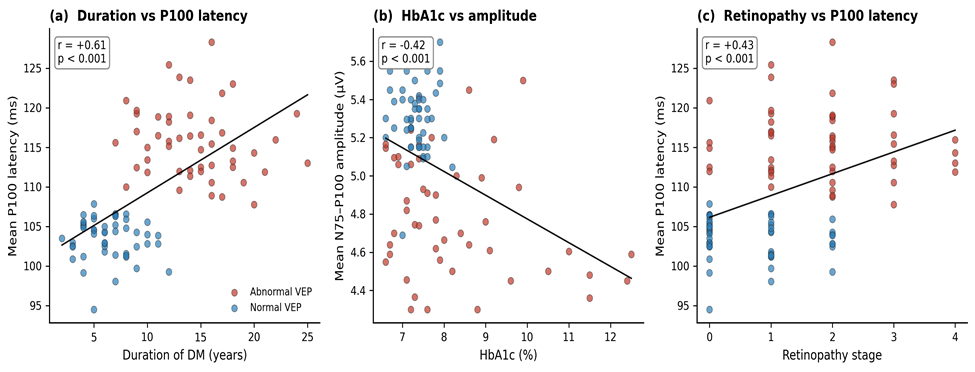
Figure 4. Scatter plots of the correlation of VEP parameters with clinical variables in the pooled cohort (n = 100). (a) Duration of diabetes vs mean P100 latency; (b) HbA1c vs mean N75–P100 amplitude; (c) Retinopathy stage vs mean P100 latency. Red dots represent Group P and blue dots Group S; the black line shows the linear regression trend.
Diagnostic performance of abnormal VEP
Considering the total cohort, abnormal VEP had a sensitivity of 65.2 % and specificity of 83.9 % for the presence of any diabetic retinopathy, with a positive predictive value of 90.0 %. For peripheral neuropathy the corresponding values were 62.0 % sensitivity, 79.3 % specificity and 88.0 % positive predictive value. For overt nephropathy, abnormal VEP identified 100 % of affected patients (sensitivity 100 %, negative predictive value 100 %) though at the cost of lower specificity (54.3 %). Poor glycaemic control (HbA1c > 8 %) was identified by abnormal VEP with a sensitivity of 95 % and negative predictive value of 98 %.
DISCUSSION:
The present study demonstrates three consistent findings in patients with type 2 diabetes mellitus. First, an abnormal pattern-reversal VEP — defined by a prolonged P100 latency — is closely associated with longer disease duration, poorer glycaemic control, higher retinopathy grade, worse renal function and a greater prevalence of clinically and electrophysiologically confirmed peripheral neuropathy. Second, both the latency and the amplitude of the P100 wave correlate in a dose-related manner with the burden of microvascular and neurological injury. Third, abnormal VEP retains a high positive predictive value for the presence of retinopathy and neuropathy and a very high negative predictive value for advanced complications, suggesting that it could serve as a low-cost, non-invasive first-line screening test in busy diabetes clinics.
The mean P100 latency in our Group P (approximately 116 ms in the left eye and 115 ms in the right eye) is comparable to the values reported by Puvanendran et al., who found significantly prolonged latencies in patients with type 2 DM even without clinically detectable retinopathy.11 Similar prolongation was documented by Cirillo et al. in an early series that first drew attention to sub-clinical central involvement in diabetes,12 and by Comi in a comprehensive review of evoked potential studies in DM.13 Parisi and co-workers extended these findings by demonstrating that the prolongation of P100 latency in diabetic patients was accompanied by a delayed pattern-electroretinogram, implying that both retinal and post-retinal segments of the visual pathway are affected.22 Our results are directly in line with these earlier reports and add contemporary evidence from an Indian type 2 DM cohort.
The strong positive correlation between P100 latency and duration of DM (r = +0.61, p < 0.001) recapitulates the observations of Uzun et al. and Heravian et al., who reported similar magnitudes of correlation in Turkish and Iranian populations respectively.23,24 A number of authors have proposed a mechanistic explanation based on the "microvascular hypothesis": chronic hyperglycaemia leads to endothelial dysfunction and thickening of the basement membrane of the vasa nervorum supplying the optic nerve and post-chiasmal pathway, producing endoneurial hypoxia and secondary demyelination.7,25 This slowing of central conduction is compounded by non-enzymatic glycation of myelin proteins and by activation of the polyol pathway with sorbitol accumulation, which impairs axonal Na⁺/K⁺-ATPase activity and slows saltatory conduction.8,26
The relationship between VEP abnormality and glycaemic control is a second important finding. HbA1c was strongly and inversely related to the N75–P100 amplitude (r = −0.42, p < 0.001) and modestly positively related to P100 latency. Ozkul et al. and Yenice et al. found a similar dependence of VEP parameters on glycated haemoglobin,27,28 and it is consistent with prospective evidence from the DCCT and UKPDS trials that intensive glycaemic control retards the progression of both retinal and neural complications.29,30 Ninety-five per cent of the patients in our cohort with poor glycaemic control had an abnormal VEP, while only 4 % of those with HbA1c below 8 % did — a striking gradient that indicates the metabolic dependence of central visual pathway conduction.
The association between VEP abnormality and diabetic retinopathy was highly significant. All patients with severe NPDR or PDR in our study had prolonged P100 latencies, and mean P100 latency rose progressively across retinopathy grades. This mirrors the findings of Karlica et al. and Bragadóttir et al., both of whom reported a stepwise prolongation of P100 with worsening retinopathy.31,32 Nevertheless, it is worth emphasising that 10 % of patients in Group P had no ophthalmoscopically detectable retinopathy despite abnormal VEP; conversely, 48 % of patients in Group S had at least mild NPDR. This dissociation reinforces the concept that VEP detects functional disturbance along the optic pathway that is independent of, and can precede, structural retinal changes.11,33
The link between VEP abnormality and diabetic peripheral neuropathy is biologically plausible and clinically important. Since the same microvascular and metabolic processes damage the vasa nervorum of peripheral nerves and of the optic pathway, one would expect the two to be correlated. In our sample the coexistence rate was 88 %, and abnormal VEP predicted the presence of neuropathy with an 88 % positive predictive value. Comparable coexistence has been reported by Dolu et al. and Gregori et al., who observed that central conduction abnormalities parallel peripheral nerve slowing in diabetic patients.34,35 From the clinician's perspective, if a diabetic patient is found to have a prolonged P100 latency on a screening VEP, an active look for peripheral neuropathy is warranted even in the absence of symptoms.
Renal function was significantly poorer in patients with abnormal VEP, but the relationship was weaker than for retinopathy or neuropathy. This is consistent with the observation that overt nephropathy tends to develop later in the natural history of type 2 DM than does retinopathy, and that a single cross-sectional measurement of eGFR is a less sensitive marker of early diabetic kidney disease than of established disease.4 Nevertheless, all cases of overt nephropathy and end-stage renal disease in our cohort were confined to the abnormal-VEP group, suggesting that a prolonged P100 latency identifies a patient with generalised end-organ involvement rather than isolated visual pathway damage.
The clinical implications of these findings are three-fold. First, VEP is inexpensive, quick (a single test can be completed in 15–20 minutes), reproducible and does not require patient co-operation beyond fixation, and could be feasibly added to the annual diabetic assessment in a physiology or neurology laboratory.9,21 Second, an abnormal VEP should prompt an active search for retinopathy, nephropathy and neuropathy, together with intensification of glycaemic and blood-pressure control. Third, VEP could theoretically serve as an objective marker of response to therapy: several small studies have shown that improvement in glycaemic control is accompanied by shortening of P100 latency over months to years.36 A prospective longitudinal study is needed to test this hypothesis formally.
4.1 Strengths and limitations
The strengths of the study include a balanced group design matched for age, sex and BMI, comprehensive concurrent assessment of all three major microvascular complications, and adherence to the ISCEV protocol for VEP recording. The limitations must also be acknowledged. First, the study is cross-sectional, so causality cannot be inferred; longitudinal follow-up would be needed to determine whether VEP prolongation truly precedes microvascular complications. Second, the classification of subjects into Group P and Group S on the basis of P100 latency alone means that duration and HbA1c differences between groups partly reflect this pre-selection; nevertheless, the pooled-cohort correlations are unaffected by this design. Third, we did not perform pattern-electroretinography or optical coherence tomography, which could have allowed better separation of pre-retinal, retinal and post-retinal contributions to the VEP abnormality. Fourth, the sample size was modest and single-centre. Finally, sensitivity and specificity estimates were derived from the same sample used to define the cut-off and should be regarded as internal descriptors rather than externally validated diagnostic performance.
CONCLUSION:
Pattern-reversal visual evoked potential is a sensitive, objective and inexpensive neurophysiological tool that identifies patients with type 2 diabetes mellitus who carry a substantially greater burden of retinopathy, nephropathy and peripheral neuropathy. In this study, a P100 latency exceeding 110 ms was strongly associated with longer disease duration, poorer glycaemic control, more severe retinal disease, reduced eGFR and higher-grade peripheral neuropathy, and demonstrated high positive and negative predictive value for advanced microvascular complications. These findings support the incorporation of VEP into the routine screening armamentarium of patients with diabetes, particularly those with more than ten years of disease or an HbA1c above 8 %. Future longitudinal work should examine whether VEP parameters can predict incident complications and track the response to intensified glycaemic and metabolic therapy.
REFERENCES:
1. International Diabetes Federation. IDF Diabetes Atlas. 10th ed. Brussels: International Diabetes Federation; 2021.
2. Anjana RM, Unnikrishnan R, Deepa M, Pradeepa R, Tandon N, Das AK, et al. Metabolic non-communicable disease health report of India: the ICMR-INDIAB national cross-sectional study (ICMR-INDIAB-17). Lancet Diabetes Endocrinol. 2023;11(7):474-89.
3. Cade WT. Diabetes-related microvascular and macrovascular diseases in the physical therapy setting. Phys Ther. 2008;88(11):1322-35.
4. Fowler MJ. Microvascular and macrovascular complications of diabetes. Clin Diabetes. 2008;26(2):77-82.
5. Zochodne DW. Diabetes and the plasticity of sensory neurons. Neurosci Lett. 2015;596:60-5.
6. Biessels GJ, Reijmer YD. Brain changes underlying cognitive dysfunction in diabetes: what can we learn from MRI? Diabetes. 2014;63(7):2244-52.
7. Brownlee M. Biochemistry and molecular cell biology of diabetic complications. Nature. 2001;414(6865):813-20.
8. Tomlinson DR, Gardiner NJ. Glucose neurotoxicity. Nat Rev Neurosci. 2008;9(1):36-45.
9. Odom JV, Bach M, Brigell M, Holder GE, McCulloch DL, Mizota A, et al. ISCEV standard for clinical visual evoked potentials: (2016 update). Doc Ophthalmol. 2016;133(1):1-9.
10. Chiappa KH. Evoked potentials in clinical medicine. 3rd ed. Philadelphia: Lippincott-Raven; 1997.
11. Puvanendran K, Devathasan G, Wong PK. Visual evoked responses in diabetes. J Neurol Neurosurg Psychiatry. 1983;46(7):643-7.
12. Cirillo D, Gonfiantini E, De Grandis D, Bongiovanni L, Robert JJ, Pinelli L. Visual evoked potentials in diabetic children and adolescents. Diabetes Care. 1984;7(3):273-5.
13. Comi G. Evoked potentials in diabetes mellitus. Clin Neurosci. 1997;4(6):374-9.
14. Papakostopoulos D, Hart JC, Corrall RJ, Harney B. The scotopic electroretinogram to blue flashes and pattern reversal visual evoked potentials in insulin-dependent diabetes. Int J Psychophysiol. 1996;21(1):33-43.
15. Verrotti A, Lobefalo L, Trotta D, Della Loggia G, Chiarelli F, Luigi C, et al. Visual evoked potentials in young persons with newly diagnosed diabetes: a long-term follow-up. Dev Med Child Neurol. 2000;42(4):240-4.
16. World Medical Association. World Medical Association Declaration of Helsinki: ethical principles for medical research involving human subjects. JAMA. 2013;310(20):2191-4.
17. American Diabetes Association. Standards of medical care in diabetes—2020. Diabetes Care. 2020;43(Suppl 1):S1-S212.
18. Wilkinson CP, Ferris FL 3rd, Klein RE, Lee PP, Agardh CD, Davis M, et al. Proposed international clinical diabetic retinopathy and diabetic macular edema disease severity scales. Ophthalmology. 2003;110(9):1677-82.
19. Haneda M, Utsunomiya K, Koya D, Babazono T, Moriya T, Makino H, et al. A new classification of diabetic nephropathy 2014: a report from Joint Committee on Diabetic Nephropathy. J Diabetes Investig. 2015;6(2):242-6.
20. Dyck PJ, Albers JW, Andersen H, Arezzo JC, Biessels GJ, Bril V, et al. Diabetic polyneuropathies: update on research definition, diagnostic criteria and estimation of severity. Diabetes Metab Res Rev. 2011;27(7):620-8.
21. Odom JV, Bach M, Brigell M, Holder GE, McCulloch DL, Tormene AP. ISCEV standard for clinical visual evoked potentials (2009 update). Doc Ophthalmol. 2010;120(1):111-9.
22. Parisi V, Uccioli L, Monticone G, Parisi L, Menzinger G, Bucci MG. Visual evoked potentials after photostress in insulin-dependent diabetic patients with or without retinopathy. Graefes Arch Clin Exp Ophthalmol. 1994;232(4):193-8.
23. Uzun N, Uluduz D, Mikla S, Aydin A. Evaluation of asymptomatic central neuropathy in type 2 diabetes mellitus. Electromyogr Clin Neurophysiol. 2006;46(3):131-7.
24. Heravian J, Ehyaei A, Shoeibi N, Azimi A, Ostadi-Moghaddam H, Yekta AA, et al. Pattern visual evoked potentials in patients with type 2 diabetes mellitus. J Ophthalmic Vis Res. 2012;7(3):225-30.
25. Cameron NE, Cotter MA. The relationship of vascular changes to metabolic factors in diabetes mellitus and their role in the development of peripheral nerve complications. Diabetes Metab Rev. 1994;10(3):189-224.
26. Greene DA, Sima AA, Stevens MJ, Feldman EL, Lattimer SA. Complications: neuropathy, pathogenetic considerations. Diabetes Care. 1992;15(12):1902-25.
27. Ozkul Y, Bozlar S. Effects of type 2 diabetes mellitus on somatosensory and visual evoked potentials. Neurol India. 2002;50(2):182-4.
28. Yenice O, Onal S, Midi I, Ozcan E, Temel A, D-IIeksioglu A. Visual field analysis in patients with type 2 diabetes mellitus with and without retinopathy. Ophthalmologica. 2011;225(2):81-6.
29. Diabetes Control and Complications Trial Research Group. The effect of intensive treatment of diabetes on the development and progression of long-term complications in insulin-dependent diabetes mellitus. N Engl J Med. 1993;329(14):977-86.
30. UK Prospective Diabetes Study (UKPDS) Group. Intensive blood-glucose control with sulphonylureas or insulin compared with conventional treatment and risk of complications in patients with type 2 diabetes (UKPDS 33). Lancet. 1998;352(9131):837-53.
31. Karlica D, Galetović D, Ivanišević M, Skrabić V, Znaor L, Jurišić D. Visual evoked potential can be used to detect a prediabetic form of diabetic retinopathy in patients with diabetes mellitus type I. Coll Antropol. 2010;34(2):525-9.
32. Bragadóttir R, Karlsson JÖ. Contrast sensitivity and visual evoked potentials in insulin-dependent diabetic children and adolescents. Acta Ophthalmol Scand. 1998;76(3):357-62.
33. Lopes de Faria JM, Katsumi O, Cagliero E, Nathan D, Hirose T. Neurovisual abnormalities preceding the retinopathy in patients with long-term type 1 diabetes mellitus. Graefes Arch Clin Exp Ophthalmol. 2001;239(9):643-8.
34. Dolu H, Ulas UH, Bolu E, Ozkardes A, Odabasi Z, Ozata M, et al. Evaluation of central neuropathy in type II diabetes mellitus by multimodal evoked potentials. Acta Neurol Belg. 2003;103(4):206-11.
35. Gregori B, Galié E, Pro S, Clemenzi A, Accornero N. Luminance and chromatic visual evoked potentials in type I and type II diabetes: relationships with peripheral neuropathy. Neurol Sci. 2006;27(5):323-7.
36. Bhaskar S, Sharma D, Bhaskar S, Bharathi Devi M, Rahmath Nisha K, Zaidi N. Evaluation of visual evoked potentials in type 2 diabetes mellitus patients with normal fundus and their correlation with glycosylated haemoglobin (HbA1c). J Clin Diagn Res. 2016;10(4):CC10-13.