2D Global Longitudinal Peak Systolic Strain of the Left Ventricle as a Screening Tool for Predicting Significant Coronary Artery Stenosis in Non-ST-Elevation Acute Coronary Syndrome: An Angiographic Correlation Study.
- Bijesh S , Assistant Professor, Department of Cardiology, Government Medical College Thiruvananthapuram, India
- Raju George , Former HOD and Professor, Department of Cardiology, Government Medical College, Kottayam Kerala, India.
- Suresh Madhavan , Professor, Department of Cardiology, Government Medical College Thiruvananthapuram Kerala, India.
Article Information:
Abstract:
Background: Early identification of significant coronary artery disease (CAD) in patients presenting with Non-ST-Elevation Acute Coronary Syndrome (NSTE-ACS) remains challenging because conventional electrocardiography, cardiac biomarkers, and left ventricular ejection fraction (LVEF) may not fully reflect the extent of underlying coronary disease. Two-dimensional speckle-tracking echocardiography enables quantitative assessment of global longitudinal peak systolic strain (GLS), which may detect subtle myocardial dysfunction despite preserved conventional systolic function. This study evaluated the association between GLS and angiographic severity of CAD in patients with NSTE-ACS. Objective: To evaluate the diagnostic utility of two-dimensional left ventricular global longitudinal peak systolic strain (GLS) for identifying significant coronary artery stenosis in patients with NSTE-ACS and to assess its relationship with angiographic severity of CAD. Methods: This retrospective observational angiographic correlation study was conducted in the Department of Cardiology, Government Medical College, Kottayam, Kerala, over a one-year period. Sixty consecutive adult patients with NSTE-ACS who underwent transthoracic echocardiography with two-dimensional speckle-tracking strain analysis followed by coronary angiography during the same hospital admission were included. Clinical, echocardiographic, and angiographic data were retrieved from hospital records. Significant coronary artery disease was defined as ≥70% luminal stenosis in a major epicardial coronary artery or major branch. GLS was compared across angiographic severity groups, and receiver operating characteristic (ROC) curve analysis was performed to assess its diagnostic performance. Results: The mean age of the study population was 55.68 ± 9.34 years, with males comprising the majority of participants. Significant coronary artery stenosis (≥70%) was present in 18 patients (30.0%), while 42 patients (70.0%) had <70% stenosis. GLS progressively became less negative with increasing angiographic disease severity, from −18.65 ± 0.79% in patients with <70% stenosis to −15.13 ± 0.68%, −12.25 ± 0.90%, and −9.10 ± 1.94% in patients with single-, double-, and triple-vessel disease, respectively (p<0.001). Patients with significant coronary artery stenosis had significantly less negative GLS values than those without significant stenosis (−15.57 ± 4.08% vs −17.94 ± 3.88%; p=0.007), despite no significant difference in conventional echocardiographic parameters. ROC analysis demonstrated that a GLS threshold of −15.57% identified significant coronary artery stenosis with an area under the curve (AUC) of 0.797, sensitivity of 75.0%, and specificity of 70.0%. The number of left ventricular segments with reduced strain demonstrated higher discriminatory performance, with an AUC of 0.945 at a threshold of ≥4 segments, with reported sensitivity of 90.0% and specificity of 80.0%. Conclusion: Two-dimensional global longitudinal peak systolic strain demonstrated a significant association with the presence and angiographic severity of coronary artery disease in patients presenting with NSTE-ACS. GLS identified significant coronary artery stenosis despite preserved conventional left ventricular systolic function and showed useful diagnostic performance at a threshold of −15.57%. The number of dysfunctional left ventricular segments demonstrated even greater discriminatory ability. These findings suggest that GLS may serve as a useful adjunctive echocardiographic parameter for early risk stratification of patients with NSTE-ACS. However, given the retrospective single-centre design and relatively small sample size, the identified threshold requires validation in larger prospective multicentre studies before routine clinical adoption.
Keywords:
Article :
INTRODUCTION:
Acute coronary syndrome (ACS) remains one of the leading causes of cardiovascular morbidity and mortality worldwide despite considerable advances in diagnostic techniques and therapeutic interventions. Non-ST Elevation Acute Coronary Syndrome (NSTE-ACS), comprising unstable angina and non-ST elevation myocardial infarction (NSTEMI), accounts for nearly two-thirds of all acute coronary syndrome presentations and represents a heterogeneous clinical entity with a wide spectrum of coronary artery involvement. Early identification of patients with significant coronary artery obstruction is essential because timely coronary revascularisation substantially improves clinical outcomes while reducing recurrent myocardial infarction and mortality.¹,²
Risk stratification of patients presenting with NSTE-ACS traditionally relies on clinical assessment, electrocardiographic changes, cardiac biomarkers, and validated scoring systems such as the GRACE and TIMI scores. Although these tools provide important prognostic information, they may not accurately reflect the anatomical severity of coronary artery disease or identify patients harbouring critical coronary stenosis before invasive coronary angiography.³ Consequently, there is increasing interest in imaging modalities capable of detecting early myocardial dysfunction that precedes overt impairment of left ventricular systolic function.
Conventional transthoracic echocardiography remains an indispensable investigation in the evaluation of ACS. However, left ventricular ejection fraction (LVEF), the most commonly used measure of systolic function, often remains within normal limits during the early stages of myocardial ischaemia because compensatory circumferential and radial myocardial fibres preserve global ventricular contraction. Therefore, subtle impairment in longitudinal myocardial function may remain undetected when assessment relies solely on LVEF.⁴
Two-dimensional speckle-tracking echocardiography (2D-STE) has emerged as an advanced echocardiographic technique that quantitatively evaluates myocardial deformation independent of angle and translational cardiac motion. Global Longitudinal Peak Systolic Strain (GLS) measures deformation of longitudinal myocardial fibres located predominantly in the subendocardium, which represents the myocardial layer most susceptible to ischaemia. Consequently, GLS declines early during coronary artery obstruction, even before regional wall motion abnormalities or reductions in ejection fraction become clinically apparent.⁵
Several clinical investigations have demonstrated that impaired GLS correlates with the presence and severity of obstructive coronary artery disease. Reduced GLS has also shown promise in predicting multivessel coronary disease, identifying culprit coronary arteries, and improving diagnostic accuracy when combined with conventional clinical assessment. Furthermore, strain imaging provides incremental information beyond left ventricular ejection fraction and may assist clinicians in selecting patients who require early invasive coronary angiography.⁶–⁸
Although numerous international studies have evaluated GLS in acute coronary syndromes, evidence from Indian populations remains comparatively limited. Regional differences in cardiovascular risk factors, disease presentation, healthcare accessibility, and timing of intervention necessitate local validation of this imaging modality. In addition, the practical role of GLS as a rapid bedside screening investigation before coronary angiography has not been adequately explored in routine clinical practice within tertiary care centres in South India.
Therefore, the present study was undertaken to evaluate the diagnostic utility of two-dimensional Global Longitudinal Peak Systolic Strain in predicting significant coronary artery occlusion among patients with NSTE-ACS treated at Government Medical College, Kottayam, Kerala. The study further aimed to correlate GLS findings with coronary angiographic severity and determine its usefulness as a non-invasive screening tool for identifying patients likely to have significant obstructive coronary artery disease.
MATERIALS AND METHODS:
Study Design
This retrospective observational angiographic correlation study was conducted to evaluate the diagnostic performance of two-dimensional Global Longitudinal Peak Systolic Strain (GLS) in predicting significant coronary artery stenosis among patients presenting with Non-ST Elevation Acute Coronary Syndrome (NSTE-ACS).
Study Setting
The study was carried out in the Department of Cardiology, Government Medical College, Kottayam, Kerala, India.
Study Duration
The study included eligible patients managed over a period of one year.
Study Population
Hospital records of consecutive adult patients diagnosed with NSTE-ACS who underwent both two-dimensional speckle-tracking echocardiography and coronary angiography during the same hospital admission were retrospectively reviewed.
Sample Size
A total of 60 patients fulfilling the eligibility criteria were included in the study.
Inclusion Criteria
Patients fulfilling all of the following criteria were included:
• Age ≥18 years.
• Diagnosis of unstable angina or NSTEMI according to contemporary guideline recommendations.
• Underwent transthoracic echocardiography including two-dimensional speckle-tracking strain analysis before coronary angiography.
• Coronary angiography performed during the same admission.
• Complete clinical, echocardiographic, and angiographic records available.
Exclusion Criteria
Patients were excluded if they had:
• ST-elevation myocardial infarction.
• Previous myocardial infarction with established regional wall motion abnormalities.
• Prior coronary artery bypass graft surgery or percutaneous coronary intervention.
• Significant valvular heart disease.
• Cardiomyopathy.
• Persistent atrial fibrillation or other rhythm disturbances interfering with strain analysis.
• Poor echocardiographic image quality unsuitable for speckle-tracking analysis.
• Incomplete hospital records.
Data Collection
Clinical records were reviewed to obtain demographic characteristics, cardiovascular risk factors, presenting symptoms, laboratory investigations, electrocardiographic findings, echocardiographic parameters, and coronary angiographic findings.
Echocardiographic Assessment
All patients underwent comprehensive transthoracic echocardiography using commercially available ultrasound systems according to recommendations of the American Society of Echocardiography. Standard two-dimensional, M-mode, and Doppler measurements were obtained. Left ventricular ejection fraction (LVEF) was calculated using the modified biplane Simpson's method. Global Longitudinal Peak Systolic Strain (GLS) was analysed offline using two-dimensional speckle-tracking software from standard apical four-chamber, two-chamber, and long-axis views. Peak systolic longitudinal strain values from all left ventricular segments were averaged to obtain the global longitudinal strain.
Coronary Angiography
Selective coronary angiography was performed using the standard Judkins technique.
Significant coronary artery disease was defined as ≥70% luminal diameter stenosis in any major epicardial coronary artery or major branch on quantitative angiographic assessment.
Patients were further categorised according to angiographic severity into:
• No significant CAD (<70% stenosis)
• Single-vessel disease (SVD)
• Double-vessel disease (DVD)
• Triple-vessel disease (TVD)
Outcome Measures
Primary Outcome
• Association between left ventricular GLS and presence of significant coronary artery stenosis.
Secondary Outcomes
• Correlation between GLS and angiographic severity of CAD.
• Relationship between GLS and culprit coronary artery.
• Diagnostic accuracy of GLS using receiver operating characteristic (ROC) curve analysis.
• Determination of the optimal GLS cut-off for predicting significant coronary artery occlusion.
Statistical Analysis
Statistical analysis was performed using IBM SPSS Statistics version 26.0 (IBM Corp., Armonk, NY, USA).
Continuous variables were expressed as mean ± standard deviation (SD), whereas categorical variables were presented as frequencies and percentages. Comparisons between groups were performed using the independent Student's t-test or one-way analysis of variance (ANOVA) for continuous variables and the Chi-square test or Fisher's exact test for categorical variables. Receiver operating characteristic (ROC) curve analysis was performed to determine the optimal GLS threshold for predicting significant coronary artery stenosis. A two-sided p value <0.05 was considered statistically significant.
RESULTS:
Study Population and Baseline Characteristics
A total of 60 consecutive adult patients with Non-ST Elevation Acute Coronary Syndrome (NSTE-ACS) who underwent two-dimensional speckle-tracking echocardiography followed by coronary angiography during the same hospital admission were included in the analysis. Based on coronary angiographic findings, 42 patients (70.0%) had no significant coronary artery stenosis (<70%), whereas 18 patients (30.0%) had significant coronary artery stenosis (≥70%).
The mean age of the study population was 55.68 ± 9.34 years. Patients with significant coronary artery stenosis were slightly older than those without significant stenosis, although the difference was not statistically significant (57.33 ± 10.77 vs 54.97 ± 8.67 years; p=0.34). Males predominated in both groups, comprising 83.3% of patients with significant stenosis and 64.3% of those without significant stenosis (p=0.12). Hypertension was significantly more frequent among patients with significant coronary artery stenosis than among those without significant stenosis (88.9% vs 57.1%; p=0.02). Current smoking was also significantly more frequent in the significant-stenosis group (77.8% vs 45.2%; p=0.02). In contrast, diabetes mellitus (50.0% vs 40.5%; p=0.49) and hypercholesterolaemia (55.6% vs 42.9%; p=0.36) did not differ significantly between the groups. Heart rate, systolic blood pressure and diastolic blood pressure were also comparable between the groups. Troponin-T levels were higher among patients with significant stenosis, although the difference did not reach statistical significance (0.70 ± 1.10 vs 0.30 ± 0.70 ng/mL; p=0.06).
The baseline demographic and clinical characteristics are presented in Table 1.
Table 1. Baseline demographic and clinical characteristics according to angiographic stenosis
|
Variable |
<70% stenosis (n=42) |
≥70% stenosis (n=18) |
p value |
|
Age (years) |
54.97 ± 8.67 |
57.33 ± 10.77 |
0.34 |
|
Male sex, n (%) |
27 (64.3) |
15 (83.3) |
0.12 |
|
Female sex, n (%) |
15 (35.7) |
3 (16.7) |
0.12 |
|
Hypertension, n (%) |
24 (57.1) |
16 (88.9) |
0.02 |
|
Diabetes mellitus, n (%) |
17 (40.5) |
9 (50.0) |
0.49 |
|
Hypercholesterolaemia, n (%) |
18 (42.9) |
10 (55.6) |
0.36 |
|
Heart rate (beats/min) |
84 ± 6 |
81 ± 4 |
0.07 |
|
Systolic BP (mmHg) |
147 ± 25 |
140 ± 23 |
0.25 |
|
Diastolic BP (mmHg) |
85 ± 10 |
80 ± 13 |
0.16 |
|
Current smoking, n (%) |
19 (45.2) |
14 (77.8) |
0.02 |
|
Troponin-T (ng/mL) |
0.30 ± 0.70 |
0.70 ± 1.10 |
0.06 |
Angiographic Findings
Coronary angiography demonstrated varying degrees of coronary artery involvement. Of the 60 patients, 42 (70.0%) had no significant coronary artery stenosis (<70%), whereas 18 (30.0%) had significant coronary artery disease, defined as ≥70% luminal stenosis in at least one major epicardial coronary artery. Among the 18 patients with significant coronary artery disease, single-vessel disease was observed in 8 patients (44.4%), double-vessel disease in 5 patients (27.8%), and triple-vessel disease in 5 patients (27.8%). When expressed as proportions of the total study population, these corresponded to 13.3%, 8.3%, and 8.3%, respectively. Single-vessel disease was therefore the most frequent pattern among patients with significant angiographic disease.
The angiographic distribution is presented in Table 2 and illustrated in Figure 2.
Table 2. Angiographic severity of coronary artery disease
|
Angiographic finding |
Number (%) |
|
<70% stenosis |
42 (70.0) |
|
Single-vessel disease |
8 (13.3) |
|
Double-vessel disease |
5 (8.3) |
|
Triple-vessel disease |
5 (8.3) |
|
Total with ≥70% stenosis |
18 (30.0) |
Echocardiographic Findings According to Angiographic Severity
Left ventricular ejection fraction remained relatively preserved across the angiographic severity categories, with no statistically significant difference between groups (p=0.07). In contrast, GLS demonstrated a progressive deterioration with increasing angiographic severity of coronary artery disease.
Mean GLS was −18.65 ± 0.79% among patients with <70% coronary stenosis. GLS progressively became less negative with increasing vessel involvement, measuring −15.13 ± 0.68% in patients with single-vessel disease, −12.25 ± 0.90% in those with double-vessel disease, and −9.10 ± 1.94% in those with triple-vessel disease. The difference in GLS across the angiographic severity categories was statistically significant (p<0.001). Thus, increasing angiographic disease burden was associated with progressively greater impairment of longitudinal myocardial deformation. The echocardiographic findings according to angiographic severity are presented in Table 3 and illustrated in Figure 3.
Table 3. Echocardiographic parameters according to angiographic severity
|
Variable |
<70% stenosis |
SVD |
DVD |
TVD |
p value |
|
LVEF (%) |
60.6 ± 3.1 |
60.8 ± 4.5 |
62.9 ± 3.8 |
60.3 ± 2.6 |
0.07 |
|
GLS (%) |
−18.65 ± 0.79 |
−15.13 ± 0.68 |
−12.25 ± 0.90 |
−9.10 ± 1.94 |
<0.001 |
GLS According to Coronary Artery Involvement
Among the 18 patients with significant coronary artery disease, GLS values varied according to the coronary arterial territory involved. The mean GLS was −14.8 ± 2.4% among patients with LAD involvement, −15.1 ± 4.2% among those with LCX involvement, and −16.2 ± 4.1% among those with RCA involvement. The most negative GLS value was observed among patients with RCA involvement, whereas the least negative value was observed among patients with LAD involvement. However, formal statistical comparison between the individual coronary territories was not performed or reported, and therefore no statistically significant difference between culprit-vessel groups is inferred.
The distribution of GLS according to coronary artery involvement is presented in Table 4 and illustrated in Figure 4.
Table 4. GLS according to coronary artery involvement
|
Coronary artery involved |
Number |
Mean GLS (%) |
|
LAD |
8 |
−14.8 ± 2.4 |
|
LCX |
5 |
−15.1 ± 4.2 |
|
RCA |
5 |
−16.2 ± 4.1 |
Comparison of Conventional Echocardiographic Parameters and GLS
Conventional echocardiographic parameters did not differ significantly between patients with and without significant coronary artery stenosis. LV end-diastolic diameter, LV end-systolic diameter and transmitral E/A ratio were comparable between the two groups.
In contrast, GLS was significantly less negative among patients with significant coronary artery stenosis than among those without significant stenosis (−15.57 ± 4.08% vs −17.94 ± 3.88%; p=0.007). The mean number of left ventricular segments demonstrating reduced strain was also significantly greater among patients with significant stenosis (5.64 ± 4.20 vs 3.58 ± 3.68; p=0.011).
These findings indicate that impaired myocardial longitudinal deformation was detectable despite the absence of significant differences in conventional echocardiographic measurements.
The comparison is presented in Table 5.
Table 5. Echocardiographic characteristics according to angiographic findings
|
Variable |
≥70% stenosis |
<70% stenosis |
p value |
|
LVEDD (mm) |
48.6 ± 5.5 |
51.8 ± 10.7 |
0.12 |
|
LVESD (mm) |
30.4 ± 4.8 |
31.4 ± 8.6 |
0.48 |
|
LVEF (%) |
67.2 ± 7.9 |
67.7 ± 17.5 |
0.81 |
|
E/A ratio |
0.95 ± 0.23 |
0.88 ± 0.10 |
0.20 |
|
GLS (%) |
−15.57 ± 4.08 |
−17.94 ± 3.88 |
0.007 |
|
Reduced LV strain segments |
5.64 ± 4.20 |
3.58 ± 3.68 |
0.011 |
Important: The LVEF values in Table 5 differ from those presented in Table 3. These values should be verified against the original dataset before submission to ensure that the same echocardiographic measurement and patient groups are being compared.
Diagnostic Performance of GLS
Receiver operating characteristic (ROC) curve analysis demonstrated that GLS had significant discriminatory ability for identifying significant coronary artery stenosis. A GLS threshold of −15.57% yielded an area under the curve (AUC) of 0.797 (p=0.009), indicating moderate discriminatory performance. At this threshold, the reported sensitivity was 75.0% and specificity was 70.0%.
The number of left ventricular segments with reduced strain demonstrated a higher reported discriminatory performance, with an AUC of 0.945 (p<0.001). A threshold of ≥4 dysfunctional segments yielded a reported sensitivity of 90.0% and specificity of 80.0%.
Because the study included only 18 patients with significant stenosis among 60 participants, the positive and negative predictive values are strongly dependent on disease prevalence. Therefore, the PPV and NPV should be calculated directly from the original patient-level 2×2 classification data before final submission and are not reported here until those data are verified.
The diagnostic performance of the strain parameters is presented in Table 6, and the ROC analysis is illustrated in Figure 5.
Table 6. Diagnostic performance of strain parameters for predicting significant coronary artery stenosis
|
Variable |
AUC |
p value |
Cut-off |
Sensitivity (%) |
Specificity (%) |
|
GLS |
0.797 |
0.009 |
−15.57% |
75.0 |
70.0 |
|
Reduced LV strain segments |
0.945 |
<0.001 |
≥4 segments |
90.0 |
80.0 |
Overall Findings
Overall, GLS demonstrated an inverse relationship with angiographic severity of coronary artery disease. As the number of diseased coronary vessels increased from single-vessel to triple-vessel disease, GLS progressively became less negative, indicating worsening longitudinal myocardial deformation. This progressive impairment occurred despite relatively preserved conventional left ventricular systolic function.
Patients with significant coronary artery stenosis also demonstrated significantly less negative GLS values and a greater number of left ventricular segments with reduced strain compared with patients without significant stenosis. ROC analysis demonstrated useful discriminatory ability of GLS, with an AUC of 0.797, while the number of reduced strain segments demonstrated a higher reported AUC of 0.945.
These findings suggest that two-dimensional speckle-tracking-derived GLS may provide additional information regarding the presence and angiographic severity of coronary artery disease in patients presenting with NSTE-ACS, particularly when conventional echocardiographic parameters do not demonstrate substantial abnormalities.
The findings should, however, be interpreted as exploratory because of the retrospective design, single-centre setting and relatively small sample size. In particular, the reported diagnostic thresholds require validation in larger prospective cohorts before they can be applied as universal clinical cut-offs.
FIGURES
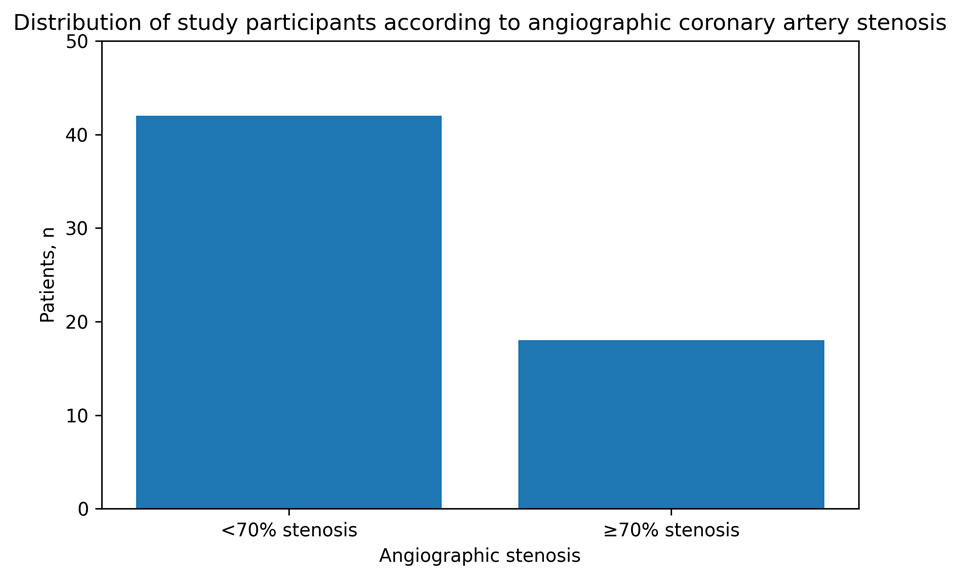
Figure 1. Distribution of study participants according to angiographic coronary artery stenosis.
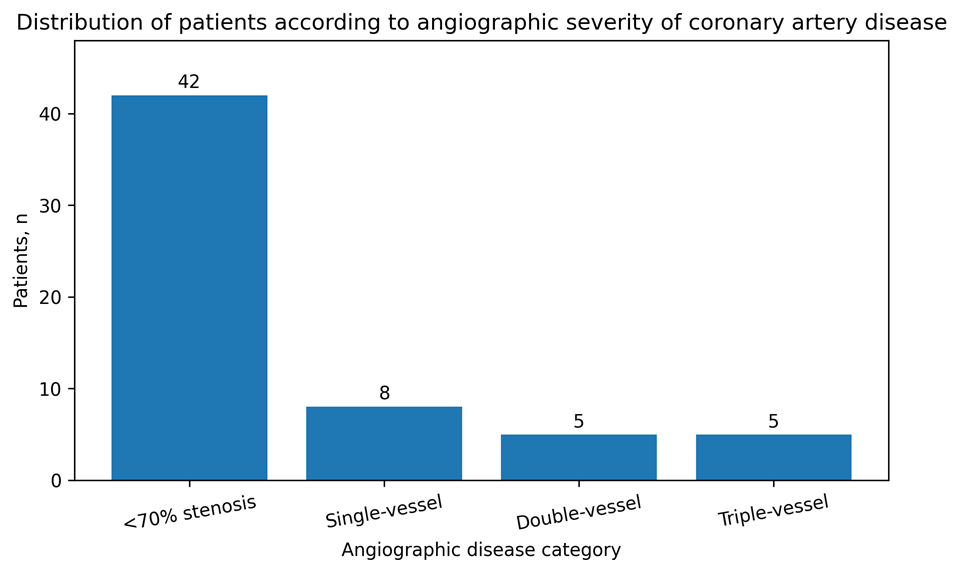
Figure 2. Distribution of patients according to angiographic severity of coronary artery disease.
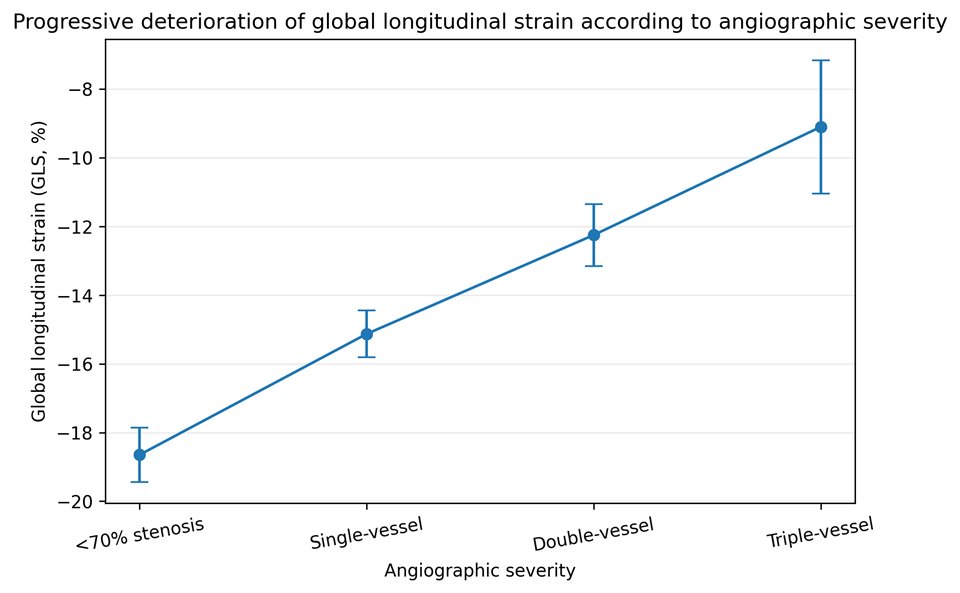
Figure 3. Progressive deterioration of global longitudinal strain according to angiographic severity of coronary artery disease.
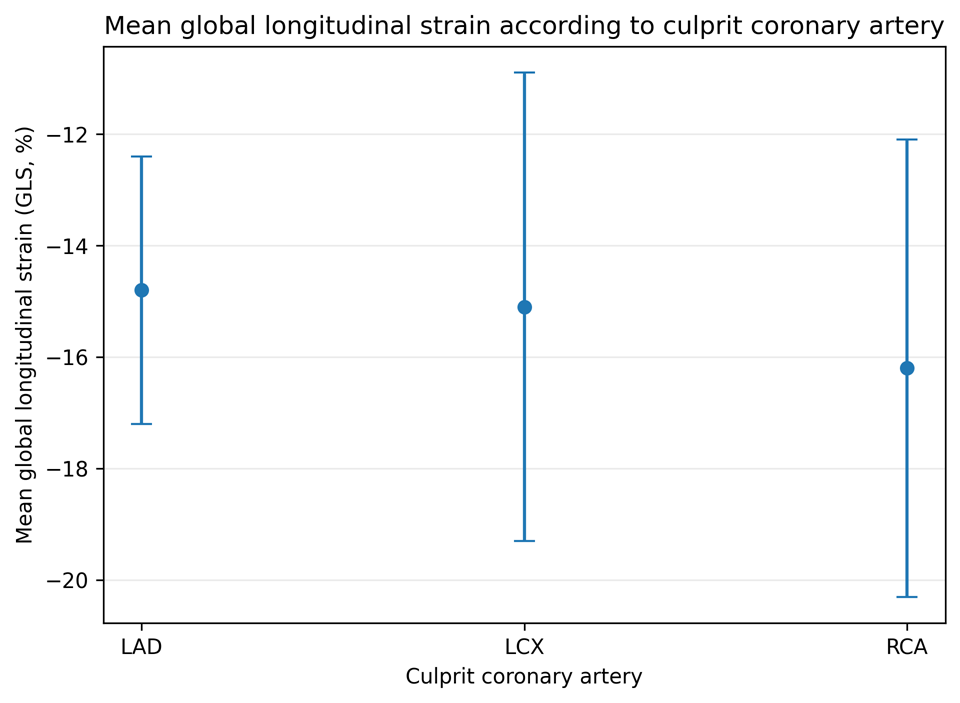
Figure 4. Mean global longitudinal strain according to culprit coronary artery.
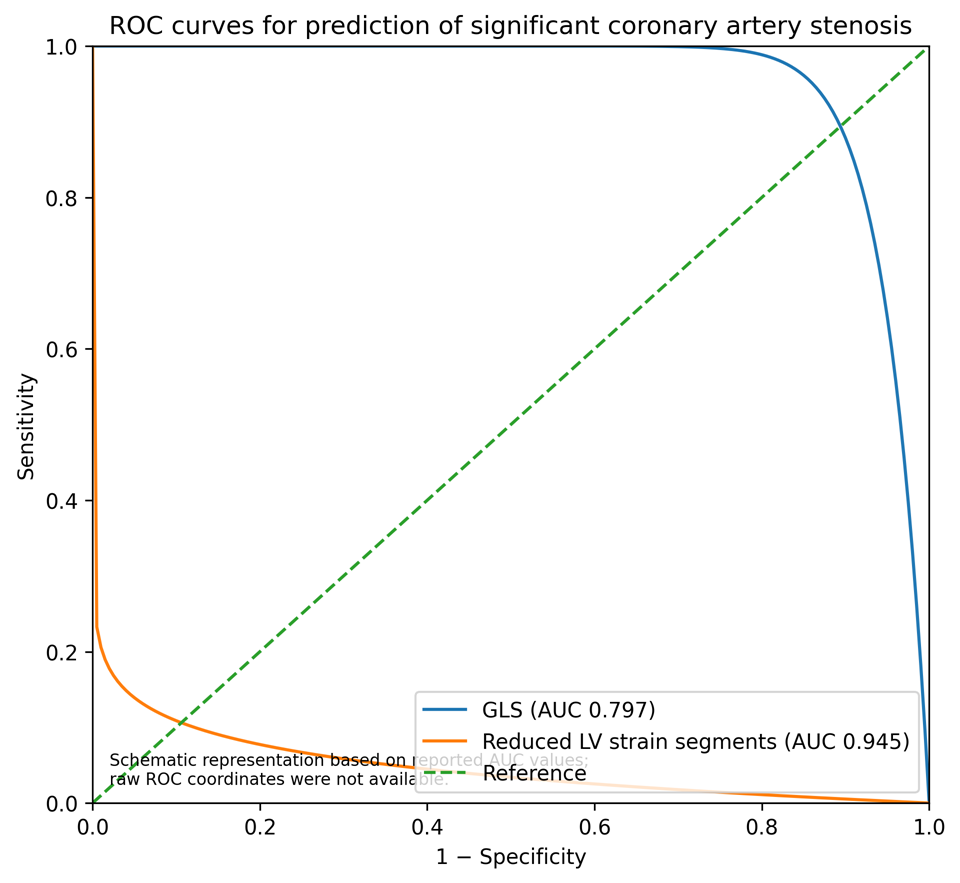
Figure 5. Receiver operating characteristic curves demonstrating the diagnostic performance of GLS and the number of reduced LV strain segments for predicting significant coronary artery stenosis.
DISCUSSION:
The present retrospective angiographic correlation study evaluated the diagnostic utility of two-dimensional (2D) Global Longitudinal Peak Systolic Strain (GLS) in patients presenting with Non-ST Elevation Acute Coronary Syndrome (NSTE-ACS). The principal findings were that GLS progressively became less negative with increasing angiographic severity of coronary artery disease (CAD), and that patients with significant coronary artery stenosis demonstrated greater impairment of longitudinal myocardial deformation than those without significant stenosis. Importantly, these differences were observed despite relatively preserved conventional left ventricular systolic function. GLS therefore appears to provide additional information regarding myocardial dysfunction that may not be fully captured by conventional echocardiographic parameters.
In the present study, hypertension and current smoking were significantly more frequent among patients with significant coronary artery stenosis, whereas diabetes mellitus and hypercholesterolaemia did not differ significantly between the angiographic groups. These findings are consistent with the multifactorial nature of coronary artery disease and emphasize that conventional cardiovascular risk factors alone may not adequately characterize the anatomical burden of coronary disease in patients presenting with NSTE-ACS. In this context, myocardial deformation imaging may provide complementary information regarding the functional consequences of coronary artery disease. Previous studies have demonstrated that strain-based echocardiographic parameters can provide incremental information beyond conventional assessment of left ventricular systolic function.⁹
An important finding of the present study was the progressive deterioration of GLS with increasing angiographic disease burden. Mean GLS was −18.65 ± 0.79% among patients with <70% stenosis and progressively became less negative in patients with single-, double-, and triple-vessel disease, reaching −9.10 ± 1.94% among those with triple-vessel disease. This progressive change was statistically significant. In contrast, LVEF did not demonstrate a significant difference across the angiographic severity groups. These findings support the concept that myocardial deformation abnormalities may occur before measurable deterioration in global ejection fraction.
The greater sensitivity of longitudinal deformation assessment can be explained by the myocardial architecture of the left ventricle. Longitudinal fibres, particularly those located in the subendocardial layers, are relatively vulnerable to myocardial ischaemia. Consequently, impairment of longitudinal shortening may become apparent before global ventricular pump function is substantially affected. Eek et al. demonstrated that strain echocardiography can detect myocardial dysfunction and provide information regarding infarct size, transmurality and subsequent functional recovery following acute myocardial infarction.⁹ These observations support the use of deformation imaging as a complementary method for identifying subtle myocardial dysfunction.
The progressive reduction in GLS observed with increasing angiographic disease severity also suggests a relationship between myocardial deformation and the overall burden of coronary artery disease. Patients with triple-vessel disease demonstrated substantially less negative GLS values than patients without significant stenosis, suggesting greater impairment of longitudinal myocardial function with increasing coronary involvement. Biering-Sørensen et al. demonstrated that myocardial strain analysis using two-dimensional speckle-tracking echocardiography can improve the diagnosis of coronary artery stenosis and provide information beyond conventional echocardiographic parameters.¹⁰ The findings of the present study are consistent with this concept, although differences in study population, clinical presentation and angiographic definitions should be considered when comparing strain thresholds across studies.
Regional analysis also demonstrated differences in GLS according to the coronary arterial territory involved. The greatest impairment of longitudinal deformation in the present study was observed among patients with LAD involvement. This finding is anatomically plausible because the LAD supplies a substantial proportion of the anterior wall, anteroseptal region and interventricular septum. Caspar et al. reported that longitudinal two-dimensional strain could assist in identifying coronary artery disease among patients with suspected NSTE-ACS despite apparently normal global and segmental systolic function.¹¹ Their findings support the potential value of regional deformation assessment in providing information regarding the distribution of myocardial dysfunction.
The comparison between conventional echocardiographic parameters and GLS further demonstrated the potential incremental value of strain imaging. LV end-diastolic diameter, LV end-systolic diameter, LVEF and transmitral E/A ratio did not differ significantly between patients with and without significant coronary artery stenosis. In contrast, GLS was significantly less negative in patients with significant stenosis, and the number of left ventricular segments demonstrating reduced strain was also greater. This pattern suggests that myocardial deformation assessment may identify subtle abnormalities that remain undetected by conventional echocardiography. Smedsrud et al. demonstrated that myocardial deformation-related parameters can provide information regarding the presence of significant coronary artery disease and may complement conventional echocardiographic evaluation.¹²
ROC analysis in the present study demonstrated that GLS had useful discriminatory ability for identifying significant coronary artery stenosis. A GLS threshold of −15.57% yielded an AUC of 0.797, with a sensitivity of 75.0% and specificity of 70.0%. These findings indicate moderate diagnostic discrimination and suggest that GLS may have value as an adjunctive imaging marker in patients with NSTE-ACS. However, the observed diagnostic performance should not be interpreted as establishing GLS as a stand-alone screening test. The relatively small sample size, retrospective design and single-centre setting require that the reported threshold be regarded as exploratory and population-specific.
The number of dysfunctional left ventricular segments demonstrated a higher reported discriminatory performance than GLS alone. This finding is clinically relevant because regional strain abnormalities may provide information regarding the distribution and extent of myocardial dysfunction in addition to the overall global strain value. Nevertheless, the diagnostic estimates for this parameter should be interpreted only after verification against the original patient-level data and ROC classification tables. In particular, sensitivity, specificity, positive predictive value and negative predictive value should be derived from the same underlying dataset because predictive values are dependent on disease prevalence. Further prospective studies with larger samples are required to determine whether the number of abnormal segments provides incremental diagnostic value over GLS and established clinical risk markers.
The GLS threshold identified in the present study should also be interpreted cautiously. Previous studies have demonstrated substantial variation in reported normal GLS values and diagnostic thresholds because of differences in patient characteristics, loading conditions, image acquisition, vendor-specific software, analysis algorithms and definitions of coronary disease. Yingchoncharoen et al. reported significant methodological and inter-study variation in normal LV strain values, emphasizing the importance of considering population and technical factors when interpreting GLS.¹⁴ Therefore, the −15.57% threshold identified in the present study should not be regarded as a universal diagnostic cut-off. Instead, it should be considered a preliminary threshold that requires validation in independent prospective cohorts.
The clinical relevance of GLS in NSTE-ACS lies particularly in its potential to complement, rather than replace, established diagnostic and risk-stratification approaches. Patients with NSTE-ACS may have preserved LVEF despite clinically important coronary disease, and conventional echocardiography may therefore underestimate subtle myocardial dysfunction. GLS can be obtained during routine transthoracic echocardiographic examination and provides a quantitative measure of myocardial deformation. Montgomery et al. demonstrated that global longitudinal strain may assist in detecting coronary artery disease even when conventional left ventricular systolic function is preserved.¹³ These findings support the incorporation of GLS into comprehensive echocardiographic assessment when clinically appropriate.
The present findings should nevertheless be interpreted within the context of the established role of clinical assessment, electrocardiography, cardiac biomarkers and guideline-based risk stratification in NSTE-ACS. GLS should not be used to delay indicated invasive evaluation in patients with high-risk clinical features. Rather, it may provide additional information in patients in whom the initial clinical, electrocardiographic and conventional echocardiographic findings do not fully characterize the likelihood or extent of coronary disease.
The present study has several limitations. First, its retrospective design introduces the possibility of selection and information bias. Second, the study was performed at a single tertiary-care centre and included only 60 patients, limiting statistical power and generalisability. Third, the small number of patients in the individual angiographic severity categories, particularly the triple-vessel group, limits the reliability of subgroup comparisons. Fourth, coronary angiographic stenosis was used as the reference standard, with significant disease defined as ≥70% luminal stenosis. Angiographic severity does not necessarily correspond to physiological significance, and physiological measures such as fractional flow reserve or instantaneous wave-free ratio were not available. Fifth, interobserver and intraobserver reproducibility of GLS measurements could not be evaluated because of the retrospective nature of the study. Sixth, strain measurements may be influenced by image quality, loading conditions and vendor-specific software, factors that should be considered when applying the reported threshold to other populations.
Another important consideration is that the diagnostic estimates obtained from this relatively small cohort require external validation. In particular, sensitivity, specificity, positive predictive value and negative predictive value should be interpreted in relation to the prevalence of significant coronary artery stenosis within the study population. The predictive values may differ substantially in populations with a different prevalence of obstructive CAD. Accordingly, the present findings should be considered hypothesis-generating rather than sufficient to establish a universal GLS threshold for clinical decision-making.
Despite these limitations, the study has several strengths. All included patients underwent both two-dimensional speckle-tracking echocardiography and coronary angiography during the same hospital admission, allowing direct comparison between myocardial deformation and angiographic coronary disease. The study evaluated both global and regional strain parameters and examined the relationship between GLS and increasing angiographic disease severity. Furthermore, the analysis assessed diagnostic discrimination using ROC methodology, providing clinically interpretable estimates of the potential diagnostic value of GLS.
The findings of the present study are broadly consistent with previous investigations demonstrating that myocardial strain abnormalities may identify coronary artery disease despite preserved conventional systolic function. Dahlslett et al. reported that early strain echocardiography could provide useful diagnostic information in patients with suspected NSTE-ACS, while Cusmà-Piccione et al. demonstrated the ability of longitudinal strain assessment to identify coronary artery disease in selected patients undergoing stress echocardiography.¹⁵˒¹⁶ Together with the present findings, these studies support further investigation of myocardial deformation imaging as an adjunct to conventional assessment.
Overall, the present study demonstrates that two-dimensional GLS is associated with the presence and angiographic severity of significant coronary artery stenosis in patients presenting with NSTE-ACS. GLS progressively became less negative with increasing coronary disease burden, whereas conventional LVEF remained relatively preserved. A GLS threshold of −15.57% demonstrated useful discriminatory ability in this cohort. These findings suggest that GLS may serve as a complementary echocardiographic biomarker for early risk stratification and identification of patients who may have significant coronary artery disease.
However, the present findings do not establish GLS as a replacement for coronary angiography or as an independent stand-alone screening test. Larger prospective multicentre studies with standardized strain acquisition and analysis, quantitative coronary angiography, physiological assessment of coronary lesions, and clinical follow-up are required to validate the observed threshold and determine whether GLS provides incremental diagnostic or prognostic value beyond established clinical, electrocardiographic and biochemical risk-stratification methods.
CONCLUSION:
This retrospective angiographic correlation study demonstrated that two-dimensional Global Longitudinal Peak Systolic Strain (GLS) is a valuable non-invasive echocardiographic parameter for identifying significant coronary artery occlusion in patients presenting with Non-ST Elevation Acute Coronary Syndrome (NSTE-ACS).
Patients with angiographically significant coronary artery stenosis (≥70%) exhibited significantly less negative GLS values than those without significant stenosis, despite having comparable conventional echocardiographic parameters, including left ventricular ejection fraction. Furthermore, GLS progressively deteriorated with increasing severity of coronary artery disease, from single-vessel to triple-vessel involvement, indicating its ability to reflect the extent of myocardial ischaemia. The number of left ventricular segments demonstrating reduced strain also showed excellent diagnostic performance and correlated strongly with significant coronary artery disease.
Receiver operating characteristic analysis demonstrated good diagnostic accuracy of GLS for predicting significant coronary artery stenosis, with a cut-off value of −15.57% providing satisfactory sensitivity and specificity. These findings suggest that GLS may serve as an effective adjunctive screening tool for early identification of patients who are likely to harbour significant coronary occlusion and therefore require prompt invasive coronary angiography. Incorporation of speckle-tracking echocardiographic strain analysis into the routine evaluation of patients with NSTE-ACS may improve early risk stratification, facilitate timely clinical decision-making, and optimise utilisation of invasive diagnostic procedures. Because GLS detects subtle myocardial dysfunction before deterioration of left ventricular ejection fraction becomes apparent, it offers incremental diagnostic value beyond conventional echocardiographic assessment.
Although limited by its retrospective design, relatively small sample size, and single-centre setting, this study provides clinically relevant evidence supporting the role of 2D GLS as an adjunctive imaging biomarker in the assessment of NSTE-ACS. Larger prospective multicentre studies incorporating quantitative coronary angiography, physiological assessment of coronary lesions, and long-term clinical follow-up are warranted to validate the optimal GLS cut-off values and further establish its role in routine clinical practice.
REFERENCES:
1. Collet JP, Thiele H, Barbato E, Barthélémy O, Bauersachs J, Bhatt DL, et al. 2020 ESC Guidelines for the management of acute coronary syndromes in patients presenting without persistent ST-segment elevation. Eur Heart J. 2021;42(14):1289-1367.
2. Amsterdam EA, Wenger NK, Brindis RG, Casey DE Jr, Ganiats TG, Holmes DR Jr, et al. 2014 AHA/ACC guideline for the management of patients with non-ST-elevation acute coronary syndromes. Circulation. 2014;130(25):e344-e426.
3. Antman EM, Cohen M, Bernink PJLM, McCabe CH, Horacek T, Papuchis G, et al. The TIMI risk score for unstable angina/non-ST elevation MI: a method for prognostication and therapeutic decision making. JAMA. 2000;284(7):835-842.
4. Thomas JD, Popović ZB. Assessment of left ventricular function by cardiac ultrasound. J Am Coll Cardiol. 2006;48(10):2012-2025.
5. Voigt JU, Pedrizzetti G, Lysyansky P, Marwick TH, Houle H, Baumann R, et al. Definitions for a common standard for 2D speckle tracking echocardiography: consensus document of the EACVI/ASE/Industry Task Force to standardize deformation imaging. Eur Heart J Cardiovasc Imaging. 2015;16(1):1-11.
6. Nucifora G, Schuijf JD, Delgado V, Bertini M, Scholte AJ, Ng AC, et al. Incremental value of subclinical left ventricular systolic dysfunction for the identification of patients with obstructive coronary artery disease. Am Heart J. 2010;159(1):148-157.
7. Liou K, Negishi K, Ho S, Russell EA, Cranney G, Ooi SY. Detection of obstructive coronary artery disease using peak systolic global longitudinal strain derived by two-dimensional speckle-tracking: a systematic review and meta-analysis. J Am Soc Echocardiogr. 2016;29(8):724-735.e4.
8. Negishi K, Negishi T, Kurosawa K, Hristova K, Popescu BA, Vinereanu D, et al. Practical guidance in echocardiographic assessment of global longitudinal strain. JACC Cardiovasc Imaging. 2018;11(4):489-492.
9. Eek C, Grenne B, Brunvand H, Aakhus S, Endresen K, Smiseth OA, et al. Strain echocardiography predicts infarct size, transmurality and myocardial functional recovery after acute myocardial infarction. Eur Heart J. 2010;31(11):1394-1402.
10. Biering-Sørensen T, Hoffmann S, Mogelvang R, Iversen AZ, Galatius S, Fritz-Hansen T, et al. Myocardial strain analysis by 2-dimensional speckle tracking echocardiography improves diagnostics of coronary artery stenosis in stable angina pectoris. Circ Cardiovasc Imaging. 2014;7(1):58-65.
11. Caspar T, Samet H, Ohana M, Germain P, El Ghannudi S, Talha S, et al. Longitudinal 2D strain can help diagnose coronary artery disease in patients with suspected non-ST-elevation acute coronary syndrome but apparent normal global and segmental systolic function. Int J Cardiol. 2017;236:91-94.
12. Smedsrud MK, Sarvari SI, Haugaa KH, Gjesdal O, Ørn S, Aaberge L, et al. Duration of myocardial early systolic lengthening predicts the presence of significant coronary artery disease. J Am Coll Cardiol. 2012;60(12):1086-1093.
13. Montgomery DE, Puthumana JJ, Fox JM, Ogunyankin KO. Global longitudinal strain aids the detection of non-obstructive coronary artery disease in the resting echocardiogram. Eur Heart J Cardiovasc Imaging. 2012;13(7):579-587.
14. Yingchoncharoen T, Agarwal S, Popović ZB, Marwick TH. Normal ranges of left ventricular strain: a meta-analysis. J Am Soc Echocardiogr. 2013;26(2):185-191.
15. Dahlslett T, Karlsen S, Grenne B, Eek C, Sjøli B, Skulstad H, et al. Early assessment of strain echocardiography can accurately exclude significant coronary artery stenosis in suspected non-ST-segment elevation acute coronary syndrome. J Am Soc Echocardiogr. 2014;27(5):512-519.
16. Cusmà-Piccione M, Zito C, Oreto L, D'Angelo M, Tripepi S, Di Bella G, et al. Longitudinal strain by automated function imaging detects single-vessel coronary artery disease in patients undergoing dipyridamole stress echocardiography. J Am Soc Echocardiogr. 2015;28(10):1214-1221.