Study to assess efficacy of Prognostic Value of Glycated Haemoglobin Percentage Versus Glycated Albumin Percentage among Diabetic ESRD patients on MHD.
- Dr. Kabade D M , Professor, Department of General Medicine, Karnataka Medical College and Research Institute, Hubballi, Karnataka, India.
- Dr. Veeresh B Hubballi , Assistant Professor, Sri Jayadeva Institute of Cardiovascular Sciences and Research Bangalore Karnataka, India,
- Dr. Netra B Hubballi , Associate Professor, Department of PG studies in Kayachikitsa, JSS AYURVEDA MEDICAL COLLEGE MYSURU, Karnataka, India.
Article Information:
Abstract:
Introduction: An epidemic of T2DM is under way in both developed and developing countries.About 20–40% of diabetic patients develop nephropathy. Measuring Glycated Haemoglobin (HbA1c), though a standard method for assessing long-term glycaemic control, is significantly influenced by factors like Uraemia, Anaemia, Proteinuria etc in diabetic patients with advanced CKD on Haemodialysis, while Glycated Albumin (GA) to remains uninfluenced to greater extent. This study compares the efficacy of HbA1c versus GA in assessing the Glycaemic Control and their prognostic values, in diabetic patients with advanced CKD on Haemodialysis. Methodology: Study group was divided into two groups, Cases having patients with advanced Diabetic Kidney Disease (ESRD) and/or on Haemodialysis, while control Group had Diabetic CKD not requiring Haemodialysis. Clinical history and Relevat investigations including HbA1c and GA patients were recorded and analysed. Conclusions: Glycated Haemoglobin is falsely low in diabetic ESRD patients on HD. Glycated Albumin % is a better prognostic indicator compared to Glycated Haemoglobin in terms of mortality among Diabetic ESRD patients on HD.
Keywords:
Article :
INTRODUCTION:
Diabetes Mellitus (DM) refers to a group of common metabolic disorders that share phenotype of hyperglycemia.1 Type II Diabetes Mellitus (T2DM) being predominant form of diabetes worldwide, accounts for 90% of cases globally. An epidemic of T2DM is under way in both developed and developing countries. In 2017, India had estimated 72 million cases of adult Diabetes2 but, as per NCD-RisC study published in 2024 in Lancet, of the world's 828 million adults living with diabetes, India is home to 212 million adults living with diabetes.2, 3 About 20–30% of patients with diabetes develop diabetic nephropathy.20
Measurement of Glycated Haemoglobin (HbA1c) is the standard method for assessing long-term glycaemic control. Constant elevation of plasma glucose increases non-enzymatic glycation of haemoglobin; this alteration reflects the glycaemic history over the previous 2–3 months, aserythrocytes have an average life span of 120 days (with glycaemic level in the preceding month contributes about 50% to the HbA1c value). Measurement of HbA1c at the ―point of care allows for more rapid feedback, therefore, may assist in adjustment of therapy. However factors that shorten Red Blood Cell (RBC) survival, including severe nephropathy, may reduce HbA1c, as time necessary for glucose to chemically bond with RBCs decreases. Clinical conditions such haemoglobinopathies, anaemias, reticulocytosis, transfusions, and uraemia may interfere with the HbA1c results. Moreover, recent studies have shown a discrepancies between the A1C levels among different ethnic groups for similar levels of glycemia, but with not yet well explained reasons 21,22.
The degree of glycation of other proteins, such as albumin, can be used as an alternative indicator of glycaemic control when the HbA1c is inaccurate5,6. Hence it was hypothesized that Glycated Albumin (GA) which is unaffected by the red cell survival time in Chronic kidney disease patients on haemodialysis, is a better indicator of glycaemic control than Glycated haemoglobin.
Glycated Albumin (GA) measures the percentage of serum albumin bound to glucose.4GA is one of the fructosamines having advantage of not being influenced by the concentration of other serum proteins since it is specific to the albumin glycation rates8. Other advantages of GA being, does not require fasting for its measurement, and reflects short-term glycemia due to shorter half life of the albumin, (approximately 3 weeks), compared to A1C, GA is unaffected by the presence of anemia, pregnancy, postprandial hyperglycemia use of insulin, hemolysis and haemoglobinopathies. GA seems to be a better glycemic marker than A1C 11,13 in such conditions and is also especially indicated for diabetic patients on hemodialysis5,6 . Recently, studies on Type 116 and Type 2 DM patients 17 reported an association of GA with the chronic complications of the disease.
Few other studies that evaluated HbA1c as well as GA among diabetic patients on haemodialysis and compared data with diabetic subjects without nephropathy, demonstrated that HbA1c severely underestimated true glucose control relative to the GA assay 5,6. As GA specifically measures the glycation product of albumin; it has been developed as an index for glycaemic control5, however, it is relatively less affected by serum albumin concentration since it is expressed as a ratio to total serum albumin; nevertheless, GA can still be influenced by conditions that alter albumin metabolism, including hypoalbuminemia, hepatic or thyroid disease, and significant proteinuria6. To date, serum GA has been suggested as a more reliable and sensitive glycaemic index to replace HbA1c in diabetic patients with CKD. Thus this study was formulated to compare Glycated Haemoglobin versus Glycated Albumin in terms of their efficacy in assessing the Glycaemic Control, their prognostic values.
METHODOLOGY :
cases and 44 controls), was carried out in the department of Internal Medicine, Karnataka Institute of Medical Sciences,Hubballi. For selection of cases, after obtaining duly informed written consent, all patients with Diabetic ESRD on haemodialysis were screened and for controls, Diabetic patients with Creatinine Values of less than 1.5 mg% ( and NOT on haemodialysis) were considered. Total of 88 patients (44 cases and 44 controls) included in the study and were categorised into case and controll groups applying inclusion and exclusion criteria as mentioned:
Inclusion Criteria :
For Cases:
1. Age > 18 years, both male and female patients
2. Type 1 and Type 2 Diabetes patients
3. Diabetic Nephropathy- End Stage Renal Disease patients on haemodialysis
End Stage Renal Disease was defined by :
• EGFR <15ml/kg/m2 (As per The Cockcroft and Gault formula)
• CCr= (l40 – Age) x Weight) x 0.85 (if female) (72 x Se. Cr.)
Diabetes (Both Type1 and Type2) was defined by :
• FBS > 126 mg/dl
• PPBS > 200 mg/dl
• HbA1c > 6.5%
• History of diabetes with treatment for the same
For Controls:
1. Age > 18 years, both male and female patients
2. Type 1 and Type 2 Diabetes patients
3. Serum creatinine < 1.5 mg/dl
Exclusion Criteria:
Both for Cases and Controls
• Non-diabetic patients
• Haemoglobinopathy
• Anaemia due to causes other than ckd
• Hepatic disorders
• Heavy proteinuria (24 hours urine protein > 3000mg/day)
Only For Cases
· Diabetic ESRD patients on peritoneal dialysis
· Post renal transplantation status
Data Collection
Patients, after obtaining duly informed written consent, were included in the study and categorised into case and controll groups applying inclusion and exclusion criteria. Basic demographical data, detailed medical history and all the releavant investigations of all patients were recorded in a pre designed proforma.
Assessment of Glycated Haemoglobin and Glycated Albumin:
For the assessment of Glycated haemoglobin and Glycated Albumin 10ml of venous blood were collected from all patients. In patients with ESRD requiring Dialysis, Blood was drawn from the dialyzer circuit before the administration of heparin anticoagulants and initiation of haemodialysis. Blood samples were then divided into two parts, 5ml each. First 5ml was transferred into a test tube containi EDTA and was sent to asses HbA1c, while the other 5ml was transferred into plain bulb. Serum from plain bulb was allowed to clot for 10-20 minutes, then centrifuged ( at 2000 RPM) for 20 minutes. The supernatant was collected and stored at minus 80 degree celsius and subjected to assess GA at Medical Research Department of the Institute, using Glycated Albumin ELISA kits, which uses a double-antibody sandwich enzyme-linked immunosorbent one-step process assay (ELISA) to assess the level of Glycated Albumin (GA). Incubation was done after adding the Standard test sample and HRP-labeled Glycated Albumin (GA) antibodies to enzyme wells that were Pre-coated with Glycated Albumin(GA) antibody, and results obtained. Basic demographical data, detailed medical history and all the releavant investigations of all patients were recorded in a pre designed proforma and subjected to statistical analysis using SPSS 22 version software.
RESULTS:
TABLE 1 : Distribution of age (In years) and BMI among Cases Vs Controls
|
AGE |
Type |
(n=) |
Mean |
SD |
Median |
Minimum |
Maximum |
P value |
|
Control |
44 |
56.52 |
12.38 |
58 |
20 |
84 |
0.15 |
|
|
Case |
44 |
52.7 |
11.95 |
54 |
24 |
76 |
|
|
|
BMI |
Type |
(n=) |
Mean |
SD |
Median |
Minimum |
Maximum |
P value |
|
Control |
44 |
26.53 |
2.64 |
26.81 |
16.77 |
32.06 |
<0.00001 |
|
|
Case |
44 |
23.57 |
2.89 |
23.84 |
17.85 |
29.07 |
|
The number of males and females in the control group was 21 and 23 respectively , whereas in the case group there were 33 males and 11 females, indicating Male preponderance (75 % ) among cases whereas marginal female preponderance (52.3%) was seen among controls.
TABLE 2: Comparison, of distribution of Sex, Type of Diabetes and Type of Treatment being recieved among Cases Vs Controls.*
TABLE 2: Showing Comparison, among Cases Vs Controls,* of distribution of Sex, Type of Diabetes and Type of Treatment being recieved
Majority of our study group patients, cases and controls combined, were Type II Diabetics 84 out 88 (95.45%). Each group, the case and control, had only two patients of Type 1 Diabetes. In Majority of the patients (33%), duration of diabetes was in the range of 3.1 to 6 years. Only 17 out of 88 (19.31%) patients had duration of diabetes between 6.1 to 9 years. The Mean duration of diabetes among cases and controls was 8.82 years and 4.76 years respectively
Among cases, 93.2% (41 out of 44) patients were on Insulin while remaining 3 (6.81%) patients were deferred from anti-diabetic treatment due to frequent hypoglycaemic episodes. In ESRD the elimination of the insulin will be reduced, hence in the later stages patients will be prone for hypoglycaemic episodes. Among control group, majority of patients, 37 out of 44, (84.1 %) were on OHA, 4 (9%) of patients were on Insulin only while 2 (4.5%) were on both insulin and OHA. One patient was non-compliant with the treatment. Mean BMI among cases was 23.57 Kg/m2 whereas among controls it was 26.53 Kg/m2
Mean Haemoglobin (12.45±1.49) and S.Albumin (3.01± O.31) levels were significantly higher in controls than cases, with Mean Haemoglobin being 8.6± 1.76, while Mean Se. Albumin being 2.8±0.279. Higher levels of Mean Se. Creatinine levels were observed in cases (8.42±2.94) compared to controls, with a Mean Se Creatinine levels being 0.77±0.13. Meam of estimated GFR among cases was 10.87ml/min/1.73m2, while in control group it was 98.01 ml/min/1.73m2 respectively.
Mean values of Fasting blood sugar, postprandial blood sugar and average blood sugar among cases was observed to be 159.91mg/dl, 228.32 mg/dl and 196.02 mg/dl respectively, where as among controls it was 178.86mg/dl, 253.07mg/dl and 208.09 mg/dl respectively. Although Sugar values observed among cases were higher, compared to controls, but were found to be statistically insignificant. Mean HbA1c was found to be significantly low among cases (6.77%) compared to controls (7.6%).
TABLE 4: Comparison of Distribution of Various Glycaemic Control Parameters Among Cases Vs Controls
|
Parameter |
Type |
Mean |
SD |
Median |
Minimum |
Maximum |
P value |
|
Fasting Blood Sugar |
Case |
159.91 |
52.71 |
165.5 |
54 |
242 |
|
|
Control |
178.86 |
77.23 |
182 |
84 |
501 |
0.45 |
|
|
Post Prandial Blood Sugar |
Case |
228.32 |
54.16 |
242.5 |
104 |
364 |
|
|
Control |
253.07 |
89.36 |
224 |
124 |
494 |
0.66 |
|
|
Average Blood Sugar |
Case |
196.02 |
45.49 |
192 |
98 |
286 |
|
|
Control |
208.09 |
66.76 |
186.5 |
112 |
421 |
0.69 |
|
|
Hba1c |
Case |
6.77 |
0.952 |
6.6 |
5.1 |
8.9 |
0.002 |
|
Control |
7.6 |
1.53 |
7.2 |
6.2 |
12.8 |
|
|
|
Glycated Albumin Ng/Ml |
Case |
326.35 |
43.3 |
328.72 |
234.12 |
398.45 |
0.0017 |
|
Control |
352.12 |
39.84 |
364.49 |
256.32 |
398.65 |
|
|
|
Glycated Albumin % |
Case |
25.6 |
4.32 |
25.95 |
16.87 |
33.03 |
0.3 |
|
Control |
26.58 |
4.96 |
26.46 |
17.62 |
34.94 |
|
TABLE 4 : Shows Comparison of Distribution of Various Glycaemic Control Parameters Among Cases Vs Controls.
TABLE 5: Comparison of Correlation Coefficient Among Cases V/S Control.
|
S.No. |
Parameters to be Compared |
Correlation (r) |
|
|
Control |
Case |
||
|
01 |
Average Blood Sugar Vs Glycated Hemoglobin % |
0.401 |
0.456 |
|
02 |
Average Blood Sugar Vs Glycated albumin (ng/dl) |
0.482 |
0.441 |
|
03 |
Average Blood Sugar Vs Glycated albumin percentage |
0.652 |
0.542 |
|
04 |
Average Blood Sugar Vs Glycated albumin to Hemoglobin ratio |
0.311 |
0.210 |
|
05 |
Glycated Albumin % Vs Glycated Hemoglobin % |
0.499 |
0.611 |
TABLE 5: Shows Comparison of Correlation Coefficient Among Cases V/S Control.
Supporting this finding was the ratio of Glycated Albumin % to Glycated Haemoglobin which was 3.8 among the cases and 3.51 in controls, inferring falsely low HbA1c among cases compared to controls.
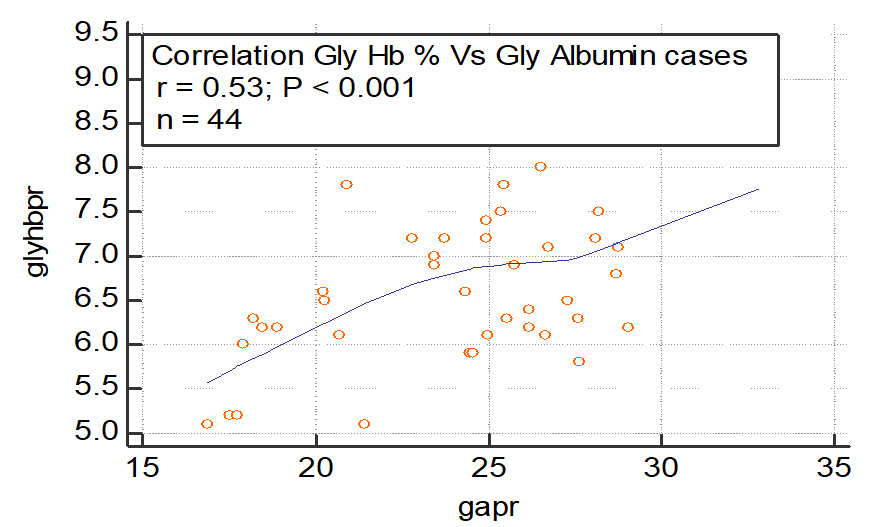
FIGURE 1: Shows correlation between Glycated Haemoglobin versus Glycated Albumin among Cases
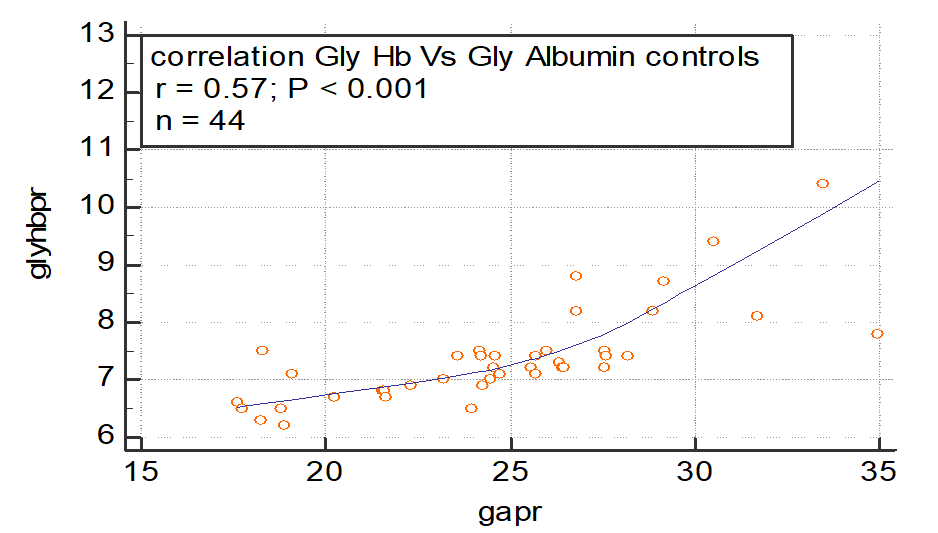
FIGURE 2 : Shows correlation between Glycated Haemoglobin versus Glycated Albumin among Controls
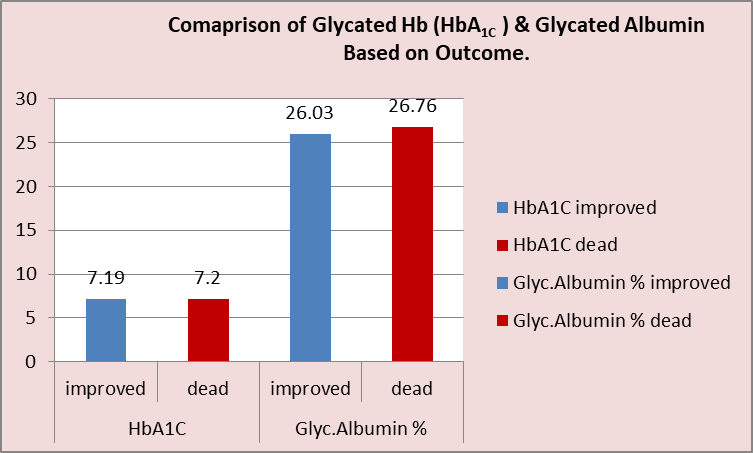
Fig 3: Bar Graph Showing Comaprison of Glycated (HbA1C ) & Glycated Albumin Based on Outcome.
Multivariate analysis of various factors predicting blood sugar values clearly showed Glycated albumin % is better and statistically significant compared to HbA1c. In our study, (Fig. 1) on comparing the predictive value of Glycated Haemoglobin versus Glycated Albumin, in terms of mortality among patients with Diabetic ESRD on Haemodialysis, Glycated Albumin (p=0.69) was found to be better prognostic marker compared to HbA1C (0.9) but not statistically significant.
DISCUSSION:
Majority of the patients in our study, 49 out of 88 (55.7%), belonged to the age group of 41-60. Only one patient’s age in our study group was less than 20 years. Mean age among cases being 52.7 ± 11.95 years while in controls, 56.52 ± 12.38 years. The difference of mean age group between cases and control group in our study was comparable similar other studies8,9. Male preponderance 75 % was observed among cases while female preponderance 52.3% was seen among controls in our study which could be due to random selection of the patients and constraints of time bound single center study. However, matching differences were also observed in some of the similar studies by Peacock et al6, Freedman et al11 and Dawlat et al10.
In our study the mean duration of diabetes among majority of the patients (33%) was in the range of 3.1 to 6 years, only in 19.31 % (17 out of 88) of patients the mean duration of diabetes ranged between 6.1 to 9 years. Greater the duration of diabetes, higher the risk of diabetic complications including Diabetic Nephropathy being a fact established by numerous studies, the observations in our study groups too, were in accordance, as the mean duration of diabetes among cases in our study was 8.8 years whereas that of control group was 4.76 years, and corresponded with similar findings in studies by Peacock et al6 and Freedman et al11. Mean Serum creatinine was on higher side in cases group, compared to controls in present study, a finding similar to other studies by Peacock et al6, Freedman et al11 and Dawlat et al10.
The mean creatinine clearance (CrCl) in our study was found to be 10.87± 3.47 mL/min among cases versus 98.01 ± 10.25 mL/min among controls, an observation that was comparable with that of a study by Dawlat et al. Cachexia is a common occurring due to various mechanisms among ESRD patients, hence the mean BMI was found to be more (26.53 kg/m2) among control group of non-ESRD patients, compared to cases group, 23.57 kg/m2 that included patients with ESRD. Our findings were comparable with that of study by Dawlat S et al. Chronic illness, loss of appetite, poor absorption of iron and blood loss etc are the various factors which contribute to anemia in such patients, a finding that was appropriately observed in present study too. The mean Hemoglobin was found to be low, 8.6 + 1.76 gm/dl in cases group compared to 12.45 + gm/dl among controls.These findings corresponded to studies by Peacock et al6 and Dawlat S. et al10.
In study by Peacock et al6, the mean Serum Albumin among cases was found to be 3.7± 0.4 gm/dl, while among controls, it was 4.0 ± 0.6 gm/dl. among controls. In study by Dawlat et al cases had 6.9 ± 0.6gm/dl while controls had 7.3 ± 0.26gm/dl of mean serum Albumin. In the present study too the mean Serum Albumin was observed to be less among cases, 2.8 ± 0.279 gm/dl, compared to 3.01 ± 0.31gm/dl among controls, indicating the effect of proteinuria found among diabetic nephropathy patients.
Reduced Renal clearance of Oral Antidiabetic Medications (OHAs) and Insulin leading to prolonged medication effects, decreased Renal Gluconeogenesis, Malnutrition and Glycogen depletion and Burnt-out-Diabetes are the factors for altered Glucose metabolism in patients with Chronic Kidney Disease leading to lower concentrations of sugars in the blood.
In accordance with this, the patients of our control group had higher mean value of Average Blood Sugars 208.09 ± 66.76, compared to cases group, wherein mean ABG being 196.02 ± 45.49. These findings were corresponded to study by Dawlat et al,with mean blood sugar among controls being 146.5 ± 35 while among cases being146.5 ± 35. In study by Peacock et al6, mean serum glucose concentrations were higher (172 among controls without CKD vs 146 mg per 100 ml among cases group. To estimate Mean Blood Sugar, other studies took the RBS of preceding 3 months into consideration while in the present study, FBS ,PPBS and Mean Blood Sugar (average of three RBSs recordings of the patient within one month) were considered, which is theoretically more accurate.
In patients with CKD and advance renal disease, factors like Renal Anaemia and Haemolysis, and Haemodialysis bring down the average lifespan of RBCs from 120 days to 40 to 60 days, and enhanced Erythropoiesis leading to domination of young RBC population significantly affect the Glycation of Haemoglobin. Similarly factors like Carbamylation, wherein the elevated Blood Urea breaks down into cyanate (process known as Carbamylation) which then competes with glucose while binding at specific aminoacid site in haemoglobin, resulting in lower Glycation of Glucose and its values. Factors like Burnt-out-Diabetes-Effect, decreased clearance of Insulin and OHAs, decreased Gluconeogenesis and Malnutrition also alter Glycation of sugars in such patients. Hence the HbA1c levels are expected to be lower in patients with CKD and advance renal disease.
In our study too, the mean HbA1c was lower among cases group (6.7), compared to (7.6) in the control group. The results were similar to the studies done by Peacock et al6 and Freedman et al11 wherein the HbA1c was lower among the cases compared to controls. Albumin has a faster half-life than hemoglobin,Glycated Albumin (GA) shows recent glucose changes better than an HbA1c test. It reflects 2 -3 weeks of blood sugars and unaffected by blood issues likeanemia, hemoglobin variants, or recent blood transfusions that influence HbA1c results.5, 6, 7, In the present study, GA% did not differ significantly between cases and controls (25.60 ± 4.32 vs 26.58 ± 4.96, p=0.30), whereas HbA1c was significantly lower among cases. Consequently, the GA/HbA1c ratio was higher among cases (3.8) than controls (3.51), consistent with underestimation of glycaemic status by HbA1c rather than a true elevation in GA. This pattern was similar to the studies done by Peacock et al6 and Freedman et al11, wherein HbA1c was similarly lower among cases despite comparable glycaemic exposure.
Thus our observations suggest that HbA1c may be impacted by advanced kidney disease (ESRD) and Haemodialysis, raising questions about its accuracy in such patients. Our findings support previous observations that HbA1c may underestimate glycaemic status in patients with advanced kidney disease receiving haemodialysis, relative to serum glucose concentrations and GA. Theoretically, proteinuria can impact GA% based upon reduced exposure of serum albumin to glucose. Freedman et al addressed this issue by comparing GA%/HbA1c in 15 anuric diabetic patients lacking proteinuria (mean ± SD 2.71 ± 0.63, median 2.58) with that in 12 diabetic patients with urine output exceeding 1 L per day (2.81 ± 0.68, median 2.92). Significant differences were not seen in GA%/HbA1c between these groups (p = 0.49), suggesting that proteinuria did not contribute to the results. The present study also showed a negative correlation coefficient between GA and S. albumin.
In our study, on comparing Glycated Haemoglobin and Glycated Albumin in relation to mortality among patients with Diabetic ESRD on Haemodialysis, neither Glycated Albumin (p=0.69) nor HbA1C (p=0.9) reached statistical significance in this exploratory, unadjusted comparison. Similarly in a study done by Hoshino et al19 there was a linear or J-shaped association between GA and 1-year mortality, with the lowest mortality at GA 15.6–18.2%. Furthermore analysessuggested the potential superiority of GA over HbA1c in predicting mortality. According to Freedman et al11, in contrast to the HbA1c and random serum glucose values, GA accurately predicts the risk of death and hospitalizations in patients with diabetes mellitus and ESRD.
CONCLUSION:
In this study, HbA1c levels were significantly lower among patients with diabetes and ESRD receiving haemodialysis than among diabetic controls, despite no significant difference in GA%. The higher GA/HbA1c ratio in the haemodialysis group suggests that HbA1c may underestimate glycaemic exposure in this population. GA may provide complementary information when HbA1c interpretation is affected by altered red-cell turnover; however, larger prospective studies with standardized outcome assessment are required before recommending GA as a replacement for HbA1c. The enzymatic GA assay used in this study is simple, rapid, and readily standardized, supporting its feasibility for clinical use alongside HbA1c.
Despite all benefits, one should not replace the use of HbA1C with GA, as each test has its advantages and limitations.The choice regarding which test to use should be guided by the patients’ clinical parameters and availability of tests. Further multicentric multivariate studies involving larger study groups are essential to substantiate these findings and arrive at consensusregarding its inclusion in routine laboratory profile of diabetic patients with advanced kidney disease including those on haemodialysis.
LIMITATIONS:
The major limitations of the study include its short-term, single-centric design and small number of cases from a limited geographical area. The control group was not matched for age, BMI, haemoglobin, or duration of diabetes, and these baseline differences may have influenced HbA1c and GA independently of renal status. The mortality comparison was exploratory and unadjusted, without a defined follow-up period or multivariable survival model, and should be interpreted accordingly. Standardization of the GA assay and its correlation with GA expressed in ng/mL also warrant further clarification in future studies.
Further multicentric multivariate studies involving larger study groups are essential to substantiate these findings, establish the comparative efficacy of HbA1c versus GA in predicting the longterm outcomes with greater accuracyand arrive at consensusregarding its inclusion in routine laboratory profile of diabetic patients with advanced kidney disease including those on haemodialysis.
REFERENCES:
1. Kasper, D Fauci, A., Hauser, S., Longo, D.,Jameson, J and Loscalzo, J(2015). Harrison’s Principles of Internal Medicine. 19th edition New York: McGraw-Hill Professional Publishing Chapter 417 pp 2399
2. International Diabetes Federation. IDF. Diabetes Atlas 2021. IDF Atlas 10thedition. Available at:
3. https://diabetesatlas.org/atlas/tenth-edition/.Accessed on 13th January 2025
4. NCD Risk Factor Collaboration (NCD-RisC). Worldwide trends in diabetes prevalence and treatment from 1990 to 2022: a pooled analysis of 1108population-representative studies with 141 million participants. Lancet 2024; 404: 2077– 2093. )
5. Kasper, D Fauci, A., Hauser, S., Longo, D.,Jameson, J and Loscalzo, J(2015). Harrison’s Principles of Internal Medicine. 19th edition New York: McGraw-Hill Professional Publishing Chapter 418 pp 2410
6. Inaba M, Okuno S, Kumeda Y, Yamada S, Imanishi Y, Tabata T, Okamura M, Okada S, Yamakawa T, Ishimura E, Nishizawa Y. Glycated albumin is a better glycaemic indicator than glycatedhemoglobin values in hemodialysis patients with diabetes: effect of anemia and erythropoietin injection. Journal of the American Society of Nephrology. 2007 Mar 1;18(3):896-903.
7. Peacock TP, Shihabi ZK, Bleyer AJ, Dolbare EL, Byers JR, Knovich MA, Calles-Escandon J, Russell GB, Freedman BI. Comparison of glycated albumin and hemoglobin A1c levels in diabetic subjects on hemodialysis. Kidney international. 2008 May 1;73(9):1062-8.
8. Guthrow CE, Morris MA, Day JF, Thorpe SR, Baynes JW. Enhanced nonenzymaticglucosylation of human serum albumin in diabetes mellitus. Proceedings of the National Academy of Sciences. 1979 Sep 1;76(9):4258-61.
9. Koga M. 1, 5-Anhydroglucitol and glycated albumin in glycemia. In Advances in clinical chemistry 2014 Jan 1 (Vol. 64, pp. 269-301). Elsevier.
10. Abidin D, Liu L, Dou C, Datta A, Yuan C. An improved enzymatic assay for glycated serum protein. Analytical Methods. 2013;5(10):2461-9.
11. Sany D, Elshahawy Y, Anwar W. Glycated albumin versus glycatedhemoglobin as glycaemic indicator in hemodialysis patients with diabetes mellitus: variables that influence. Saudi Journal of Kidney Diseases and Transplantation. 2013 Mar 1;24(2):260.
12. Freedman BI, Andries L, Shihabi ZK, Rocco MV, Byers JR, Cardona CY, Pickard MA, Henderson DL, Sadler MV, Courchene LM, Jordan JR. Glycated albumin and risk of death and hospitalizations in diabetic dialysis patients. Clinical journal of the American Society of Nephrology. 2011 Jul;6(7):1635-43.
13. Bando Y, Kanehara H, Toya D, Tanaka N, Kasayama S, Koga M. Association of serum glycated albumin to haemoglobin A1C ratio with hepatic function tests in patients with chronic liver disease. Annals of clinical biochemistry. 2009 Sep;46(5):368-72.
14. Koga M, Murai J, Saito H, Kasayama S. Glycated albumin and glycatedhemoglobin are influenced differently by endogenous insulin secretion in patients with type 2 diabetes. Diabetes care. 2010 Feb 1;33(2):270-2.
15. Bando Y, Kanehara H, Aoki K, Toya D, Notsumata K, Tanaka N, Enomoto H, Nishiguchi SH, Nakasho K, Nakamura H, Kasayama S. The glycated albumin to glycated haemoglobin ratio increases along with the fibrosis stage in non-alcoholic steatohepatitis. Annals of Clinical Biochemistry. 2012 Jul;49(4):387-90.
16. Takahashi S, Uchino H, Shimizu T, Kanazawa A, Tamura Y, Sakai K, Watada H, Hirose T, Kawamori R, Tanaka Y. Comparison of glycated albumin (GA) and glycatedhemoglobin (HbA1c) in type 2 diabetic patients: usefulness of GA for evaluation of short-term changes in glycaemic control. Endocrine journal. 2007;54(1):139-44.
17. Saisho Y, Tanaka K, Abe T, Shimada A, Kawai T, Itoh H. Glycated albumin to glycatedhemoglobin ratio reflects postprandial glucose excursion and relates to beta cell function in both type 1 and type 2 diabetes. Diabetology international. 2011 Oct 1;2(3):146-53.
18. Ogawa A, Hayashi A, Kishihara E, Yoshino S, Takeuchi A, Shichiri M. New indices for predicting glycaemic variability. PLoS One. 2012 Sep 27;7(9):e46517.
19. Song SO, Kim KJ, Lee BW, Kang ES, Cha BS, Lee HC. Serum glycated albumin predicts the progression of carotid arterial atherosclerosis. Atherosclerosis. 2012 Dec 1;225(2):450-5.
20. Hoshino J, Hamano T, Abe M, Hasegawa T, Wada A, Ubara Y, Takaichi K, Inaba M, Nakai S, Masakane I. Glycated albumin versus hemoglobin A1c and mortality in diabetic haemodialysis patients: a cohort study. Nephrology Dialysis Transplantation. 2018 Jul 1;33(7):1150-8.
21. American Diabetes Association. Nephropathy in diabetes. Diabetes Care. 2004 Jan;27(suppl 1):S79-83.
22. Selvin E, Steffes MW, Ballantyne CM, Hoogeveen RC, Coresh J, Brancati FL. Racial differences in glycemic markers: a cross-sectional analysis of community-based data. Ann Intern Med. 2011;154(5):303-9.
23. Ziemer DC, Kolm P, Weintraub WS, Vaccarino V, Rhee MK, Twombly JG, et al. Glucose-independent, black-white differences in hemoglobin A1c levels: a cross-sectional analysis of 2 studies. Ann Intern Med. 2010;152(12):770-7.