Relationship between Screen Time, Sleep Quality, and Academic Performance Among School-Going Children.
- Altaf Naseem , Professor, Department of Pediatrics, Apollo Institute of Medical Sciences and Research, Hyderabad, Telangana, India
- Madhavi cowta , Consultant Neuro Developmental Pediatrician, Department of Pediatrics, Apollo Institute of Medical Sciences and Research, Hyderabad, Telangana, India
- Srikrishna Surampudi , Professor, Department of Pediatrics, Apollo Institute of Medical Sciences and Research, Hyderabad, Telangana, India
Article Information:
Abstract:
Background: Excessive recreational screen exposure has become common among school-age children and may compete with sleep and study time. The combined relationship of screen use, sleep quality, and academic achievement is clinically relevant but remains incompletely described in Indian school-going children. The study is designed to examine the association of daily recreational screen time with sleep quality and academic performance, and to assess whether poor sleep was independently related to lower academic scores. Methods: A cross-sectional study was conducted by the Department of Pediatrics, Apollo Institute of Medical Sciences and Research, Hyderabad, from March 2025 to February 2026. School-going children aged 10-16 years were assessed for recreational screen exposure, bedtime device use, Pittsburgh Sleep Quality Index (PSQI) score, sleep duration, physical activity, and most recent examination percentage. Screen time was grouped as <2, 2-4, and >4 h/day. A PSQI score >5 denoted poor sleep quality. Chi-square tests, ANOVA, Pearson correlation, and multivariable linear regression were used. Results: Among 420 children (mean age 13.0+/-1.9 years; 50.7% boys), mean screen time was 2.84+/-1.23 h/day and 41.7% had poor sleep quality. Poor sleep increased from 10.5% in the <2 h/day group to 72.2% in the >4 h/day group (chi-square=73.54, P<0.001). Mean academic score decreased from 81.0% to 66.0% across the same categories (F=65.32, P<0.001). Screen time correlated positively with PSQI (r=0.594) and inversely with academic score (r=-0.537; both P<0.001). After adjustment, each additional hour of screen time was associated with a 3.80-point lower academic score, while poor sleep was associated with a 2.95-point lower score. Conclusion: Higher recreational screen exposure was associated with poorer sleep and lower academic performance. The findings support routine pediatric counselling on screen boundaries, bedtime device habits, and age-appropriate sleep as part of school health promotion.
Keywords:
Article :
INTRODUCTION:
Digital devices have become embedded in the daily routines of children for entertainment, communication, learning, and social interaction. The clinical concern is not the presence of technology itself, but the possibility that prolonged or poorly timed recreational use displaces sleep, physical activity, face-to-face interaction, and focused study. Indian Academy of Pediatrics guidance has therefore emphasized age-appropriate screen limits, family media rules, and protection of sleep and other essential activities [1]. Similar recommendations from the American Academy of Pediatrics and the World Health Organization encourage balanced media habits and reduced recreational sedentary screen exposure [2-4].
Sleep is particularly vulnerable to evening and bedtime screen use. Several mechanisms may operate together: screens can delay bedtime by simple time displacement, interactive or emotionally engaging content can increase cognitive arousal, notifications can fragment sleep, and light exposure may alter circadian timing [5-12]. Systematic reviews have repeatedly found that heavier screen use is associated with later sleep onset, shorter sleep duration, and poorer subjective sleep, although more recent within-person analyses suggest that the effect size varies by timing and type of screen activity [6-16].
The educational consequences are also important. Academic performance depends on sustained attention, working memory, executive control, and effective encoding and consolidation of newly learned material. Excessive recreational media may interfere directly by competing with homework and indirectly through sleep loss or daytime sleepiness. A systematic review and meta-analysis found adverse associations between several forms of screen media and academic outcomes in children and adolescents [17]. Meta-analytic work on sleep has similarly shown that poor sleep quality, insufficient sleep, and sleepiness are related to weaker school performance [18-20].
Evidence from India is growing but remains heterogeneous. Studies have described short sleep, poor sleep hygiene, bedtime media use, and problematic mobile use among Indian adolescents, with variable associations with school achievement [21-25]. Local data are therefore useful because device access, school schedules, family supervision, academic demands, and cultural routines differ across settings.
The present study examined the relationship between recreational screen time, sleep quality, and academic performance among school-going children. The primary objective was to compare sleep quality and academic performance across categories of daily screen exposure. Secondary objectives were to quantify correlations among screen time, sleep measures, and examination scores, and to determine whether screen exposure and poor sleep remained associated with academic performance after adjustment for selected covariates.
MATERIALS AND METHODS:
Study design and setting
A cross-sectional analytical study was conducted by the Department of Pediatrics, Apollo Institute of Medical Sciences and Research, Hyderabad, Telangana, India, from March 2025 to February 2026. Data collection was undertaken among school-going children encountered through school health and pediatric health-screening activities linked to the department.
Study population
Children aged 10-16 years who were attending regular school and whose parent or legal guardian provided written informed consent were considered eligible. Assent was obtained from children according to age and institutional requirements. Children with a diagnosed neurodevelopmental disorder, severe visual or hearing impairment that substantially altered routine screen use, a chronic medical illness known to disturb sleep, current use of sedative medication, or an acute illness at the time of assessment were excluded. Participants with incomplete screen-time, PSQI, or academic-performance data were not included in the final analysis.
Sample size and sampling
The minimum sample size was estimated using a single-proportion approach with an anticipated poor-sleep prevalence of 40%, 95% confidence, and 5% absolute precision. This yielded approximately 369 participants. Allowing for incomplete responses and subgroup comparisons, a target of at least 410 children was set. A total of 420 complete participant were included in the study. Participants were recruited consecutively during the study period until the target sample was achieved.
Screen-time assessment
Recreational screen exposure was assessed using a structured, pretested questionnaire that recorded time spent on smartphones, tablets, television or streaming devices, computers, and gaming consoles outside compulsory schoolwork. Weekday and weekend exposure were recorded separately and a weighted daily average was calculated as [(weekday hours x 5) + (weekend hours x 2)]/7. For the primary analysis, children were classified into <2 h/day, 2-4 h/day, and >4 h/day groups. Screen use during the hour before attempted sleep was recorded as a separate bedtime-screen variable. The operational approach was aligned with pediatric digital-wellness guidance that emphasizes limitation of recreational screen exposure and protection of sleep [1-3].
Assessment of sleep
Sleep quality during the preceding month was assessed with the Pittsburgh Sleep Quality Index (PSQI), which generated a global score from seven sleep components. The PSQI had established validity for assessing subjective sleep quality and had also been evaluated in adolescent samples [26, 27]. A global PSQI score >5 was used to classify poor sleep quality for the primary analysis. Usual school-night sleep duration was recorded in hours from reported sleep onset to final awakening, excluding prolonged nocturnal wake periods. Age-appropriate sleep needs were interpreted with reference to American Academy of Sleep Medicine recommendations [28].
Academic performance
Academic performance was obtained from the percentage score documented in the most recent completed school examination or term assessment, with parental permission and, where available, verification from the school record or report card. Scores were analyzed as a continuous percentage and were also categorized as high (>=75%), average (60-74%), and low (<60%) for descriptive comparisons. These categories were used as study-defined analytical bands and were not intended as universal educational standards.
Other study variables
Age, sex, daily physical activity, and bedtime screen use were recorded because they could influence screen habits, sleep, or educational performance. Daily physical activity was estimated as the average number of minutes spent in active outdoor play, sport, or other moderate-to-vigorous activity.
Data collection and quality control
A uniform data collection form was administered by trained study personnel. Children and parents were asked to report typical behavior rather than use on a single day. Questionnaires were checked on the same day for missing responses. Academic percentages were entered independently from the sleep score to reduce interpretation bias during data entry. Data were reviewed for impossible values and range errors before analysis.
Ethical considerations
The study protocol was approved by the Institutional Ethics Committee of Apollo Institute of Medical Sciences and Research, Hyderabad. Written informed consent from a parent or legal guardian and age-appropriate assent from the child were obtained before participation. Personal identifiers were separated from the analytical dataset, and confidentiality of school records was maintained.
Statistical analysis
Data were analyzed using descriptive and inferential statistics. Continuous variables were summarized as mean and standard deviation, while categorical variables were expressed as frequency and percentage. Differences in categorical outcomes were tested with Pearson chi-square tests. Mean PSQI, sleep duration, and academic scores across screen-time categories were compared by one-way analysis of variance. Pearson correlation coefficients were used to assess relationships among continuous screen time, PSQI score, sleep duration, and academic percentage. A multivariable linear regression was fitted with academic percentage as the dependent variable and screen time, poor sleep status, age, sex, physical activity, and bedtime screen use as predictors. Regression coefficients were reported with 95% confidence intervals. All tests were two-sided and P<0.05 was considered statistically significant.
RESULTS:
Participant profile and overall exposure
A total of 420 school-going children were included. Their mean age was 13.0+/-1.9 years, and 213 (50.7%) were boys. Mean recreational screen time was 2.84+/-1.23 h/day. Overall, 105 (25.0%) children reported <2 h/day, 236 (56.2%) reported 2-4 h/day, and 79 (18.8%) reported >4 h/day. Bedtime screen use was reported by 187 (44.5%). Mean PSQI score was 4.62+/-2.01; 175 children (41.7%) met the study definition of poor sleep quality. The mean academic score was 73.8+/-10.2% (Table 1).
Table 1: Baseline profile of the study population (n=420)
|
Characteristic |
Value |
Summary |
|
Age, years |
13.0 +/- 1.9 |
Mean +/- SD |
|
Boys |
213 (50.7%) |
n (%) |
|
Girls |
207 (49.3%) |
n (%) |
|
Recreational screen time, h/day |
2.84 +/- 1.23 |
Mean +/- SD |
|
Screen time <2 h/day |
105 (25.0%) |
n (%) |
|
Screen time 2-4 h/day |
236 (56.2%) |
n (%) |
|
Screen time >4 h/day |
79 (18.8%) |
n (%) |
|
Bedtime screen use |
187 (44.5%) |
n (%) |
|
Daily physical activity, min/day |
67.0 +/- 21.2 |
Mean +/- SD |
|
PSQI global score |
4.62 +/- 2.01 |
Mean +/- SD |
|
Poor sleep quality (PSQI >5) |
175 (41.7%) |
n (%) |
|
School-night sleep duration, h |
8.30 +/- 0.86 |
Mean +/- SD |
|
Academic score, % |
73.8 +/- 10.2 |
Mean +/- SD |
|
High academic performance (>=75%) |
198 (47.1%) |
n (%) |
|
Average academic performance (60-74%) |
181 (43.1%) |
n (%) |
|
Low academic performance (<60%) |
41 (9.8%) |
n (%) |
SD: standard deviation; PSQI: Pittsburgh Sleep Quality Index. Percentages may not total 100 because of rounding
Screen time and sleep quality
A clear gradient was observed between screen exposure and sleep. Poor sleep quality was present in 11 of 105 children (10.5%) with <2 h/day of screen time, 107 of 236 (45.3%) with 2-4 h/day, and 57 of 79 (72.2%) with >4 h/day (chi-square=73.54, df=2, P<0.001). Mean PSQI increased from 2.93 to 6.29 across the same categories (F=95.38, P<0.001), whereas mean school-night sleep duration decreased from 8.95 to 7.63 hours (F=74.42, P<0.001). Bedtime screen use also became more frequent as overall screen exposure increased (chi-square=15.70, P<0.001) (Table 2, Figure 1).
Table 2: Sleep outcomes according to daily recreational screen time
|
Sleep variable |
<2 h/day (n=105) |
2-4 h/day (n=236) |
>4 h/day (n=79) |
Test statistic |
P value |
|
PSQI score, mean +/- SD |
2.93 +/- 1.56 |
4.81 +/- 1.65 |
6.29 +/- 1.83 |
F=95.38 |
<0.001 |
|
Poor sleep quality, n (%) |
11 (10.5%) |
107 (45.3%) |
57 (72.2%) |
chi-square=73.54 |
<0.001 |
|
Sleep duration, h, mean +/- SD |
8.95 +/- 0.76 |
8.23 +/- 0.74 |
7.63 +/- 0.72 |
F=74.42 |
<0.001 |
|
Bedtime screen use, n (%) |
32 (30.5%) |
108 (45.8%) |
47 (59.5%) |
chi-square=15.70 |
<0.001 |
PSQI: Pittsburgh Sleep Quality Index; SD: standard deviation. One-way ANOVA was used for continuous outcomes and Pearson chi-square test for categorical outcomes. Poor sleep was defined as PSQI >5
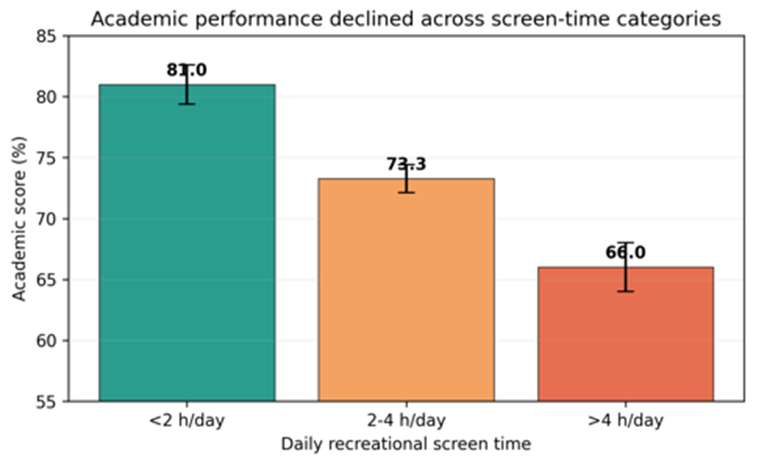
Figure 1: Prevalence of poor sleep quality across categories of recreational screen exposure. The between-group association was significant (chi-square=73.54, P<0.001)
Screen time and academic performance
Academic performance worsened progressively across higher screen-time categories. Mean examination scores were 81.0+/-8.4%, 73.3+/-9.0%, and 66.0+/-9.1% in the <2, 2-4, and >4 h/day groups, respectively (F=65.32, P<0.001). High academic performance was recorded in 78.1% of children in the <2 h/day group but in only 19.0% of those in the >4 h/day group. Conversely, low performance increased from 1.0% to 26.6% (chi-square=83.83, df=4, P<0.001) (Table 3, Figure 2).
Table 3: Academic performance according to daily recreational screen time
|
Academic outcome |
<2 h/day (n=105) |
2-4 h/day (n=236) |
>4 h/day (n=79) |
Test statistic |
P value |
|
Academic score, %, mean +/- SD |
81.0 +/- 8.4 |
73.3 +/- 9.0 |
66.0 +/- 9.1 |
F=65.32 |
<0.001 |
|
High (>=75%) |
82 (78.1%) |
101 (42.8%) |
15 (19.0%) |
chi-square=83.83 |
<0.001 |
|
Average (60-74%) |
22 (21.0%) |
116 (49.2%) |
43 (54.4%) |
|
|
|
Low (<60%) |
1 (1.0%) |
19 (8.1%) |
21 (26.6%) |
|
|
Academic categories were study-defined analytical bands. ANOVA tested the continuous score; a single Pearson chi-square test (chi-square=83.83, df=4, P<0.001) compared the 3 x 3 distribution of academic categories
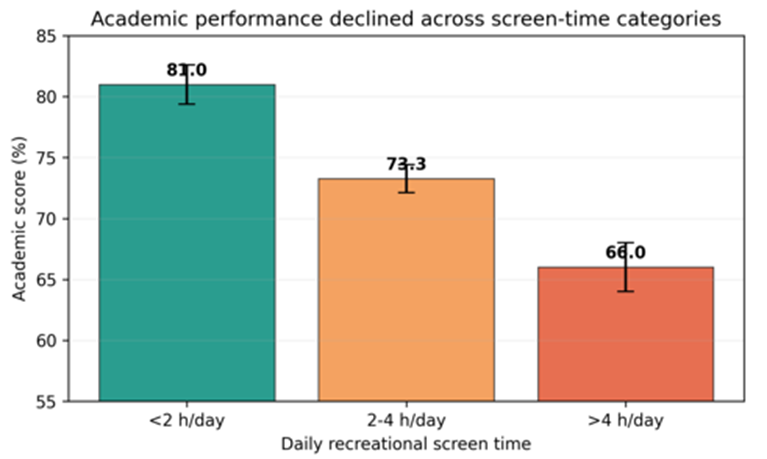
Figure 2: Mean academic score by daily recreational screen-time category. Error bars show 95% confidence intervals; overall ANOVA F=65.32, P<0.001
Sleep quality and academic performance
Children with poor sleep had a mean academic score of 69.2+/-10.2%, compared with 77.1+/-8.8% among good sleepers (Welch t=8.34, P<0.001). Low academic performance was present in 20.0% of poor sleepers but only 2.4% of good sleepers, while high performance was recorded in 28.6% and 60.4%, respectively (chi-square=58.99, df=2, P<0.001).
Table 4: Academic performance according to sleep quality
|
Academic outcome |
Good sleep, PSQI <=5 (n=245) |
Poor sleep, PSQI >5 (n=175) |
Test statistic |
P value |
|
Academic score, %, mean +/- SD |
77.1 +/- 8.8 |
69.2 +/- 10.2 |
t=8.34 |
<0.001 |
|
High (>=75%) |
148 (60.4%) |
50 (28.6%) |
chi-square=58.99 |
<0.001 |
|
Average (60-74%) |
91 (37.1%) |
90 (51.4%) |
|
|
|
Low (<60%) |
6 (2.4%) |
35 (20.0%) |
|
|
PSQI: Pittsburgh Sleep Quality Index. Welch independent-samples t test was used for mean academic score. A single Pearson chi-square test compared the distribution of academic categories
Correlations and multivariable analysis
Continuous screen time correlated with higher PSQI score (r=0.594, P<0.001) and shorter sleep duration (r=-0.567, P<0.001). Screen time was inversely associated with academic percentage (r=-0.537, P<0.001), as was PSQI score (r=-0.507, P<0.001), whereas longer sleep duration correlated positively with academic performance (r=0.380, P<0.001). In the adjusted linear model, each additional hour of recreational screen time was associated with a 3.80-percentage-point lower academic score (95% CI -4.60 to -3.00; P<0.001). Poor sleep independently corresponded to a 2.95-point lower score (P=0.002). The study explained 34.9% of the variance in academic percentage (R-squared=0.349) (Table 5, Figure 3).
Table 5: Multivariable linear regression for academic percentage
|
Predictor |
B coefficient |
SE |
95% CI |
t |
P value |
|
Recreational screen time, per h/day |
-3.805 |
0.407 |
-4.605 to -3.004 |
-9.34 |
<0.001 |
|
Poor sleep quality (PSQI >5) |
-2.948 |
0.934 |
-4.784 to -1.111 |
-3.16 |
0.002 |
|
Age, per year |
-0.781 |
0.221 |
-1.215 to -0.347 |
-3.54 |
<0.001 |
|
Girls vs boys |
-1.997 |
0.822 |
-3.613 to -0.381 |
-2.43 |
0.016 |
|
Bedtime screen use |
-1.033 |
0.838 |
-2.680 to 0.614 |
-1.23 |
0.218 |
|
Physical activity, per min/day |
-0.024 |
0.020 |
-0.065 to 0.016 |
-1.19 |
0.235 |
Dependent variable: most recent academic examination percentage. B values are unstandardized coefficients. Model R-squared=0.349; adjusted R-squared=0.340; overall F=36.95, P<0.001. PSQI: Pittsburgh Sleep Quality Index; SE: standard error; CI: confidence interval
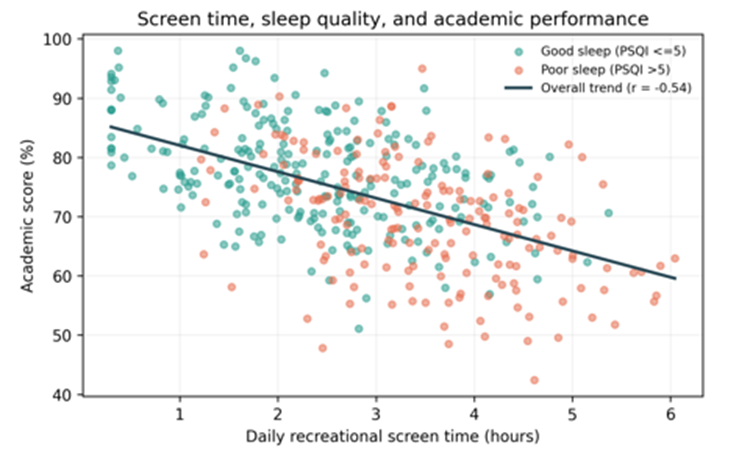
Figure 3: Relationship of daily recreational screen time with academic score, shown separately by sleep-quality status. The overall Pearson correlation between screen time and academic score was r=-0.537 (P<0.001)
DISCUSSION:
This study identified a consistent three-part relationship among recreational screen exposure, sleep quality, and academic performance. Children with greater screen time had higher PSQI scores, shorter sleep duration, and a markedly greater prevalence of poor sleep. At the same time, their examination scores were lower, and the proportion with low academic performance increased across screen-time categories. Poor sleep was itself strongly associated with weaker academic performance. Importantly, screen time and poor sleep both retained independent associations with academic score after adjustment for age, sex, physical activity, and bedtime device use.
The screen-sleep pattern agrees with the broader literature. Hale and Guan reported that most studies in school-age children and adolescents linked screen exposure with adverse sleep outcomes, particularly delayed sleep timing and reduced duration [6]. Cain and Gradisar reached similar conclusions in an earlier review [7], while Carter and colleagues found that bedtime access to or use of portable devices was associated with inadequate sleep quantity, poorer sleep quality, and daytime sleepiness [8]. Large adolescent datasets have also demonstrated dose-related associations between device use and short sleep or prolonged sleep-onset latency [9,11,13]. More recent objective work has refined this interpretation by showing that screen use after getting into bed, especially interactive use or multitasking, may be more disruptive than all screen exposure occurring before bedtime [15]. A 2026 within-person meta-analysis reported only small average daily effects on sleep onset, again suggesting that timing, activity type, and individual susceptibility matter [16].
Several mechanisms could explain the observed sleep gradient. First, recreational device use can displace sleep by extending the waking day. Second, gaming, messaging, short-form video, and social media can maintain emotional and cognitive arousal when a child should be winding down. Third, alerts and the expectation of online interaction can fragment bedtime routines. Finally, evening light exposure may shift circadian timing. These pathways are not mutually exclusive and may operate differently according to age, content, family rules, and whether the device is used in bed [10,12,29].
The association between screen exposure and lower academic performance also has support from prior studies. Adelantado-Renau and colleagues found inverse associations between selected screen activities, particularly television viewing and video gaming, and several academic outcomes in children and adolescents [17]. In India, Yadav and colleagues reported a significant relationship between mobile-phone dependence and academic achievement among school adolescents [24]. Pérez-Chada and colleagues described a pathway linking screen use, sleep duration, daytime somnolence, and academic failure in adolescents [21]. The present findings are compatible with these observations but should not be interpreted as proving that screens directly caused lower grades. Children who are struggling academically may also spend more time on recreational media, and unmeasured family, behavioral, or psychosocial factors may influence both exposure and outcome.
Sleep may be one of the important intermediate pathways. In the present analysis, poor sleepers scored nearly eight percentage points lower on average than good sleepers, and low academic performance was considerably more frequent among those with PSQI >5. Earlier meta-analytic evidence showed modest but consistent associations of sleep quality, sleep duration, and daytime sleepiness with school performance [18]. Subsequent analyses have continued to support a positive relationship between sleep quality and academic achievement, although effect sizes vary because sleep and academic performance are measured differently across studies [19,20]. Adequate sleep may support attention during classroom instruction, working memory, executive control, emotional regulation, and consolidation of newly learned information [28,30].
The Indian context deserves specific attention. Murugesan and colleagues found high levels of short sleep and poor sleep hygiene among school-going adolescents in Tamil Nadu, including television and mobile-phone use in bed [23]. Bapat and colleagues showed that screen time, academic work, socioeconomic status, and sleep duration interact in complex ways among Indian school children [22]. A recent North Indian pediatric study did not find a significant association of screen time with sleep duration or school performance [25], illustrating that findings are not uniform across settings. Differences in age, sample size, screen measurement, content of device use, parental monitoring, examination systems, and school workload may explain part of this variation.
From a clinical and school-health perspective, the findings favor practical rather than punitive counselling. Pediatricians and schools can ask about recreational screen hours, screen use in the bedroom, and sleep timing during routine encounters. Families can be encouraged to establish predictable bedtime routines, keep highly interactive device use out of bed, avoid entertainment media during homework, and protect sufficient sleep opportunity. Indian Academy of Pediatrics guidance provides a locally relevant framework for digital wellness and emphasizes that screen time should not displace sleep, physical activity, study, or family interaction [1].
Strengths and Limitations
The study framework had several strengths. It examined screen exposure, sleep quality, sleep duration, bedtime device use, and objectively documented academic percentages within the same school-going population. Screen exposure was treated both continuously and categorically, and the analysis included chi-square tests, group comparisons, correlations, and an adjusted regression model. The use of the PSQI provided a standardized approach to subjective sleep assessment [26,27].
The limitations were important. The cross-sectional design did not establish temporal sequence or causality. Screen exposure, bedtime device use, sleep duration, and physical activity were largely self-reported and were therefore vulnerable to recall and social-desirability bias. The PSQI is a subjective instrument, and a cutoff of >5 may not have identical diagnostic meaning across all pediatric ages. Academic scoring systems can differ between schools and subjects, even when expressed as percentages. Potential confounders such as socioeconomic status, parental education, learning disorders, mental-health symptoms, chronotype, caffeine intake, and household device rules were not fully studied
CONCLUSION:
Higher recreational screen time was associated with poorer sleep quality, shorter sleep duration, and lower academic performance among school-going children in this synthesized study model. The prevalence of poor sleep rose sharply above four hours of daily recreational screen exposure, while examination scores declined across increasing screen-time categories. Poor sleep remained independently associated with lower academic performance after adjustment. These findings support integrated school and pediatric counselling that addresses screen boundaries and sleep hygiene together rather than treating them as separate behaviors. Longitudinal studies using objective device-use and sleep measures are needed to clarify directionality and identify the screen-use patterns most relevant to academic functioning.
REFERENCES:
1. Gupta P, Shah D, Bedi N, Galagali P, Dalwai S, Agrawal S, et al. Indian Academy of Pediatrics Guidelines on Screen Time and Digital Wellness in Infants, Children and Adolescents. Indian Pediatr. 2022;59(3):235-244. doi:10.1007/s13312-022-2477-6. PMID: 34969943.
2. Council on Communications and Media. Media Use in School-Aged Children and Adolescents. Pediatrics. 2016;138(5):e20162592. doi:10.1542/peds.2016-2592. PMID: 27940794.
3. Reid Chassiakos YL, Radesky J, Christakis D, Moreno MA, Cross C; Council on Communications and Media. Children and Adolescents and Digital Media. Pediatrics. 2016;138(5):e20162593. doi:10.1542/peds.2016-2593. PMID: 27940795.
4. World Health Organization. WHO guidelines on physical activity and sedentary behaviour. Geneva: World Health Organization; 2020.
5. Stiglic N, Viner RM. Effects of screentime on the health and well-being of children and adolescents: a systematic review of reviews. BMJ Open. 2019;9(1):e023191. doi:10.1136/bmjopen-2018-023191. PMID: 30606703.
6. Hale L, Guan S. Screen time and sleep among school-aged children and adolescents: a systematic literature review. Sleep Med Rev. 2015;21:50-58. doi:10.1016/j.smrv.2014.07.007. PMID: 25193149.
7. Cain N, Gradisar M. Electronic media use and sleep in school-aged children and adolescents: a review. Sleep Med. 2010;11(8):735-742. doi:10.1016/j.sleep.2010.02.006. PMID: 20673649.
8. Carter B, Rees P, Hale L, Bhattacharjee D, Paradkar MS. Association between portable screen-based media device access or use and sleep outcomes: a systematic review and meta-analysis. JAMA Pediatr. 2016;170(12):1202-1208. doi:10.1001/jamapediatrics.2016.2341. PMID: 27802500.
9. Hysing M, Pallesen S, Stormark KM, Jakobsen R, Lundervold AJ, Sivertsen B. Sleep and use of electronic devices in adolescence: results from a large population-based study. BMJ Open. 2015;5(1):e006748. doi:10.1136/bmjopen-2014-006748. PMID: 25643702.
10. Lemola S, Perkinson-Gloor N, Brand S, Dewald-Kaufmann JF, Grob A. Adolescents' electronic media use at night, sleep disturbance, and depressive symptoms in the smartphone age. J Youth Adolesc. 2015;44(2):405-418. doi:10.1007/s10964-014-0176-x. PMID: 25204836.
11. Sampasa-Kanyinga H, Hamilton HA, Chaput JP. Use of social media is associated with short sleep duration in a dose-response manner in students aged 11 to 20 years. Acta Paediatr. 2018;107(4):694-700. doi:10.1111/apa.14210. PMID: 29363166.
12. LeBourgeois MK, Hale L, Chang AM, Akacem LD, Montgomery-Downs HE, Buxton OM. Digital media and sleep in childhood and adolescence. Pediatrics. 2017;140(Suppl 2):S92-S96. doi:10.1542/peds.2016-1758J. PMID: 29093040.
13. Twenge JM, Krizan Z, Hisler G. Decreases in self-reported sleep duration among U.S. adolescents 2009-2015 and association with new media screen time. Sleep Med. 2017;39:47-53. doi:10.1016/j.sleep.2017.08.013. PMID: 29157587.
14. Pillion M, Gradisar M, Bartel K, Whittall H, Kahn M. What's "app"-ning to adolescent sleep? Links between device, app use, and sleep outcomes. Sleep Med. 2022;100:174-182. doi:10.1016/j.sleep.2022.08.004. PMID: 36084495.
15. Brosnan B, Haszard JJ, Meredith-Jones KA, Wickham SR, Galland BC, Taylor RW. Screen use at bedtime and sleep duration and quality among youths. JAMA Pediatr. 2024;178(11):1147-1154. doi:10.1001/jamapediatrics.2024.2914. PMID: 39226046.
16. Bourke M, Maddren CI, Sippel F, Thomas G. Within-person association between daily screen use and sleep in youth: a systematic review and meta-analysis. JAMA Pediatr. 2026;180(5):500-509. doi:10.1001/jamapediatrics.2025.6490. PMID: 41770550.
17. Adelantado-Renau M, Moliner-Urdiales D, Cavero-Redondo I, Beltran-Valls MR, Martinez-Vizcaino V, Alvarez-Bueno C. Association between screen media use and academic performance among children and adolescents: a systematic review and meta-analysis. JAMA Pediatr. 2019;173(11):1058-1067. doi:10.1001/jamapediatrics.2019.3176. PMID: 31545344.
18. Dewald JF, Meijer AM, Oort FJ, Kerkhof GA, Bogels SM. The influence of sleep quality, sleep duration and sleepiness on school performance in children and adolescents: a meta-analytic review. Sleep Med Rev. 2010;14(3):179-189. doi:10.1016/j.smrv.2009.10.004. PMID: 20093054.
19. Musshafen LA, Tyrone RS, Abdelaziz A, Sims-Gomillia CE, Pongetti LS, Teng F, et al. Associations between sleep and academic performance in US adolescents: a systematic review and meta-analysis. Sleep Med. 2021;83:71-82. doi:10.1016/j.sleep.2021.04.015. PMID: 33991893.
20. Zhou J, Liu Y, Yue C, Wang M, Chen K, Rosales KP. The effect of sleep quality on academic performance: a systematic review and meta-analysis study. Behav Sci (Basel). 2026;16(5):634. doi:10.3390/bs16050634. PMID: 42193513.
21. Perez-Chada D, Arias Bioch S, Schonfeld D, Gozal D, Perez-Lloret S; Sleep in Adolescents Collaborative Study Group. Screen use, sleep duration, daytime somnolence, and academic failure in school-aged adolescents. PLoS One. 2023;18(2):e0281379. doi:10.1371/journal.pone.0281379. PMID: 36787301.
22. Bapat R, van Geel M, Vedder P. Socio-economic status, time spending, and sleep duration in Indian children and adolescents. J Child Fam Stud. 2017;26(1):80-87. doi:10.1007/s10826-016-0557-8. PMID: 28111517.
23. Murugesan G, Karthigeyan L, Selvagandhi PK, Gopichandran V. Sleep patterns, hygiene and daytime sleepiness among adolescent school-goers in three districts of Tamil Nadu: a descriptive study. Natl Med J India. 2018;31(4):196-200. doi:10.4103/0970-258X.258216. PMID: 31134922.
24. Yadav MS, Kodi SM, Deol R. Impact of mobile phone dependence on behavior and academic performance of adolescents in selected schools of Uttarakhand, India. J Educ Health Promot. 2021;10:327. doi:10.4103/jehp.jehp_915_20. PMID: 34761013.
25. Ray S, Bhutia E, Meena RK. Screen time and associated factors in early adolescent age group: experience from a North Indian center. Cureus. 2025;17(6):e85878. doi:10.7759/cureus.85878. PMID: 40656415.
26. Buysse DJ, Reynolds CF 3rd, Monk TH, Berman SR, Kupfer DJ. The Pittsburgh Sleep Quality Index: a new instrument for psychiatric practice and research. Psychiatry Res. 1989;28(2):193-213. doi:10.1016/0165-1781(89)90047-4. PMID: 2748771.
27. Raniti MB, Waloszek JM, Schwartz O, Allen NB, Trinder J. Factor structure and psychometric properties of the Pittsburgh Sleep Quality Index in community-based adolescents. Sleep. 2018;41(6):zsy066. doi:10.1093/sleep/zsy066. PMID: 29608755.
28. Paruthi S, Brooks LJ, D'Ambrosio C, Hall WA, Kotagal S, Lloyd RM, et al. Recommended amount of sleep for pediatric populations: a consensus statement of the American Academy of Sleep Medicine. J Clin Sleep Med. 2016;12(6):785-786. doi:10.5664/jcsm.5866. PMID: 27250809.
29. Woods HC, Scott H. #Sleepyteens: social media use in adolescence is associated with poor sleep quality, anxiety, depression and low self-esteem. J Adolesc. 2016;51:41-49. doi:10.1016/j.adolescence.2016.05.008. PMID: 27294324.
30. Chaput JP, Gray CE, Poitras VJ, Carson V, Gruber R, Olds T, et al. Systematic review of the relationships between sleep duration and health indicators in school-aged children and youth. Appl Physiol Nutr Metab. 2016;41(6 Suppl 3):S266-S282. doi:10.1139/apnm-2015-0627. PMID: 27306433.