Association of Serum Sodium-to-Potassium Ratio with Blood Pressure Severity in Newly Diagnosed Essential Hypertension: A Cross-Sectional Analytical Study.
- Dr. Imran Khan , 3rd Year Junior Resident, Department of General Medicine, Katihar Medical College, Katihar, Bihar, India
- Dr. Pramod Kumar Agrawal , Professor & Head of Department, Department of General Medicine, Katihar Medical College, Katihar, Bihar, India
- Dr. Durga Shankar , Professor, Department of General Medicine, Katihar Medical College, Katihar, Bihar, India
- Dr. Md Shoeb Alam , Assistant Professor, Department of General Medicine, Katihar Medical College, Katihar, Bihar, India
- Dr. Abdullah Khan , 3rd Year Junior Resident, Department of General Medicine, Katihar Medical College, Katihar, Bihar, India
- Dr. Mohammad Salman , 3rd Year Junior Resident, Department of General Medicine, Katihar Medical College, Katihar, Bihar, India.
Article Information:
Abstract:
Background: Hypertension is a major modifiable risk factor for cardiovascular, cerebrovascular, and renal disease. Sodium and potassium have opposing effects on blood pressure regulation, and their relative balance may provide additional information beyond either electrolyte alone. Although dietary and urinary sodium-to-potassium ratios have been extensively investigated, the relationship between serum sodium-to-potassium (Na/K) ratio and blood pressure severity in newly diagnosed essential hypertension remains less well characterized. Objective: To evaluate the association between serum sodium-to-potassium ratio and blood pressure severity among patients with newly diagnosed essential hypertension. Methods: An analytical cross-sectional study was conducted in the Department of General Medicine, Katihar Medical College, Katihar, Bihar, over 18 months. A total of 80 adults with newly diagnosed essential hypertension were included in the study. Participants were categorized into Grade 1, Grade 2, and Grade 3 hypertension according to predefined blood pressure criteria. Serum sodium and potassium concentrations were measured using an automated ion-selective electrode method, and the serum Na/K ratio was calculated as serum sodium divided by serum potassium. One-way analysis of variance with Tukey post-hoc testing was used to compare the ratio across blood pressure severity groups. Pearson correlation analysis assessed relationships with systolic blood pressure (SBP), diastolic blood pressure (DBP), and mean arterial pressure (MAP). Multivariable linear regression was performed to evaluate the independent association between serum Na/K ratio and SBP after adjustment for age, sex, body mass index (BMI), and serum creatinine. Results: A total of 80 participants were included: 31 (38.8%) with Grade 1, 34 (42.5%) with Grade 2, and 15 (18.7%) with Grade 3 hypertension. The mean age was 48.7 ± 10.4 years. Mean serum Na/K ratios were 32.10 ± 2.80, 34.60 ± 3.10, and 37.10 ± 3.80 in Grades 1, 2, and 3, respectively. One-way ANOVA demonstrated a significant difference among groups (F=13.65, p<0.001). Tukey post-hoc analysis showed significant differences between Grade 1 and Grade 2 (adjusted p=0.0053), Grade 1 and Grade 3 (adjusted p<0.001), and Grade 2 and Grade 3 (adjusted p=0.0316). Serum Na/K ratio was positively correlated with SBP (r=0.48, p<0.001), DBP (r=0.36, p=0.001), and MAP (r=0.44, p<0.001). In multivariable regression, serum Na/K ratio remained positively associated with SBP (B=1.56, 95% CI 0.86–2.26, p<0.001). The overall regression model was significant (F=6.71, p<0.001; R²=0.312; adjusted R²=0.265). Conclusion: A higher serum sodium-to-potassium ratio was associated with progressively greater blood pressure severity and higher SBP, DBP, and MAP among patients with newly diagnosed essential hypertension. The findings support further investigation of serum Na/K ratio as an exploratory biochemical marker in newly diagnosed hypertension. However, the cross-sectional design limits causal inference, and further prospective and multicenter studies are required to establish the clinical significance of this association.
Keywords:
Article :
INTRODUCTION:
Hypertension is one of the leading modifiable risk factors for cardiovascular disease, stroke, chronic kidney disease, and premature mortality worldwide.¹,² Current hypertension guidelines emphasize accurate blood pressure measurement, cardiovascular risk assessment, and identification of modifiable lifestyle factors.¹,²
Dietary sodium and potassium play important roles in blood pressure regulation. Excess sodium exposure promotes extracellular volume expansion and may increase vascular resistance, whereas adequate potassium intake facilitates natriuresis and may attenuate the pressor effects of sodium.³–⁶ The World Health Organization recommends reducing sodium intake and increasing potassium consumption as population-level strategies for reducing blood pressure and cardiovascular risk.⁷,⁸
The interaction between sodium and potassium is biologically relevant because the effects of sodium on blood pressure may be modified by potassium availability. Increased potassium intake may reduce blood pressure, particularly among individuals with higher sodium exposure, while sodium reduction has also been associated with clinically meaningful reductions in blood pressure.⁹–¹¹ The Dietary Approaches to Stop Hypertension (DASH) trial demonstrated that dietary patterns rich in fruits, vegetables, and low-fat dairy products can substantially reduce blood pressure.¹²
The sodium-to-potassium ratio has therefore emerged as a potentially useful indicator of sodium-potassium balance. Epidemiological studies have suggested that a higher sodium-to-potassium ratio is associated with elevated blood pressure and adverse cardiovascular outcomes.⁴,⁵,¹³ The INTERSALT study demonstrated important population-level relationships between urinary sodium and potassium excretion and blood pressure, highlighting the relevance of sodium and potassium balance in hypertension.¹⁴
Most previous investigations have focused on dietary intake or urinary sodium and potassium excretion rather than serum concentrations. Serum sodium and potassium are tightly regulated by renal, hormonal, and cellular mechanisms and therefore do not directly represent dietary intake. Nevertheless, serum electrolyte measurements are routinely available in clinical practice and may provide an accessible biochemical parameter for exploratory assessment of sodium-potassium balance.
Newly diagnosed hypertensive individuals provide an important population in which to investigate this relationship because they have generally not undergone prolonged antihypertensive treatment that could modify blood pressure or electrolyte concentrations. Determining whether serum Na/K ratio varies according to blood pressure severity may help clarify whether this readily measurable parameter has potential value during the initial evaluation of hypertension. Therefore, the present study was designed to evaluate the association between serum sodium-to-potassium ratio and blood pressure severity in newly diagnosed patients with essential hypertension at Katihar Medical College.
MATERIALS AND METHODS:
Study Design and Setting
This was an analytical cross-sectional study conducted in the Department of General Medicine, Katihar Medical College, Katihar, Bihar, India, over a period of 18 months.
A total of 80 patients fulfilling the predefined inclusion and exclusion criteria were enrolled during the study period. Data regarding demographic characteristics, blood pressure measurements, and biochemical parameters were collected and recorded in a structured study proforma.
Study Population
The study population comprised adults with newly diagnosed essential hypertension attending the outpatient and inpatient services of the institution.
Sample Size Calculation
The sample size was estimated for comparison of serum sodium-to-potassium ratio across three anticipated blood pressure severity categories using a one-way analysis of variance framework. Assuming an effect size (f) of 0.36, a significance level (α) of 0.05, three comparison groups, and 80% statistical power, the minimum required sample size was 78 participants. An independent noncentral F-distribution calculation gives approximately 80.3% power at n=78. The final sample size was therefore fixed at 80 participants.
Inclusion Criteria
Participants were included if they:
1. Were aged ≥18 years.
2. Had newly diagnosed essential hypertension.
3. Had no previous history of antihypertensive treatment.
4. Had two or more elevated BP measurements obtained using standardized measurement procedures during the diagnostic assessment.
5. Provided written informed consent.
Exclusion Criteria
· Participants were excluded if they had:
· Secondary hypertension.
· Chronic kidney disease.
· Known heart failure.
· Chronic liver disease.
· Diabetes mellitus with significant end-organ complications.
· Known endocrine disorders affecting electrolyte balance.
· Acute infection or severe systemic illness.
· Current use of potassium supplements or medications significantly affecting serum potassium.
· Pregnancy.
· Known adrenal or thyroid disorders associated with altered electrolyte homeostasis.
· Secondary causes of hypertension were excluded on the basis of clinical history, physical examination, and relevant investigations where clinically indicated.
· For the present operational definition, uncomplicated diabetes mellitus was not itself considered an exclusion criterion; diabetes with significant end-organ complications was excluded.
Operational Definition of Newly Diagnosed Hypertension
Newly diagnosed hypertension was defined as previously untreated hypertension in an individual with no history of antihypertensive therapy and with two or more elevated BP measurements obtained during the standardized diagnostic assessment. Participants were not included if they had previously received antihypertensive treatment.
Blood Pressure Measurement
Blood pressure was measured using a validated automated sphygmomanometer after the participant had rested in a seated position for at least five minutes. An appropriate cuff size was selected according to arm circumference. Two measurements were obtained at an interval of 1–2 minutes, and the average was recorded.¹,²
Participants were categorized according to predefined blood pressure severity categories:
Grade 1 hypertension: SBP 140–159 mmHg and/or DBP 90–99 mmHg.
Grade 2 hypertension: SBP 160–179 mmHg and/or DBP 100–109 mmHg.
Grade 3 hypertension: SBP ≥180 mmHg and/or DBP ≥110 mmHg.
When systolic and diastolic measurements corresponded to different severity categories, the higher category was assigned.
Biochemical Assessment
· After an overnight fast, venous blood samples were collected. Serum sodium and potassium concentrations were measured using an automated ion-selective electrode method.
· The serum sodium-to-potassium ratio was calculated as:
· Serum Na/K ratio = Serum sodium (mmol/L) ÷ Serum potassium (mmol/L)
· Additional laboratory parameters included serum creatinine, fasting blood glucose, and lipid profile.
Study Variables
· The primary study variable was the serum Na/K ratio.
· The primary outcome was the association between serum Na/K ratio and blood pressure severity.
· Secondary variables included:
· Age
· Sex
· BMI
· SBP
· DBP
· MAP
· Serum sodium
· Serum potassium
· Serum creatinine
· Fasting glucose
· Lipid profile
Statistical Analysis
Continuous variables were expressed as mean ± standard deviation, while categorical variables were presented as frequencies and percentages.
Differences in serum sodium, potassium, and Na/K ratio across the three BP severity groups were assessed using one-way analysis of variance (ANOVA). When ANOVA demonstrated an overall significant difference, Tukey's honestly significant difference post-hoc test was used for pairwise comparisons.
Pearson correlation analysis was performed to evaluate associations between serum Na/K ratio and SBP, DBP, and MAP.
Multivariable linear regression was performed with SBP as the dependent variable and serum Na/K ratio, age, sex, BMI, and serum creatinine as independent variables.
Normality of serum Na/K ratio within each BP group was assessed using the Shapiro-Wilk test, and homogeneity of variance was assessed using Levene's test. The Shapiro-Wilk p-values for the three groups were 0.968, 0.651, and 0.374, respectively, while Levene's test was non-significant (p=0.256). Regression residual diagnostics demonstrated a mild departure from normality; therefore, the regression findings were interpreted as exploratory. A two-sided p value <0.05 was considered statistically significant. All statistical analyses reported in the Results section were performed using the collected study data.
RESULTS:
Baseline Characteristics
A total of 80 participants were included. The mean age was 48.7 ± 10.4 years. Forty-six participants (57.5%) were male and 34 (42.5%) were female.
The mean BMI was 25.1 ± 3.2 kg/m². The overall mean SBP was 164.1 ± 12.7 mmHg, while the mean DBP was 96.8 ± 7.4 mmHg. The mean serum sodium concentration was 139.8 ± 2.3 mmol/L, and the mean serum potassium concentration was 4.14 ± 0.42 mmol/L. The overall mean serum Na/K ratio was 34.10 ± 3.60.
Table 1. Baseline Demographic, Clinical, and Biochemical Characteristics
|
Variable |
Value |
|
Age, years, mean ± SD |
48.7 ± 10.4 |
|
Male |
46 (57.5%) |
|
Female |
34 (42.5%) |
|
BMI, kg/m² |
25.1 ± 3.2 |
|
SBP, mmHg |
164.1 ± 12.7 |
|
DBP, mmHg |
96.8 ± 7.4 |
|
MAP, mmHg |
119.2 ± 8.7 |
|
Serum sodium, mmol/L |
139.8 ± 2.3 |
|
Serum potassium, mmol/L |
4.14 ± 0.42 |
|
Serum Na/K ratio |
34.10 ± 3.60 |
|
Serum creatinine, mg/dL |
0.91 ± 0.18 |
Distribution According to Blood Pressure Severity
Of the 80 participants, 31 (38.8%) had Grade 1 hypertension, 34 (42.5%) had Grade 2 hypertension, and 15 (18.7%) had Grade 3 hypertension.
Table 2. Distribution of Participants According to Blood Pressure Severity
|
BP severity |
Number (%) |
|
Grade 1 hypertension |
31 (38.8%) |
|
Grade 2 hypertension |
34 (42.5%) |
|
Grade 3 hypertension |
15 (18.7%) |
|
Total |
80 (100%) |
Grade 2 hypertension represented the largest proportion of the study population.
Serum Sodium, Potassium, and Na/K Ratio According to BP Severity
The serum Na/K ratio increased progressively across the three BP severity groups.
The mean Na/K ratio was 32.10 ± 2.80 in Grade 1 hypertension, 34.60 ± 3.10 in Grade 2 hypertension, and 37.10 ± 3.80 in Grade 3 hypertension. One-way ANOVA demonstrated a statistically significant difference among the three groups (F=13.65, p<0.001).
Table 3. Comparison of Serum Sodium, Potassium, and Na/K Ratio Across BP Severity Groups
|
Parameter |
Grade 1 (n=31) |
Grade 2 (n=34) |
Grade 3 (n=15) |
ANOVA p value |
|
Sodium, mmol/L |
138.8 ± 2.0 |
140.0 ± 2.0 |
141.4 ± 2.6 |
<0.001 |
|
Potassium, mmol/L |
4.36 ± 0.38 |
4.08 ± 0.39 |
3.84 ± 0.36 |
<0.001 |
|
Na/K ratio |
32.10 ± 2.80 |
34.60 ± 3.10 |
37.10 ± 3.80 |
<0.001 |
The progressively higher Na/K ratio was associated with both a modest increase in serum sodium and a progressive reduction in serum potassium across increasing BP severity categories.
Tukey Post-Hoc Analysis
Because the overall ANOVA for the serum Na/K ratio was significant, Tukey's post-hoc test was performed.
|
Pairwise comparison |
Mean difference |
Adjusted p value |
Interpretation |
|
Grade 1 vs Grade 2 |
2.50 |
0.0053 |
Significant |
|
Grade 1 vs Grade 3 |
5.00 |
<0.001 |
Significant |
|
Grade 2 vs Grade 3 |
2.50 |
0.0316 |
Significant |
Thus, each successive increase in BP severity category was associated with a statistically significant increase in the mean serum Na/K ratio.
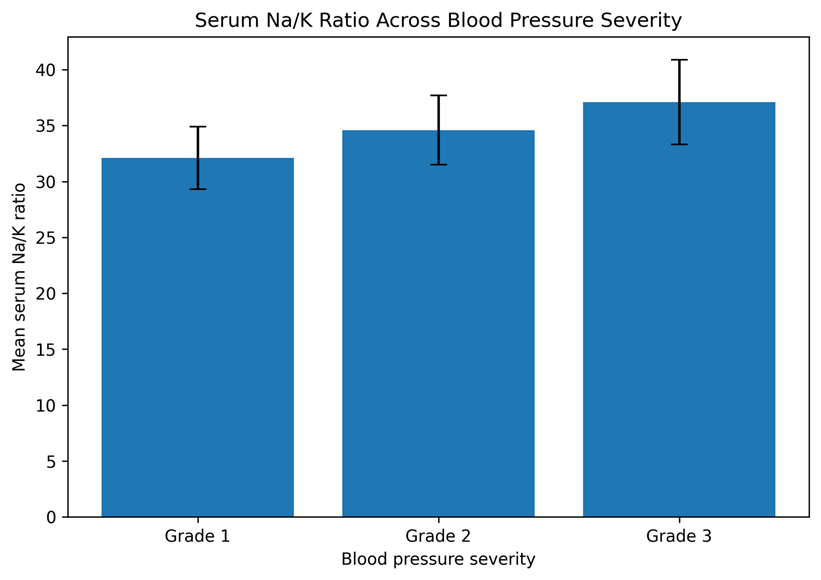
Figure 1. Mean serum sodium-to-potassium ratio across blood pressure severity categories.
The figure shows the mean serum Na/K ratio with standard deviation error bars across Grade 1, Grade 2, and Grade 3 hypertension. The mean ratio increased progressively from 32.10 ± 2.80 in Grade 1 to 34.60 ± 3.10 in Grade 2 and 37.10 ± 3.80 in Grade 3 hypertension. Overall ANOVA: F=13.65, p<0.001.
Correlation Between Serum Na/K Ratio and Blood Pressure Parameters
Serum Na/K ratio demonstrated a significant positive correlation with SBP, DBP, and MAP.
The correlation with SBP was moderate (r=0.48, p<0.001). Significant positive correlations were also observed with DBP (r=0.36, p=0.001) and MAP (r=0.44, p<0.001).
Table 4. Correlation of Serum Na/K Ratio With Blood Pressure Parameters
|
Parameter |
Pearson's r |
p value |
|
SBP |
0.48 |
<0.001 |
|
DBP |
0.36 |
0.001 |
|
MAP |
0.44 |
<0.001 |
These findings indicate that higher serum Na/K ratios were associated with higher blood pressure measurements among the study participants.
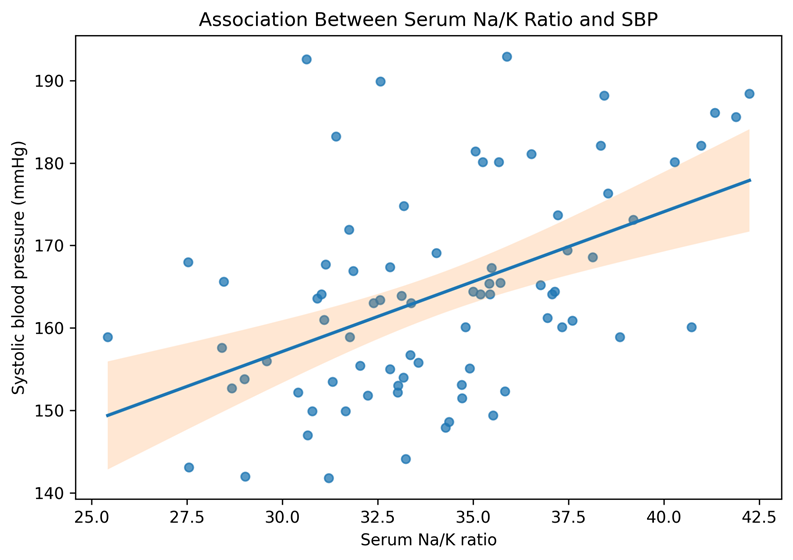
Figure 2. Scatter plot showing the association between serum Na/K ratio and systolic blood pressure.
Individual participant observations are shown with serum Na/K ratio on the x-axis and SBP on the y-axis. The fitted linear regression line and its 95% confidence interval demonstrate a positive association between serum Na/K ratio and SBP. Pearson correlation: r=0.48, p<0.001.
Multivariable Linear Regression
A multivariable linear regression model was constructed with SBP as the dependent variable and serum Na/K ratio, age, BMI, sex, and serum creatinine as independent variables. The overall model was statistically significant (F=6.71, p<0.001) and explained approximately 31.2% of the variation in SBP (R²=0.312; adjusted R²=0.265). Serum Na/K ratio remained significantly and positively associated with SBP after adjustment for the other variables.
Table 5. Multivariable Linear Regression Analysis of Factors Associated With SBP
|
Predictor |
Unstandardized B coefficient |
95% CI |
p value |
|
Serum Na/K ratio |
1.56 |
0.86–2.26 |
<0.001 |
|
Age, years |
0.06 |
−0.18 to 0.30 |
0.628 |
|
BMI, kg/m² |
0.71 |
−0.07 to 1.49 |
0.074 |
|
Male sex |
0.48 |
−4.55 to 5.50 |
0.851 |
|
Serum creatinine, mg/dL |
14.44 |
0.73–28.16 |
0.039 |
Model statistics: R²=0.312; adjusted R²=0.265; F=6.71; p<0.001.
In this model, each one-unit increase in serum Na/K ratio was associated with an estimated 1.56 mmHg increase in SBP after adjustment for age, BMI, sex, and serum creatinine. Serum creatinine also demonstrated a statistically significant positive association with SBP in the model, whereas age, BMI, and male sex did not reach statistical significance.
DISCUSSION:
The present analytical cross-sectional study demonstrated a progressive increase in serum sodium-to-potassium ratio across increasing categories of blood pressure severity. The mean serum Na/K ratio increased from 32.10 in Grade 1 hypertension to 34.60 in Grade 2 and 37.10 in Grade 3 hypertension. The overall difference was statistically significant, and Tukey post-hoc testing demonstrated significant differences between all three pairwise comparisons.
The biological plausibility of an association between sodium-potassium balance and blood pressure is supported by extensive evidence regarding the physiological effects of these electrolytes. Sodium contributes to extracellular volume expansion and may influence vascular resistance, whereas potassium promotes natriuresis and may counteract several adverse effects of sodium.³–⁶ WHO recommendations similarly emphasize reducing sodium consumption and increasing potassium intake as strategies for reducing blood pressure.⁷,⁸
The study also demonstrated significant positive correlations between serum Na/K ratio and SBP, DBP, and MAP. The strongest association was observed with SBP (r=0.48), followed by MAP (r=0.44) and DBP (r=0.36). These findings are directionally consistent with the broader literature demonstrating that sodium and potassium balance is relevant to blood pressure regulation. The INTERSALT study provided important evidence linking urinary sodium and potassium excretion patterns with blood pressure at the population level.¹⁴ Subsequent epidemiological studies have also suggested associations between sodium-to-potassium ratio and cardiovascular risk.⁴,⁵,¹³
In the present study, serum potassium decreased progressively across increasing BP severity categories, while serum sodium showed a modest increase. Consequently, the Na/K ratio demonstrated a more pronounced difference between severity groups than either electrolyte considered individually. This suggests that the ratio may capture the combined direction of changes in sodium and potassium concentrations.
However, serum Na/K ratio must be distinguished from dietary or urinary Na/K ratio. Serum sodium and potassium are subject to tight physiological regulation and may remain within relatively narrow ranges despite variation in dietary intake. Therefore, serum Na/K ratio should not be interpreted as a direct surrogate for dietary sodium-to-potassium intake. Urinary sodium and potassium measurements, particularly 24-hour urinary collections, are more appropriate for estimating habitual intake in epidemiological and nutritional research.¹⁴,¹⁵
The relationship between sodium exposure and blood pressure has been demonstrated in multiple intervention studies. Reduction in sodium intake has been associated with lower blood pressure, while increased potassium intake may provide additional benefits.⁹–¹¹ The DASH dietary intervention similarly demonstrated substantial reductions in blood pressure with a dietary pattern rich in fruits and vegetables and relatively low in sodium.¹²
The multivariable analysis demonstrated that serum Na/K ratio remained positively associated with SBP after adjustment for age, BMI, sex, and serum creatinine. The estimated regression coefficient was 1.56 mmHg per one-unit increase in Na/K ratio. The overall model explained 31.2% of the variation in SBP.
These findings should nevertheless be interpreted cautiously. The cross-sectional design demonstrates an association rather than causation. The temporal relationship between serum Na/K ratio and blood pressure severity cannot be established from the study design.
From a clinical perspective, serum sodium and potassium are inexpensive and routinely available laboratory parameters. If the observed association is confirmed in adequately powered prospective studies, the serum Na/K ratio could potentially be investigated as an additional exploratory marker during the assessment of newly diagnosed hypertension.
At present, however, serum Na/K ratio should not be considered an established diagnostic or severity-classification biomarker. Current hypertension guidelines focus on standardized BP measurement, cardiovascular risk assessment, lifestyle modification, and evidence-based antihypertensive treatment rather than serum Na/K ratio as a formal severity marker.¹,²
Strengths of the Study
1. The study has several methodological strengths.
2. First, BP severity was categorized using predefined systolic and diastolic thresholds, with the higher category used when systolic and diastolic categories differed.
3. Second, the study examined serum sodium and potassium together rather than evaluating either electrolyte in isolation.
4. Third, the analysis included both group comparisons and continuous-variable correlation analysis.
5. Fourth, significant ANOVA findings were followed by Tukey post-hoc comparisons to identify the specific BP severity groups contributing to the overall difference.
6. Finally, multivariable regression was used to assess whether the association between serum Na/K ratio and SBP persisted after adjustment for selected demographic and clinical variables.
Limitations
1. Several limitations should be considered.
2. First, the cross-sectional study design does not permit causal inference regarding the relationship between serum Na/K ratio and hypertension severity.
3. Second, the sample size was relatively small and represented a single tertiary-care setting, which may limit generalizability.
4. Third, serum sodium and potassium concentrations do not directly reflect habitual dietary sodium and potassium intake.
5. Fourth, 24-hour urinary sodium and potassium excretion and detailed dietary intake were not assessed.
6. Fifth, potentially relevant factors such as dietary pattern, physical activity, alcohol consumption, smoking, family history, salt sensitivity, and other metabolic variables were not comprehensively evaluated.
7. Sixth, because all participants were categorized as having hypertension, the analysis could not determine whether an elevated serum Na/K ratio preceded the development of hypertension.
8. Finally, regression residual diagnostics demonstrated a mild departure from normality, and the regression findings should therefore be interpreted as exploratory.
CONCLUSION:
This analytical cross-sectional study demonstrated a significant positive association between serum sodium-to-potassium ratio and blood pressure severity among newly diagnosed patients with essential hypertension.The mean serum Na/K ratio increased progressively from Grade 1 to Grade 3 hypertension, with statistically significant differences between all three severity groups on Tukey post-hoc analysis. Serum Na/K ratio also demonstrated significant positive correlations with SBP, DBP, and MAP.In multivariable analysis, serum Na/K ratio remained independently associated with SBP after adjustment for age, sex, BMI, and serum creatinine.These findings suggest that serum Na/K ratio may have potential value as an exploratory biochemical marker of sodium-potassium balance in newly diagnosed hypertension. However, the cross-sectional design limits causal inference and does not establish the clinical validity of the ratio as a biomarker of hypertension severity. Larger prospective studies using real-world patient populations, repeated biochemical measurements, detailed dietary assessment, and 24-hour urinary sodium and potassium measurements are required before the clinical significance of serum Na/K ratio can be determined.
REFERENCES:
1. Williams B, Mancia G, Spiering W, Agabiti Rosei E, Azizi M, Burnier M, et al. 2018 ESC/ESH Guidelines for the management of arterial hypertension. Eur Heart J. 2018;39(33):3021-3104.
2. McEvoy JW, McCarthy CP, Bruno RM, Brouwers S, Canavan MD, Ceconi C, et al. 2024 ESC Guidelines for the management of elevated blood pressure and hypertension. Eur Heart J. 2024;45(38):3912-4018.
3. Adrogué HJ, Madias NE. Sodium and potassium in the pathogenesis of hypertension. N Engl J Med. 2007;356(19):1966-1978.
4. Cook NR, Obarzanek E, Cutler JA, Buring JE, Rexrode KM, Kumanyika SK, et al. Joint effects of sodium and potassium intake on subsequent cardiovascular disease: the Trials of Hypertension Prevention follow-up study. Arch Intern Med. 2009;169(1):32-40.
5. Yang Q, Liu T, Kuklina EV, Flanders WD, Hong Y, Gillespie C, et al. Sodium and potassium intake and mortality among US adults: prospective data from the Third National Health and Nutrition Examination Survey. Arch Intern Med. 2011;171(13):1183-1191.
6. Whelton PK, He J. Health effects of sodium and potassium in humans. Curr Opin Lipidol. 2014;25(1):75-79.
7. World Health Organization. Guideline: sodium intake for adults and children. Geneva: WHO; 2012.
8. World Health Organization. Guideline: potassium intake for adults and children. Geneva: WHO; 2012.
9. Aburto NJ, Hanson S, Gutierrez H, Hooper L, Elliott P, Cappuccio FP. Effect of increased potassium intake on cardiovascular risk factors and disease: systematic review and meta-analyses. BMJ. 2013;346:f1378.
10. Aburto NJ, Ziolkovska A, Hooper L, Elliott P, Cappuccio FP, Meerpohl JJ. Effect of lower sodium intake on health: systematic review and meta-analyses. BMJ. 2013;346:f1326.
11. He FJ, MacGregor GA. Effect of longer-term modest salt reduction on blood pressure. Cochrane Database Syst Rev. 2004;(1):CD004937.
12. Sacks FM, Svetkey LP, Vollmer WM, Appel LJ, Bray GA, Harsha D, et al. Effects on blood pressure of reduced dietary sodium and the Dietary Approaches to Stop Hypertension diet. N Engl J Med. 2001;344(1):3-10.
13. Okayama A, Okuda N, Miura K, Okamura T, Hayakawa T, Akasaka H, et al. Dietary sodium-to-potassium ratio as a risk factor for hypertension and cardiovascular disease. Hypertens Res. 2012;35(9):909-914.
14. Elliott P, Stamler J, Nichols R, Dyer AR, Stamler R, Kesteloot H, et al. Intersalt revisited: further analyses of 24 hour sodium excretion and blood pressure within and across populations. BMJ. 1996;312(7041):1249-1253.
15. Elliott P, Brown IJ, Dyer AR, Joossens JV, Kesteloot H, Lambrechts D, et al. The INTERSALT study: methodology and findings on sodium, potassium, and blood pressure. J Hum Hypertens. 1989;3(5):283-298.
16. He FJ, Tan M, Ma Y, MacGregor GA. Salt reduction to prevent hypertension and cardiovascular disease: JACC state-of-the-art review. J Am Coll Cardiol. 2020;75(6):632-647.
17. Whelton PK, Carey RM, Aronow WS, Casey DE Jr, Collins KJ, Dennison Himmelfarb C, et al. 2017 ACC/AHA guideline for the prevention, detection, evaluation, and management of high blood pressure in adults. Hypertension. 2018;71(6):e13-e115.
18. Filippone EJ, Fissell WH, Doucet A. Sodium and potassium transport in the kidney: implications for blood pressure regulation. Kidney Int. 2014;85(1):1-10.
19. Mente A, O'Donnell M, Rangarajan S, Dagenais G, Lear S, McQueen M, et al. Associations of urinary sodium excretion with cardiovascular events in individuals with and without hypertension: a pooled analysis. Lancet. 2016;388(10043):465-475.
20. O'Donnell M, Mente A, Rangarajan S, McQueen MJ, Wang X, Liu L, et al. Urinary sodium and potassium excretion, mortality, and cardiovascular events. N Engl J Med. 2014;371(7):612-623.
21. World Health Organization. Effect of increased potassium intake on blood pressure, renal function, blood lipids and other potential adverse effects. Geneva: WHO; 2012.
22. World Health Organization. Increasing potassium intake to reduce blood pressure and risk of cardiovascular diseases in adults. Geneva: WHO; 2023.