Association Of Serum Vitamin D And Cortisol Levels With Diabetic Retinopathy: Case Control Study.
- Dr. Saurav Dey , MD Biochemistry, Department of Biochemistry, Calcutta National Medical College and Hospital, India.
- Dr. Swati Bhattacharyya , Professor and HOD, Department of Biochemistry, Calcutta National Medical College and Hospital, India.
- Dr. Sambuddha Ghosh , Professor and HOD, Department of Ophthalmology, Calcutta National Medical College and Hospital, India.
Article Information:
Abstract:
Background: Diabetic retinopathy (DR) is a major microvascular complication of diabetes mellitus. Beyond chronic hyperglycemia, biochemical and hormonal alterations—specifically vitamin D deficiency and altered cortisol secretion—may influence DR development and severity. This study evaluated the relationship between serum vitamin D and cortisol levels (including diurnal variation) with the presence and severity of DR. Materials and Methods: A hospital-based, case–control study was conducted comparing patients with type 2 diabetes mellitus (T2DM) presenting with DR (including non-proliferative [NPDR] and proliferative [PDR] subgroups) against diabetic controls without retinopathy. Serum vitamin D and cortisol levels were measured. Diurnal variation of cortisol was evaluated using morning levels, evening levels, and delta cortisol (morning–evening difference). Hypertensive patients were excluded to minimize confounding factors. Results: Patients with DR demonstrated significantly lower serum vitamin D concentrations and higher serum cortisol levels compared to controls. Vitamin D levels were markedly lower in NPDR and PDR groups. For cortisol, evening levels showed a high predictive value for PDR (AUC = 0.931) with high sensitivity and specificity. Additionally, DR patients—especially those with PDR—exhibited a significantly blunted delta cortisol, indicating a loss of normal diurnal cortisol rhythmicity. Conclusion: Vitamin D deficiency and cortisol dysregulation, characterized by a blunted diurnal rhythm, are strongly associated with the presence and severity of DR. Routine screening for vitamin D status and evaluating diurnal cortisol patterns may serve as valuable adjunctive markers for early risk stratification and management in T2DM.
Keywords:
Article :
INTRODUCTION:
Diabetic retinopathy (DR) is a common microvascular complication of diabetes mellitus and a leading cause of vision loss among working-age adults. Beyond chronic hyperglycemia, several biochemical and hormonal factors may influence its onset and progression.
The prevalence of vitamin D deficiency is notably high among patients with type 2 diabetes mellitus (T2DM)¹⁰. Vitamin D receptors are extensively expressed in the retina, suggesting a potential role in retinal health. Mechanistically, vitamin D may influence DR pathogenesis through immunomodulatory and anti-angiogenic effects²⁷. It reduces inflammation by limiting lymphocyte and natural killer cell proliferation and decreasing pro-inflammatory cytokine production¹⁷. Experimental evidence from an animal model demonstrated that activated vitamin D inhibits retinal neovascularization in oxygen-induced ischemic retinopathy¹⁸. Lower vitamin D levels are also linked to retinal microvascular damage, suggesting that the relationship between vitamin D deficiency and cardiovascular risk may partly involve microvascular changes²⁹. Collectively, these findings support a possible role of vitamin D in DR development.
Cortisol, another factor potentially relevant to DR, is a glucocorticoid hormone secreted by the zona fasciculata of the adrenal cortex in response to physical and psychological stress⁴. Its primary physiological action is to increase blood glucose levels via gluconeogenesis⁵. Cortisol secretion follows a circadian rhythm, peaking in the early morning and declining to its lowest levels in the late evening. While excess cortisol can exacerbate hyperglycemia, promote insulin resistance, and contribute to microvascular injury, few studies have directly examined the combined influence of serum vitamin D and cortisol on DR risk.
Establishing such associations may provide a basis for targeted screening—such as routine retinopathy evaluation in patients with elevated cortisol—and for preventive strategies, including vitamin D supplementation, to reduce DR incidence.
Given this background, the present study aims to investigate the relationship between serum vitamin D and cortisol concentrations and the presence and severity of DR in patients with diabetes mellitus.
MATERIALS AND METHODS:
Study Design, Setting, and Duration
This was a hospital-based case–control study conducted in the Department of Biochemistry, in collaboration with the Department of Ophthalmology, Calcutta National Medical College, Kolkata. The study was carried out over a period of one year, commencing after obtaining ethical clearance from the institutional ethics committee and approval from the West Bengal University of Health Sciences.
Study Population
The study population consisted of middle-aged patients (45–65 years) with type 2 diabetes mellitus attending the Ophthalmology outpatient department at Calcutta National Medical College, Kolkata.
Inclusion and Exclusion Criteria
Patients were eligible if they had T2DM, were aged between 45 and 65 years, and had HbA1c levels ≤ 9%, and provided written informed consent. Patients were excluded if they had media opacity preventing fundus assessment, other retinal diseases, HbA1c > 9%, urine ACR ≥ 300 mg/g, serum creatinine > 1.4 mg/dL, or hypertension > 130/80 mmHg according to the AHA definition. Pregnant or lactating women, patients with diabetes duration greater than 15 years, or those currently on vitamin D supplementation were excluded. Additional exclusion criteria included a history of hyperparathyroidism or hypoparathyroidism, a history of Cushing’s syndrome or other HPA axis disorders, and systemic glucocorticoid therapy in the past month.
Study Variables
The dependent variables were serum vitamin D and cortisol levels. Independent variables included age, sex, occupation, addictions, dietary factors, comorbidities, and history of diabetes, hypertension, and hyperlipidemia.
Data Collection Methods
Data collection involved multiple steps. Patient interviews were conducted after obtaining informed consent, ensuring confidentiality, and recording demographic and medical details. Clinical examinations included measurement of blood pressure using a sphygmomanometer and neuropathy assessment using the monofilament test. Ophthalmological examination was performed by an ophthalmologist using slit lamp, indirect ophthalmoscope, and a 90D lens, with diabetic retinopathy graded by severity. Laboratory investigations included measurement of serum cortisol levels by chemiluminescent immunoassay (CLIA; Advia Centaur Cp autoanalyser), serum vitamin D (25-OH) levels by ELISA, and other parameters such as urea, creatinine, lipid profile, HbA1c, and urine ACR using an autoanalyser (modified colorimetry). Hemoglobin was measured using the non-cyanmethemoglobin colorimetry method, total and differential leukocyte counts were assessed by the impedance method (SYSMEX cell counter), and C-reactive protein was estimated by the standard method.
Study Tools
The study utilized laboratory equipment and ophthalmic instruments including incubators, refrigerators, vortex, shaker, glassware, micropipettes, centrifuge, ELISA reader/washer, vitamin D ELISA kit, autoanalysers (Advia Centaur Cp, Kone Lab 600 Prime, Bio Lyser 200), 90D lens, indirect ophthalmoscope, slit lamp, sphygmomanometer, and monofilament.
Sample Size Estimation and Power Calculation
Sample size was estimated using standard methods for unmatched case–control studies, incorporating inputs such as the anticipated proportion exposed in cases and controls (derived from prior studies), the desired type I error rate (α = 0.05, two-sided), desired study power (80%), and a case:control ratio of 1:1. Based on these parameters and the expected effect size, the calculated sample size was 164 participants per group to achieve 80% power. However, due to practical constraints within the one-year recruitment window, the final enrollment was limited to 85 participants per group using convenience sampling according to inclusion and exclusion criteria.
Ethical Clearance
The study was performed in accordance with the Declaration of Helsinki (2013 revision). Ethical approval was obtained from the Institutional Ethics Committee prior to initiation. Written informed consent was obtained from all participants after explaining the study objectives, procedures, and potential risks in their local language. Confidentiality of patient data was maintained throughout the study.
Statistical Analysis
Statistical analyses were performed using SPSS version 26.0 (IBM Corp., Armonk, NY, USA). The Kolmogorov–Smirnov test was applied to assess normality of data distribution. Descriptive statistics were expressed as mean ± standard deviation for normally distributed variables and as median values for non-normally distributed variables; categorical variables were expressed as numbers and percentages. Comparisons between two groups were made using the Student’s t-test or the Mann–Whitney U test, as appropriate. The χ² test was applied for categorical variables. Univariate and multivariate analyses were conducted to identify independent predictive factors. For comparisons among three groups, one-way ANOVA or the Kruskal–Wallis test was used, as appropriate. A p-value < 0.05 was considered statistically significant.
RESULTS:
Study population characteristics
The study included 85 cases and 85 controls. Among the cases, one participant had abnormally low cortisol levels at both 8:00 AM and 4:00 PM, which was further evaluated in the medicine clinic. Five participants did not provide the 4:00 PM blood sample. Data from these six participants were excluded. After removing three additional outliers, the analysis included 85 participants each in the case and control groups, with all requisite parameters measured. In this case–control study, the cases were further categorized into non-proliferative diabetic retinopathy (NPDR) and proliferative diabetic retinopathy (PDR) (Figure 1).
Flow of participants through the study from eligibility assessment to final analysis. Cases were further subclassified into non-proliferative diabetic retinopathy (NPDR) and proliferative diabetic retinopathy (PDR). Abbreviations: NPDR, non-proliferative diabetic retinopathy; PDR, proliferative diabetic retinopathy.
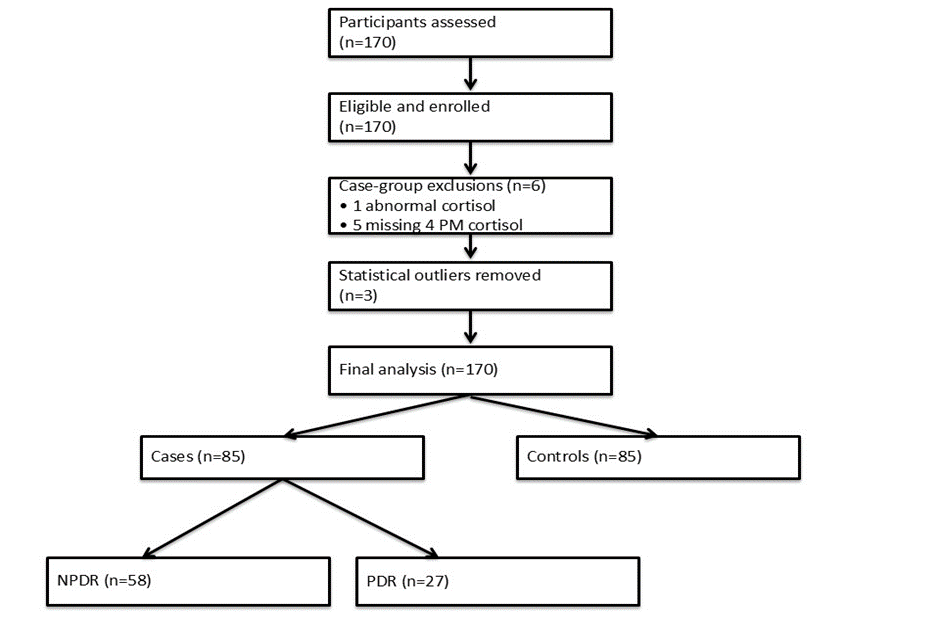
Figure 1. CONSORT-style flow diagram of study participants.
Table 1 presents the demographics and clinical characteristics of the study population. The baseline characteristics of the two groups were largely comparable in terms of gender distribution, lipid profile, BMI, and diabetes duration. However, patients in the case group were significantly older than controls. Several biochemical parameters including renal and inflammatory profiles differed significantly between groups. The case group showed lower hemoglobin levels and higher serum urea, creatinine, uric acid, CRP, and urinary albumin-to-creatinine ratio, Liver function also differed, with lower SGPT values in cases (Table 2).
While both fasting and postprandial blood glucose levels were higher in the case group, HbA1c levels remained similar between the groups.
Endocrine and nutritional assessments revealed significantly lower 25-OH vitamin D levels and higher cortisol concentrations (both morning and evening) in the case group (Figure 2).
Table 1: Demographic and laboratory parameters in case and control groups
|
Parameters |
Case group (n=85) |
Control group (n=85) |
P-value |
|
Age [years], mean (SD) |
58.3 (5.4) |
55.5 (8.0) |
<0.001 |
|
Sex, n (%) |
|
|
|
|
Men |
40 (47.1) |
40 (47.1) |
1.000 |
|
Women |
45 (52.9) |
45 (52.9) |
|
|
Hemoglobin [%], mean (SD) |
12.2 (1.2) |
12.9 (1.4) |
0.001 |
|
Urea [mg/dL], mean (SD) |
27.5 (8.4) |
24.4 (5.8) |
0.005 |
|
Creatinine [mg/dL], mean (SD) |
0.9 (0.2) |
1.0 (0.2) |
0.003 |
|
Uric acid [mg/dL] |
6.8 (2.6-9.0) |
5.9 (0.3-8.3) |
0.001 |
|
CRP [mg/dL] |
9.8 (0.6-38.8) |
3.4 (0.2-14.9) |
<0.001 |
|
UACR [mg/g] |
80.4 (2.7-292.2) |
28.2 (1.1-245.0) |
<0.001 |
|
SGPT [U/L] |
19.0 (8.0-52.0) |
30.0 (10.0-63.0.) |
<0.001 |
|
CH, mean (SD) |
180.2 (39.7) |
186.9 (25.5) |
0.193 |
|
TRIGLYCERIDES |
187.0 (55.0-613.0) |
216.0 (100.0-388.0) |
0.034 |
|
HDL [mg/dL] |
37.0 (28.0-70.0) |
36.0 (28.0-70.0) |
0.054 |
|
LDL [mg/dL], mean (SD) |
110.0 (32.7) |
102.1 (22.2) |
0.069 |
|
FBS [mg/dL] |
132.0 (30.0-261.0) |
126.0 (72.0-166.0) |
<0.001 |
|
HbA1c [%] |
7.8 (5.1-8.9) |
8.0 (5.8-8.9) |
0.643 |
|
BMI [kg/m2] |
24.8 (17.6-31.7) |
24.8 (17.7-31.8) |
0.848 |
|
CH, mean (SD) |
180.2 (39.7) |
186.9 (25.5) |
0.193 |
|
PPBS [mg/dL], mean (SD) |
219.2 (45.9) |
194.2 (54.0) |
0.001 |
|
Vitamin D [ng/mL], mean (SD) |
13.2 (7.2) |
26.2 (8.2) |
<0.001 |
|
Serum cortisol (µg/dL), mean (SD) 8 AM 4 PM |
17.0 (3.6) 12.2 (3.4) |
14.2 (4.2) 7.2 (2.2) |
<0.001 <0.001 |
|
Serum cortisol 8 AM [µg/dL], n (%) <10 >10 |
1 (1.2) 84 (98.8) |
12 (14.1) 73 (85.9) |
0.002 |
|
Serum cortisol 4 PM [µg/dL], n (%) |
|
|
|
|
<10 |
26 (30.6) |
74 (87.1) |
<0.001 |
|
>10 |
59 (69.4) |
11 (12.9) |
|
|
Vitamin D [ng/mL] |
|
|
|
|
<30 |
78 (91.8) |
56 (65.9) |
<0.001 |
|
>30 |
7 (8.2) |
29 (34.1) |
|
|
Vitamin D [ng/mL] |
|
|
|
|
<20 |
75 (88.2) |
21 (24.7) |
<0.001 |
|
>20 |
10 (11.8) |
64 (75.3) |
|
|
Duration of diabetes(yrs) |
9.0 (5.0-14.0) |
9.0 (5.0-14.0) |
1.000 |
|
Data presented as median (range), unless otherwise specified. BMI, body mass index; CRP, c-reactive protein; FBS, fasting blood sugar; HbA1c, glycated hemoglobin; HDL, high-density lipoprotein; LDL, low-density lipoprotein;PPBS, post prandial blood sugar;SGPT, serum glutamate pyruvate transaminase; UACR, urine albumin-to-creatinine ratio. |
|||
Comparative Clinical Characteristics of NPDR, PDR, and NDR Groups
Patients with PDR were older compared to those in the NPDR and NDR groups (p=0.012). No significant differences were observed in gender distribution across the groups.
Significant differences were found in several clinical and biochemical parameters:
Hemoglobin levels were significantly lower in NPDR and PDR groups compared to NDR (p=0.003). Urea, creatinine, and uric acid levels were all higher in NPDR and PDR, indicating compromised renal function (p-values <0.05). Comparing the inflammation and Liver Enzymes, C-reactive protein (CRP) was markedly elevated in NPDR and PDR groups (p<0.001), and SGPT levels were significantly lower in retinopathy groups compared to NDR (p<0.001). With regard to the lipid Profile, HDL was slightly higher in the NPDR group (p=0.023), with no significant differences in total cholesterol, LDL, or triglycerides. PDR patients had a significantly longer duration of diabetes than NPDR and NDR groups (p<0.001). Fasting and postprandial blood sugar levels were significantly higher in retinopathy groups, especially PPBS (p=0.006), though HbA1c levels were comparable across groups (p=0.283).
Vitamin D levels were significantly lower in NPDR and PDR groups compared to NDR (p<0.001; Figure 3). Both morning (8 AM) and evening (4 PM) serum cortisol levels were substantially higher in patients with retinopathy, especially PDR (p<0.001 for both). The proportion of patients with elevated cortisol (>10 µg/dL) was significantly greater in the PDR group, particularly at 4 PM.
Table 2. Clinical characteristics of NPDR, PDR, and NDR in participant
|
Parameters |
NDPR group (n=58) |
PDR group (n=27) |
NDR group (n=85) |
P-value |
|
Age [years] |
59.0 (45.0-67.0) |
62.0 (50.0-65.0) |
56.0 (6.2-64.0) |
0.012 |
|
Sex, n (%) |
|
|
|
|
|
Men |
26 (44.8) |
14 (51.9) |
40 (47.1) |
0.833 |
|
Women |
32 (55.2) |
13 (48.1) |
45 (52.9) |
|
|
Hemoglobin [%], mean (SD) |
12.2 (1.3) |
12.3 (1.0) |
12.9 (1.4) |
0.003 |
|
Urea [mg/dL], mean (SD) |
27.2 (9.2) |
28.2 (6.6) |
24.4 (5.8) |
0.017 |
|
Creatinine [mg/dL], mean (SD) |
0.9 (0.2) |
1.0 (0.2) |
1.0 (0.2) |
0.004 |
|
Uric acid [mg/dL] |
6.8 (2.6-8.8) |
7.2 (5.3-9.0) |
5.9 (0.0-8.3) |
0.001 |
|
CRP [mg/dL] |
10.1 (2.2-38.8) |
9.8 (0.6-25.3) |
3.4 (0.2-14.9) |
<0.001 |
|
UACR [mg/g] |
73.9 (2.7-258.6) |
92.4 (6.0-292.2) |
28.2 (1.1-245.0) |
<0.001 |
|
SGPT [U/L] |
18.0 (8.0-40.0) |
22.0 (8.0-52.0) |
30.0 (10.0-63.0) |
<0.001 |
|
CH, mean (SD) |
179.6 (40.8) |
181.6 (38.0) |
186.9 (25.5) |
0.416 |
|
TR |
187.5 (70.0-613.0) |
168.0 (55.0-424.0) |
216.0 (100.0-388.0) |
0.096 |
|
HDL [mg/dL], mean (SD) |
40.3 (9.6) |
37.6 (5.9) |
36.8 (6.1) |
0.023 |
|
LDL [mg/dL], mean (SD) |
107.3 (33.9) |
115.7 (29.6) |
102.1 (22.2) |
0.083 |
|
FBS[mg/dL] |
131.0 (30.0-261.0) |
132.0 (88.0-188.0) |
126.0 (72.0-166.0) |
0.001 |
|
PPBS[mg/dL], mean (SD) |
218.3 (43.6) |
221.2 (51.1) |
194.2 (54.0) |
0.006 |
|
Vitamin D [ng/mL], mean (SD) |
14.4 (8.1) |
10.5 (3.3) |
26.2 (8.2) |
<0.001 |
|
Serum cortisol 8 AM (µg/dL) |
16.1 (10.4-24.0) |
20.0 (9.0-24.4) |
13.8 (7.4-26.2) |
<0.001 |
|
Serum cortisol 4 PM (µg/dL) |
10.9 (5.1-16.2) |
14.9 (6.4-24.2) |
7.1 (3.1-12.0) |
<0.001 |
|
HBA1c [%] |
7.9 (6.7-8.9) |
7.7 (5.1-8.9) |
8.0 (5.8-8.9) |
0.283 |
|
BMI [kg/m2] |
24.6 (17.6-30.8) |
25.8 (18.0-31.7) |
24.8 (17.7-31.8) |
0.204 |
|
Serum cortisol 8 AM [µg/dL], n (%) <10 >10 |
- 58 (100.0) |
1 (3.7) 26 (96.3) |
12 (14.1) 73 (85.9) |
0.005 |
|
Serum cortisol 4 PM [µg/dL], n (%) |
|
|
|
|
|
<10 |
24 (41.4) |
2 (7.4) |
74 (87.1) |
<0.001 |
|
>10 |
34 (58.6) |
25 (92.6) |
11 (12.9) |
|
|
Vitamin D [ng/mL] |
|
|
|
|
|
<30 |
51 (87.9) |
27 (100.0) |
56 (65.9) |
<0.001 |
|
>30 |
7 (12.1) |
- |
29 (34.1) |
|
|
Duration of diabetes (yrs) |
8.0 (5.0-12.0) |
13.0 (9.0-14.0) |
9.0 (5.0-14.0) |
<0.001 |
|
Data presented as median (range), unless otherwise specified. BMI, body mass index; CRP, c-reactive protein; FBS, fasting blood sugar; HbA1c, glycated hemoglobin; HDL, high-density lipoprotein; LDL, low-density lipoprotein;PPBS, post prandial blood sugar; SGPT, serum glutamate pyruvate transaminase; UACR, urine albumin-to-creatinine ratio. |
||||
Cortisol levels and Risk of Diabetic Retinopathy
ROC curve analysis was performed to evaluate the predictive ability of serum cortisol levels for diabetic retinopathy. Morning cortisol levels (8:00 AM) showed limited predictive value for non-proliferative diabetic retinopathy (NPDR), with an AUC of 0.561, sensitivity of 69%, and specificity of 44.6% at a cutoff of 14.3 µg/dL (p = 0.198). In contrast, evening cortisol levels (4:00 PM) demonstrated better discriminatory power for NPDR, with an AUC of 0.693, sensitivity of 75.9%, and specificity of 56.2% at a cutoff of 8.6 µg/dL (p < 0.001).
For proliferative diabetic retinopathy (PDR), morning cortisol had an AUC of 0.756, with 70.4% sensitivity and 74.8% specificity at a cutoff of 17.8 µg/dL (p = 0.001). Notably, evening cortisol levels were highly predictive of PDR, yielding an AUC of 0.931, with 88.9% sensitivity and 93.7% specificity at a cutoff of 13.3 µg/dL (p < 0.01; Figure 4).
Quartile analysis of serum cortisol further highlighted this trend, with higher morning and evening cortisol quartiles disproportionately represented among NPDR and PDR patients compared to those without retinopathy (Table 6). The gradient was more pronounced for evening cortisol, supporting its superior discriminatory value. Additionally, analysis of delta cortisol (morning–evening difference) showed significantly blunted diurnal decline in cases versus controls, with the lowest values in the PDR group (Table 7). This finding suggests loss of normal cortisol rhythmicity in patients with advanced retinopathy.
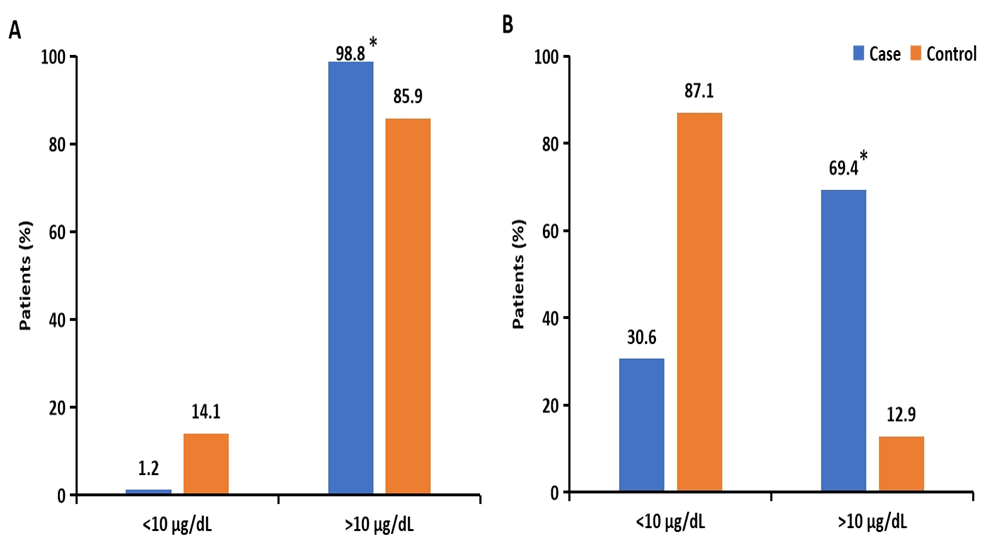
Figure 2. Distribution of serum cortisol levels among cases and controls. (A) Morning (8 AM) serum cortisol levels. (B) Evening (4 PM) serum cortisol levels. * represents P<0.05.

Figure 3. Distribution of vitamin D levels among cases and controls. (A) Patients with vitamin D <30 ng/mL vs. ≥30 ng/mL. (B) Patients with vitamin D <20 ng/mL vs. ≥20 ng/mL. * represents P<0.05.

Figure 4. ROC curve of A) cortisol 8 AM, B) cortisol 4 PM and risk of NDPR, C) cortisol 8 AM, D) cortisol 4 PM and risk of PDR. The estimates of sensitivity, specificity, area under the curve (AUC), cut-offs and p-values are provided within the corresponding figure panel. AUC, area under curve; NDPR, non-proliferative diabetic retinopathy group; PDR, proliferative diabetic retinopathy.
Table 6. Quartiles of serum cortisol levels
|
Parameters |
NDPR group (n=58) |
PDR group (n=27) |
NDR group (n=85) |
P-value |
|
Serum cortisol 8 AM [µg/dL] |
|
|
|
|
|
Q1 (≤8.49) |
- |
- |
7 (8.2) |
|
|
Q2 (>8.49-10.3) |
- |
2 (7.4) |
9 (10.6) |
<0.001 |
|
Q3 (>10.3-12.9) |
10 (17.2) |
1 (3.7) |
23 (27.1) |
|
|
Q4 (>12.9) |
48 (82.8) |
24 (88.9) |
46 (54.1) |
|
|
Serum cortisol 4 PM [µg/dL] |
|
|
|
|
|
Q1 (≤8.49) |
14 (24.1) |
1 (3.7) |
62 (72.9) |
|
|
Q2 (>8.49-10.3) |
11 (19.0) |
1 (3.7) |
13 (15.3) |
<0.001 |
|
Q3 (>10.3-12.9) |
19 (32.8) |
1 (3.7) |
10 (11.8) |
|
|
Q4 (>12.9) |
14 (24.1) |
24 (88.9) |
- |
|
|
Data shown as n (%). |
||||
Table 7.Comparison of delta cortisol between study groups
|
Parameters |
Delta cortisol [µg /dL], mean (SD) |
P-value |
|
Case group (n=85) |
5.1 (2.3) |
<0.001 |
|
Control group (n=85) |
7.1 (2.8) |
|
|
NDPR group (n=58) |
5.3 (2.3) |
<0.001 |
|
PDR group (n=27) |
4.7 (2.3) |
|
|
NDR group (n=85) |
7.1 (2.8) |
Abbreviations: NPDR, non-proliferative diabetic retinopathy; PDR, proliferative diabetic retinopathy; NDR, no diabetic retinopathy.
DISCUSSION:
This case–control study demonstrated that patients with diabetic retinopathy (DR) had significantly lower serum vitamin D concentrations and higher serum cortisol levels compared to controls. Both findings suggest that nutritional and endocrine dysregulation may play a role in the development and progression of microvascular complications in type 2 diabetes mellitus (T2DM).
The role of vitamin D in DR has been increasingly recognized. Previous studies report a high prevalence of vitamin D deficiency among patients with T2DM [1]. Vitamin D receptors are expressed in the retina, supporting its potential involvement in retinal health. Mechanistically, vitamin D exerts immunomodulatory and anti-angiogenic effects, including the suppression of lymphocyte and natural killer cell proliferation and reduced production of pro-inflammatory cytokines [3]. Animal models further demonstrate that activated vitamin D inhibits retinal neovascularization in oxygen-induced ischemic retinopathy [4]. Clinical evidence links lower vitamin D levels to retinal microvascular damage and cardiovascular risk, which may be partly mediated through shared microvascular pathways [5]. Consistent with these reports, our findings revealed markedly lower vitamin D concentrations in patients with NPDR and PDR compared to those without retinopathy.
Cortisol dysregulation also emerged as a significant factor associated with DR in our study. Cortisol, secreted by the adrenal cortex in response to stress [6], elevates blood glucose through gluconeogenesis [7]. Chronic cortisol excess promotes insulin resistance, endothelial dysfunction, and oxidative stress, all of which may contribute to retinal microvascular injury. Our analysis revealed that serum cortisol levels were higher in DR patients compared to controls, with particularly elevated concentrations in the PDR subgroup.
Importantly, the predictive value of cortisol differed by time of measurement. While morning cortisol levels showed only modest predictive value for NPDR, evening cortisol was highly discriminatory for PDR, with an AUC of 0.931 and excellent sensitivity and specificity. These findings suggest that disruption of the normal circadian decline in cortisol may be a more sensitive indicator of retinopathy severity than absolute morning values. Quartile analysis reinforced this observation, with NPDR and PDR patients disproportionately represented in higher cortisol quartiles. Furthermore, delta cortisol (the morning–evening difference) was significantly blunted in DR patients compared to controls, with the lowest values observed in PDR. This attenuation of diurnal variation reflects a loss of cortisol rhythmicity, which has been reported in stress-related disorders and metabolic syndrome, and may indicate hypothalamic–pituitary–adrenal axis dysfunction in advanced DR.
The clinical implications of these findings are noteworthy. First, vitamin D deficiency screening and supplementation may represent a cost-effective adjunctive strategy to reduce DR risk, especially in populations with high prevalence of deficiency. Second, evening cortisol and delta cortisol could serve as novel biomarkers of DR severity, complementing glycemic indices such as HbA1c, which did not significantly differ between groups in our study. Identifying patients with blunted diurnal cortisol decline could help stratify risk and prioritize closer ophthalmic follow-up. Together, these results highlight the need for integrative approaches that incorporate metabolic, endocrine, and nutritional factors into DR risk assessment.
Limitations
This study has several limitations. First, the sample size was smaller than the calculated estimate due to recruitment constraints, which may have reduced statistical power, particularly for subgroup analyses. Second, the study was conducted at a single tertiary-care center, potentially limiting the generalizability of findings to broader populations. Third, given the case–control design, causal relationships between vitamin D deficiency, cortisol dysregulation, and DR progression cannot be established. Longitudinal studies are required to clarify temporal associations. Fourth, hypertensive patients were excluded to minimize confounding, but this limits applicability to the general diabetic population where hypertension is highly prevalent. Finally, measurement of serum vitamin D and cortisol at a single time point may not fully reflect long-term status or dynamic hormonal fluctuations.
CONCLUSION:
In this case–control study, patients with diabetic retinopathy exhibited significantly lower vitamin D concentrations and higher serum cortisol levels compared to controls. Evening cortisol levels and reduced delta cortisol emerged as strong predictors of disease severity, particularly in proliferative diabetic retinopathy. These findings suggest that vitamin D deficiency and cortisol dysregulation, especially blunted diurnal rhythmicity, may contribute to the pathogenesis of retinopathy. Screening for vitamin D deficiency and assessing cortisol patterns could aid in early identification of high-risk individuals, and may serve as adjunctive strategies to improve prevention and management of diabetic retinopathy.
REFERENCES:
1. [Original ref 10] — Prevalence of vitamin D deficiency in T2DM.
2. Example: Chiu KC, Chu A, Go VLW, Saad MF. Hypovitaminosis D is associated with insulin resistance and β cell dysfunction. Am J Clin Nutr. 2004;79(5):820-825. doi:10.1093/ajcn/79.5.820.
3. [Original ref 27] — Vitamin D receptor expression in retina.
4. Example: Neme A, Seuter S, Malinen M, Nurmi T, Tuomainen TP, Virtanen JK, et al. In vivo transcriptome changes of human peripheral blood mononuclear cells in response to vitamin D. J Steroid Biochem Mol Biol. 2019;188:71-76. doi:10.1016/j.jsbmb.2018.11.011.
5. [Original ref 17] — Immunomodulatory role of vitamin D.
6. Example: Prietl B, Treiber G, Pieber TR, Amrein K. Vitamin D and immune function. Nutrients. 2013;5(7):2502-2521. doi:10.3390/nu5072502.
7. [Original ref 18] — Vitamin D inhibition of retinal neovascularization in animal models.
8. Example: Albert DM, Scheef EA, Wang S, Mehraein F, Darjatmoko SR, Sorenson CM, Sheibani N. Calcitriol is a potent inhibitor of retinal neovascularization. Invest Ophthalmol Vis Sci. 2007;48(5):2327-2334. doi:10.1167/iovs.06-1260.
9. [Original ref 29] — Vitamin D and retinal microvascular/cardiovascular risk.
10. Example: Wong TY, Klein R, Klein BE, Cotch MF, Couper DJ, Lai H, et al. Retinal microvascular abnormalities and their relationship with hypertension, cardiovascular disease, and mortality. Surv Ophthalmol. 2001;46(1):59-80. doi:10.1016/S0039-6257(01)00234-0.
11. [Original ref 4] — Cortisol secretion physiology.
12. Example: Tsigos C, Chrousos GP. Hypothalamic–pituitary–adrenal axis, neuroendocrine factors and stress. J Psychosom Res. 2002;53(4):865-871. doi:10.1016/S0022-3999(02)00429-4.
13. [Original ref 5] — Cortisol and gluconeogenesis.
14. Example: Dinneen S, Alzaid A, Miles J, Rizza R. Metabolic effects of the nocturnal rise in cortisol on carbohydrate metabolism in normal humans. J Clin Invest. 1993;92(5):2283-2290. doi:10.1172/JCI116824.
15. [Original ref 20] — AHA definition of hypertension.
16. Example: Whelton PK, Carey RM, Aronow WS, Casey DE Jr, Collins KJ, Dennison Himmelfarb C, et al. 2017 ACC/AHA/AAPA/ABC/ACPM/AGS/APhA/ASH/ASPC/NMA/PCNA guideline for the prevention, detection, evaluation, and management of high blood pressure in adults. J Am Coll Cardiol. 2018;71(19):e127-e248. doi:10.1016/j.jacc.2017.11.006.